Biodiversity and Sustainability Advisory Committee Meeting
A Biodiversity and Sustainability
Advisory Committee Meeting of Byron Shire Council will be held as follows:
|
Venue
|
Conference Room, Station Street, Mullumbimby
|
|
Date
|
Thursday, 18 February 2016
|
|
Time
|
9.00am
|

Shannon Burt
Director Sustainable Environment and Economy I2016/58
Distributed 11/02/16
What is a “Conflict of Interests” - A conflict of
interests can be of two types:
Pecuniary - an interest that a person has in a matter because of a reasonable
likelihood or expectation of appreciable financial gain or loss to the person
or another person with whom the person is associated.
Non-pecuniary – a private or personal interest that a Council
official has that does not amount to a pecuniary interest as defined in the
Local Government Act (eg. A friendship, membership of an association, society
or trade union or involvement or interest in an activity and may include an
interest of a financial nature).
Remoteness – a person does not have a pecuniary interest in a matter
if the interest is so remote or insignificant that it could not reasonably be
regarded as likely to influence any decision the person might make in relation
to a matter or if the interest is of a kind specified in Section 448 of the
Local Government Act.
Who has a Pecuniary Interest? - a person has a pecuniary interest in a
matter if the pecuniary interest is the interest of the person, or another
person with whom the person is associated (see below).
Relatives, Partners - a person is taken to have a pecuniary interest in a
matter if:
§ The person’s
spouse or de facto partner or a relative of the person has a pecuniary interest
in the matter, or
§ The person, or a
nominee, partners or employer of the person, is a member of a company or other
body that has a pecuniary interest in the matter.
N.B. “Relative”, in relation to a person means any of the
following:
(a) the
parent, grandparent, brother, sister, uncle, aunt, nephew, niece, lineal
descends or adopted child of the person or of the person’s spouse;
(b) the
spouse or de facto partners of the person or of a person referred to in
paragraph (a)
No Interest in the Matter - however, a person is not taken to have a
pecuniary interest in a matter:
§ If the person is
unaware of the relevant pecuniary interest of the spouse, de facto partner,
relative or company or other body, or
§ Just because the
person is a member of, or is employed by, the Council.
§ Just because the
person is a member of, or a delegate of the Council to, a company or other body
that has a pecuniary interest in the matter provided that the person has no
beneficial interest in any shares of the company or body.
Disclosure and participation in meetings
§ A Councillor or a
member of a Council Committee who has a pecuniary interest in any matter with
which the Council is concerned and who is present at a meeting of the Council
or Committee at which the matter is being considered must disclose the nature
of the interest to the meeting as soon as practicable.
§ The Councillor or
member must not be present at, or in sight of, the meeting of the Council or
Committee:
(a) at any
time during which the matter is being considered or discussed by the Council or
Committee, or
(b) at any
time during which the Council or Committee is voting on any question in
relation to the matter.
No Knowledge - a person does not breach this Clause if the person did
not know and could not reasonably be expected to have known that the matter
under consideration at the meeting was a matter in which he or she had a
pecuniary interest.
Participation in Meetings Despite Pecuniary Interest (S 452 Act)
A Councillor is not prevented from taking part in the consideration or
discussion of, or from voting on, any of the matters/questions detailed in
Section 452 of the Local Government Act.
Non-pecuniary Interests - Must be disclosed in meetings.
There are a broad range of options available for managing conflicts &
the option chosen will depend on an assessment of the circumstances of the
matter, the nature of the interest and the significance of the issue being
dealt with. Non-pecuniary conflicts of interests must be dealt with in at
least one of the following ways:
§ It may be appropriate
that no action be taken where the potential for conflict is minimal.
However, Councillors should consider providing an explanation of why they
consider a conflict does not exist.
§ Limit involvement if
practical (eg. Participate in discussion but not in decision making or
vice-versa). Care needs to be taken when exercising this option.
§ Remove the source of
the conflict (eg. Relinquishing or divesting the personal interest that creates
the conflict)
§ Have no involvement by
absenting yourself from and not taking part in any debate or voting on the
issue as if the provisions in S451 of the Local Government Act apply
(particularly if you have a significant non-pecuniary interest)
RECORDING OF VOTING ON PLANNING MATTERS
Clause 375A of the Local Government Act 1993
– Recording of voting on planning matters
(1) In this section, planning
decision means a decision made in the exercise of a function of a council
under the Environmental Planning and Assessment Act 1979:
(a) including a decision
relating to a development application, an environmental planning instrument, a
development control plan or a development contribution plan under that Act, but
(b) not including the making of
an order under Division 2A of Part 6 of that Act.
(2) The general manager is
required to keep a register containing, for each planning decision made at a
meeting of the council or a council committee, the names of the councillors who
supported the decision and the names of any councillors who opposed (or are
taken to have opposed) the decision.
(3) For the purpose of maintaining
the register, a division is required to be called whenever a motion for a
planning decision is put at a meeting of the council or a council committee.
(4) Each decision recorded in
the register is to be described in the register or identified in a manner that
enables the description to be obtained from another publicly available
document, and is to include the information required by the regulations.
(5) This section extends to a
meeting that is closed to the public.
Biodiversity and Sustainability Advisory Committee
Meeting
BUSINESS OF MEETING
1. Apologies
2. Declarations of Interest
– Pecuniary and Non-Pecuniary
3. Adoption of Minutes from
Previous Meetings
3.1 Biodiversity
and Sustainability Advisory Committee Meeting held on 12 November 2015
4. Business Arising From
Previous Minutes
5. Staff Reports
Sustainable Environment and Economy
5.1 Environmental
Levy Budget ............................................................................................. 4
5.2 High
Conservation Value (HCV) and Office of Environment and Heritage's High
Environmental Value (HEV) methodology.............................................................................................. 13
5.3 Wildlife
Corridor Mapping................................................................................................ 22
Staff Reports - Sustainable Environment and Economy 5.1
Staff Reports - Sustainable Environment and
Economy
Report No. 5.1 Environmental
Levy Budget
Directorate: Sustainable
Environment and Economy
Report
Author: Sharyn
French, Manager Environmental and Economic Planning
File No: I2015/343
Theme: Ecology
Planning Policy and Natural Environment
Summary:
This report provides information on the projects funded by
the Environmental Levy in accordance with Council’s policy.
|
RECOMMENDATION:
That the
Biodiversity and Sustainability Advisory Committee note this report.
|
Attachments:
1 Policy
Environmental Levy Implementation No 15/003 adopted afer close of
exhibition 7/5/2015 Res No. 15-094, E2015/31373
, page 7
Report
Council’s adopted
Environmental Levy Implementation Policy, Attachment 1, states:
5. POLICY STATEMENT
5.1. The Biodiversity and
Sustainability Advisory Committee will review the allocation of funds from the
Environmental Levy, namely by:
a)
Providing advice to Council on matters to be considered for funding from the Environmental
Levy each year
b)
Reviewing the projects funded by the Environmental levy on a quarterly basis, following
advice provided by Council staff and report progress to Council
c)
Reviewing annually the draft budget for expenditure of the Environmental Levy
and providing advice to Council on both the allocation and expenditure of funds
consistent with the Environmental Levy Terms of Reference including
prioritisation and monitoring environmental outcomes of Levy funded projects
The following information
on the 2015/16 allocation and expenditure of the Environmental Levy is provided
for the Committees consideration.
Table 1: 2015/16 Environmental Levy allocation and
expenditure
|
Activity
|
2015/16
Allocation $
|
Expenditure to
31 January 2016
|
Comment
|
|
Staff wages
|
236,200
|
130,500
|
Funds Bush Regeneration
Team, Environmental Administration Office and partly funds Coastal Estuary
Officer and Sustainability Officer
|
|
Operational Costs - Bush
Regeneration Team
|
5,200
|
3,497
|
Purchase of tools and
supplies
|
|
Community Infrastructure Maintenance
Program
|
9,200
|
954
|
Allocated to implementation
of Roadside Vegetation Management Plan
|
|
CZMP for Byron Bay
Embayment
|
39,900
|
38,084
|
Allocated to contract with
Water Research Laboratory for preparation of the Coastal Hazard Management
Study Byron Bay Embayment
|
|
Feral animal control program
|
12,500
|
850
|
Allocated to trapping
program in conjunction with Koala Connections project and Local Land
Services.
|
|
Low Carbon Strategy
|
10,000
|
500
|
Allocated to implementation
of priority Low Carbon Strategy actions.
|
|
Land for Wildlife Program
|
17,100
(c/o 2014/15)
|
3,815
|
Council’s
contribution to $98,000 NSW Environmental Trust grant, a 3 year project
commenced January 2015.
|
|
Bangalow Waterfront
Environmental Works
|
24,300
(c/o 2014/15)
|
500
|
Riparian restoration works
associated with removal of Bangalow weir.
|
|
Vegetation Mapping Stage 2
|
20,000
(c/o 2014/15)
|
18,771
|
Allocated to consultants
engaged in mapping review.
|
|
Flying Fox Plan of
Management
|
33,300
|
10,225
|
Allocated to development of
Mullumbimby Flying Fox Plan and implementation of high priority actions.
|
|
TOTAL
|
407,700
|
207,696
|
|
Council has commenced budget preparations for the 2016/17
financial year. In February and March, staff will finalise compiling the first
draft 2016/17 budget for Councillors consideration at a Strategic Planning
Workshop in late March and reporting to Council in early April. The draft
budget will be exhibited in April/May for adoption by Council in June.
Less staff wages, there are approximately $156,000
Environmental Levy funds available to deliver projects in 2016/17. These funds
are proposed to be disbursed to the following projects:
· Biodiversity and
Conservation Strategy review - $20,000
· Updating
vegetation mapping with 2015 high resolution aerial imagery- $61,400
· Low Carbon
Strategy actions - $13,000
· Coastal Zone
Management Plan actions (excluding ‘coastal protection works’)
$39,900
· Roadside
Vegetation Management Plan - $9,200
· Wild dog and feral
animal control - $12,500
In line with the Environmental Levy Implementation Policy,
the Biodiversity and Sustainability Committee should consider providing advice
to Council on matters to be considered for funding from the Environmental Levy.
Financial Implications
The eventual budget
determined for the Environmental Levy for 2016/17 will be resolved by Council
in June 2016.
Statutory and Policy Compliance Implications
Nil
Staff Reports - Sustainable Environment and Economy 5.1 - Attachment 1

BYRON SHIRE COUNCIL
POLICY NO. 15/003
Environmental Levy
Implementation
E2015/31373
Staff Reports - Sustainable Environment and Economy 5.1 - Attachment 1
INFORMATION
ABOUT THIS DOCUMENT
|
Date Adopted by
Council
|
7 May 2015
|
Resolution No.
|
15-094
|
|
Policy Responsibility
|
Manager Land and
Natural Environment
|
|
Review Timeframe
|
As required
|
|
Last Review Date:
|
|
Next Scheduled Review
Date
|
|
Document History
|
Doc No.
|
Date Amended
|
Details Comments eg
Resolution No.
|
|
E2014/44800
|
26 June 2014
|
Draft Version
after Res 14-321
|
|
E2014/61683
|
11 September 2014
|
Draft
incorporating Biodiversity & Sustainability Advisory Committee
recommendations (public exhibition version Res 15-94)
|
|
E2015/31373
|
7/5/2015
|
Adopted after close of
exhibition 7/5/2015 as per Res 15-094 no submissions received
|
Further Document
Information and Relationships
|
Related Legislation*
|
Coastal Protection Act 1979
|
|
Related Policies
|
Byron Biodiversity
Conservation Strategy
Byron Low Carbon
Strategy
Coastal Zone Management
Plans
|
|
Related Procedures/
Protocols, Statements, documents
|
|
Note: Any reference to
Legislation will be updated in the Policy as required. See website http://www.legislation.nsw.gov.au/ for current Acts, Regulations and Environmental
Planning Instruments.
Staff Reports - Sustainable Environment and Economy 5.1 - Attachment 1
TABLE OF CONTENTS
1. OBJECTIVES............................................................................................................................... 1
2. BACKGROUND........................................................................................................................... 1
3. Principals................................................................................................................................ 1
4. Terms of Reference........................................................................................................... 1
5. POLICY
STATEMENT................................................................................................................. 2
This Page has been
intentionally left blank.
Staff Reports - Sustainable Environment and Economy 5.1 - Attachment 1
Policy No. 15/003
|
POLICY TITLE
|
ENVIRONMENTAL
LEVY IMPLEMENTATION POLICY
|
1. OBJECTIVES
1.1. To
inform the allocation of revenue raised through the Environmental Levy in the
Byron Shire Council local government area.
1.2. To
outline the arrangements for allocating and managing the Environmental Levy
funds
2. BACKGROUND
Byron Shire is well know for its diverse, natural
environment including beautiful coastlines, lush rainforests, creeks, rivers
and mountain ranges which form part of the remnants of the Wollumbin caldera.
These environmental assets are supported by an active and aware community that
values and promotes the protection and enhancement of the environment.
Following the adoption of the Byron Biodiversity
Conservation Strategy in 2004 Council received approval from the NSW government
to apply a special rate variation of 2% for four years to fund a Biodiversity
Levy in order to implement the Byron Biodiversity Conservation Strategy. In
2008, the Biodiversity Levy was replaced with an Environmental Levy that
continues to support the implementation of the Byron Biodiversity Conservation
Strategy as well as Council's sustainability and coastal programs.
The Environment Levy is a key revenue source to assist in the
implementation of Council endorsed environmental plans and strategies. The Levy
has been essential to the successes achieved through the implementation of a
range of biodiversity, coastal and sustainability programs and enabled Council
to leverage significant additional funding via external grants.
3. Principles
The Environmental Levy is to be used to fund activities
which either:
3.1. Identify,
maintain, protect or enhance native biodiversity, ecosystems and ecological
processes.
3.2. Reduce
Byron Shire’s greenhouse gas emissions or improve the environmental
sustainability and resilience of Council and the community.
3.3. Undertake
studies and prepare plans for coastal processes, values and risks and implement
those actions that address protecting or enhancing coastal biodiversity,
ecosystems and ecological processes.
4. Terms of Reference
The
Environmental Levy will only be used to fund staff, priority actions and
projects consistent with:
4.1. Developing
and/or delivering the Byron Biodiversity Conservation Strategy
4.2. Developing
and/or delivering the Roadside Vegetation Management Plan
4.3. Developing
and/or delivering the Byron Shire Low Carbon Strategy
4.4. Developing
Coastal Zone Management Plans (CZMP), including estuary management plans, and
delivering actions that are consistent with the above Principles, and/or the
objectives of the above strategies, but not the implementation of ‘coastal
protection works’ as defined under the Coastal Protection Act 1979[1].
5. POLICY STATEMENT
5.1. The
Biodiversity and Sustainability Advisory Committee will review the allocation
of funds from the Environmental Levy, namely by:
a) Providing advice
to Council on matters to be considered for funding from the Environmental Levy
each year
b) Reviewing the
projects funded by the Environmental levy on a quarterly basis, following
advice provided by Council staff and report progress to Council
c) Reviewing annually
the draft budget for expenditure of the Environmental Levy and providing advice
to Council on both the allocation and expenditure of funds consistent with the
Environmental Levy Terms of Reference including prioritisation and monitoring
environmental outcomes of Levy funded projects
5.2. All
funds collected including any funds raised through Environment Levy business
activities is held and accounted for separately from Council’s general
revenue.
5.3. Environment
Levy funds should not be available at any time for expenditure as general
revenue in accordance with principles of the Environmental Levy.
5.4. Any
unspent funds at the end of financial year are to be returned to the
Environment Levy budget.
5.5. The
Environment Levy can be used for leveraging funding through grants and
partnership opportunities offered by government and other organisations.
5.6. Funds
from the Environment Levy may be quarantined or saved annually in order to
compound funds over subsequent years to raise a larger sum of funds for
designated projects or matching grants.
Staff Reports - Sustainable Environment and Economy 5.2
Report No. 5.2 High
Conservation Value (HCV) and Office of Environment and Heritage's High
Environmental Value (HEV) methodology
Directorate: Sustainable
Environment and Economy
Report
Author: Sharyn
French, Manager Environmental and Economic Planning
File No: I2015/1501
Theme: Ecology
Planning Policy and Natural Environment
Summary:
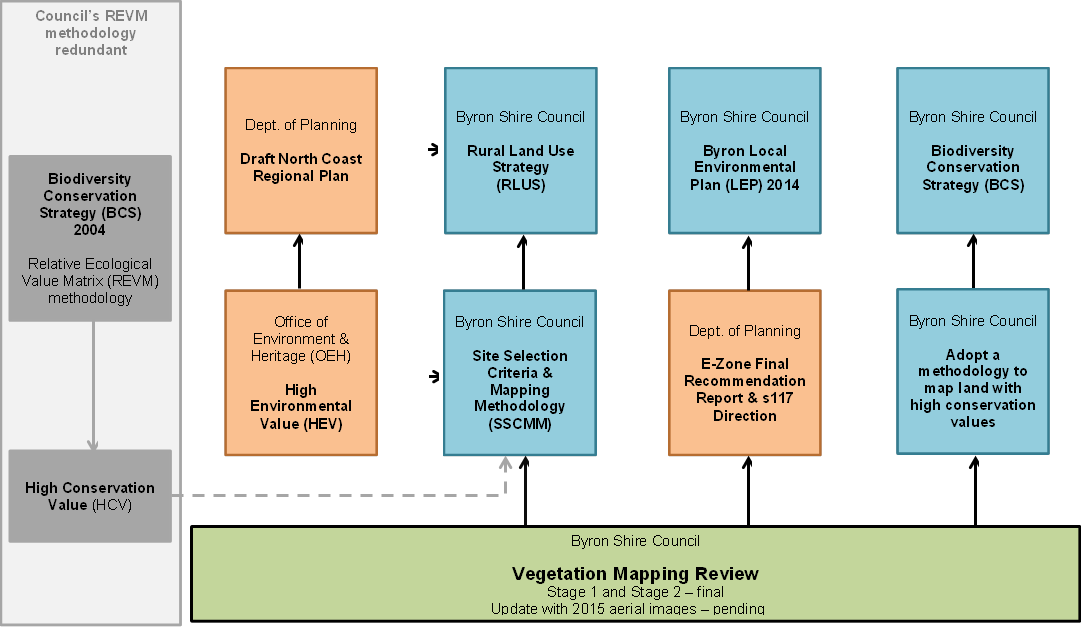
The methodology used to derive Council’s High
Conservation Value (HCV) vegetation, known as the Relative Ecological Values
Matrix (REVM), is redundant. Some of the data sets used to inform HCV are no
longer supported and the methodology is no longer considered current best
practice. The Office of Environment and Heritage has developed a state
wide model to map High Environmental Values (HEV). The HEV model has been used
to inform the Department of Planning’s Draft North Coast Regional Plan
(to be released for comment in early 2016). This plan will replace the
current Far North Coast Regional Strategy that Councils are required to
consider when preparing local land use strategies.
The Office of Environment and Heritage’s HEV model
will be used to inform the preparation of Council’s draft Rural Land Use
Strategy, providing a consistent northern NSW approach to the identification of
land with high environmental values and in accordance with the state
government’s regional plan.
|
RECOMMENDATION:
That the Biodiversity and Sustainability
Committee note this report.
|
Attachments:
1 Relative
Ecological Value Matrix (REVM) used to derive HCV, E2015/81496 , page 17
2 Figure 1.
Relationship of vegetation mapping review to other projects, E2015/81622 ,
page 21
3 Confidential
- Office of Environment & Heritage HEV High Environmental Value Methodology
, E2015/81916
Report
Rural Land Use Strategy
Council at the 29 October 2015 meeting resolved (15-569) to
endorse the Site Suitability Criteria and Mapping Methodology (SSCMM) as a key
document to inform preparation of the Rural Land Use Strategy.
The SSCMM included land with HCV as a constrained matter,
thereby excluding it from future rural development.
Council at the 10 December 2015 meeting considered the
endorsed the Rural Land Use Strategy Site Selection Criteria and Mapping
Methodology and related maps and resolved to note that the ‘HCV’
mapping will be presented in conjunction with the draft Strategy to Council in
early 2016 for adoption.
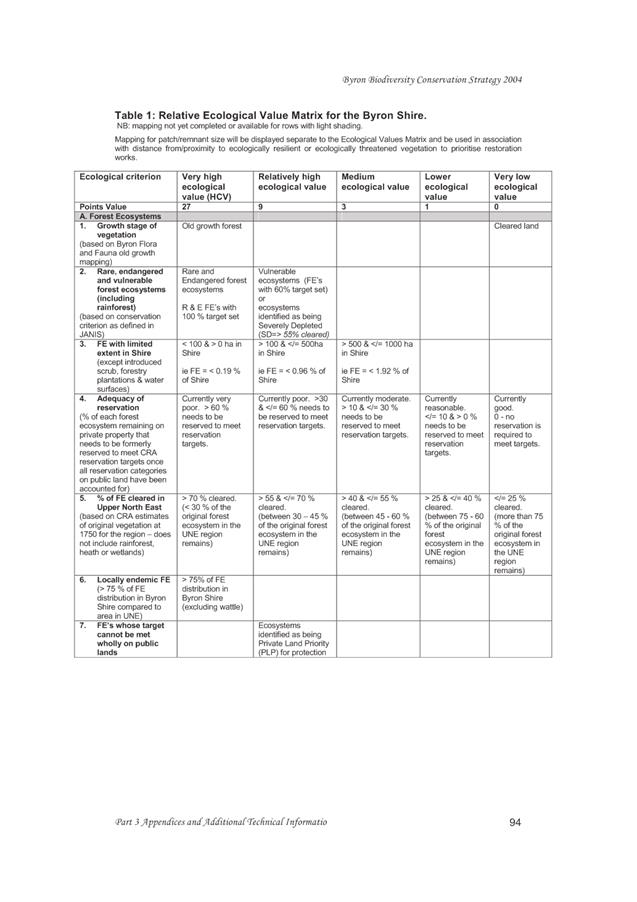
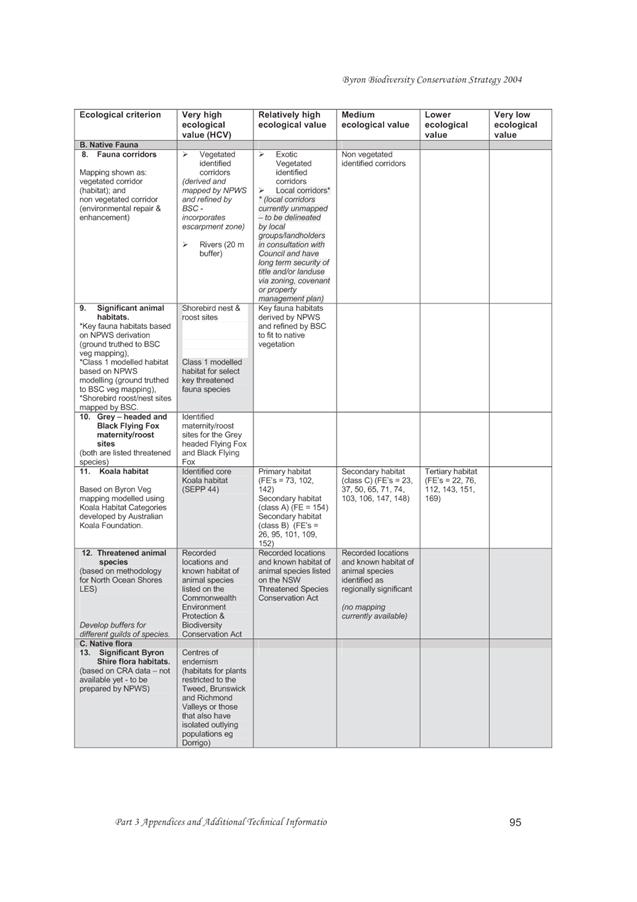
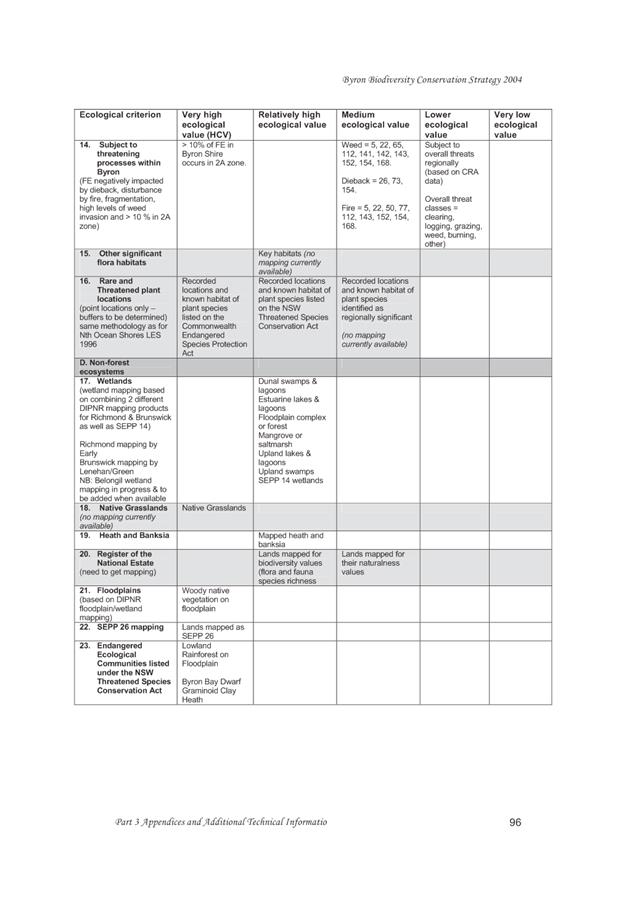
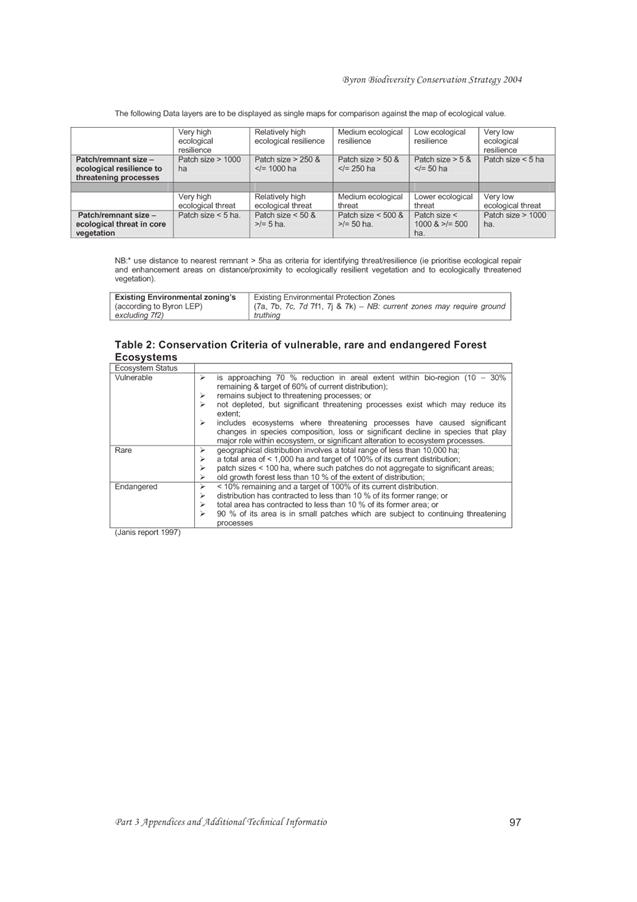
Relative Ecological
Value Matrix (REVM)
The REVM used to derive HCV was prepared over 10 years ago
as part of the Byron Biodiversity Conservation Strategy, 2004. Attachment
1 contains a copy of the ecological criteria used to inform the HCV map
layer. Areas with a combined score of 27 or more are regarded
as HCV.
Vegetation Mapping
Review
In 2015, Council commenced a review of the
vegetation mapping. Vegetation mapping was initially carried out in 1999 as
part of the Byron Flora and Fauna Study and was partly reviewed in 2007.
The review has improved the accuracy of the mapping and reflects changes in
vegetation extent and composition over time.
The review used a combination of aerial
photograph interpretation (API) primarily using 2014 aerial data, existing
information such as, vegetation survey data from various Council and state
government projects, and on-ground site inspections.
Vegetation was mapped using the State
Government’s Vegetation Information System (VIS) Classification database
to ensure consistency with NSW standards. This system uses three levels;
vegetation formations, vegetation classes and plant community types. The plant
community type classification provides the most detailed description of
vegetation and was developed by the state government to provide a standard approach
to vegetation classification and mapping.
The revised vegetation mapping for Stage 1
coastal lowlands and Stage 2 remainder of the Shire, have been publicly
exhibited and are now final. However, before reporting the final results,
Council resolved (15- 417) that following public exhibition of Stage 2
the vegetation mapping for both Stages 1 and 2 be reviewed against the
2015 Hi-Res Imagery from Land and Property Information (LPI) prior to
reporting back to Council. Council has now received the new 2015 aerial
imagery from LPI. Funding to review the vegetation maps against the 2015 aerial
imagery will need to be considered in the 2016/17 budget process.
The vegetation mapping review data will be used to inform
several pieces of work including the Rural Land Use Strategy, E Zones, and the
review of the Biodiversity Conservation Strategy, see Attachment 2,
Figure 1 which shows the relationship of the vegetation mapping to these
projects.
Office of Environment and Heritage’s High
Environmental Value (HEV) Methodology
The Office of Environment and Heritage (OEH) have produced a
methodology to identify land with high environmental values. Known as the
HEV methodology this has been used by the Department of Planning in the Draft
North Coast Regional Plan (to be released for comment in early 2016).
This plan will replace the current Far North Coast Regional Strategy
that Councils’ are required to consider when preparing local strategies
such as the Rural Land Use Strategy.
Confidential Attachment 3 lists the criteria
to be used in preparing a HEV map.
REVM/HCV versus HEV methodology
In reviewing the REVM methodology to update the HCV layer
with the new vegetation data, a number of issues became apparent. Most
significantly, the Forest Ecosystems types, used in the REVM, is out-dated and
no longer supported. The REVM was heavily based on Forest Ecosystem types which
are limited in relevance (as they excluded rainforest and non-forest
vegetation) and are out of date (their conservation significance is based
partly on their reservation status which has changed over time).
Additionally, and in comparing the two models (HCV and HEV) the following
issues were identified:
· there is still no
mapping available to complete those fields in the REVM that were marked as
having no mapping available in 2004. These are the fields shaded in light
grey in Attachment 1.
· the
2015 vegetation mapping review used the State
Government’s Vegetation Information System (VIS) Classification ensures
Council follows a state wide consistent approach. VIS doesn’t support the
outdated Forest Ecosystem types; it doesn’t translate its vegetation
categories into Forest Ecosystems and cannot be attempted as there are
vegetation categories that have no equivalent Forest Ecosystem.
· vegetation
classification, as used by VIS, has moved towards using Plant Community Types
and Keith classes. Office of Environment’s HEV method fits with the
approach used in Native Vegetation Plans and Biobanking, which rely on Plant
Community Type classifications. In addition, the OEH methodology
recognises private land with conservation commitments, riparian vegetation and
key habitats. It may also tie in more easily with the state
government’s E Zone criteria.
· the
plant community typing, the third and most detailed level used in VIS, is a
work in progress. Whilst there are some vegetation types that have no current
classification, OEH have a process to assess and determine new plant community
types. Byron’s vegetation mapping review identified potential new
plant community types and some issues with the existing plant community
descriptions for north-eastern NSW. These matters will be referred to
OEH. Whilst there may be difficulties in using an incomplete plant
community type classification for the purposes of HEV modelling, it is
preferable to the use of Forest Ecosystems and should serve well into the
future as new information becomes available the mapping can be readily updated.
· whilst the HEV
model does not consider wildlife corridors (as does the REVM model), Council
could chose to map wildlife corridors as a separate layer at a future stage.
Council’s Biodiversity and Sustainability Committee are reviewing
Council’s wildlife corridor methodology as part of the Biodiversity Conservation
Strategy review. Information resulting from this review will be provided to
Council in due course for consideration.
· it seems likely
that the HEV model would pick up the areas identified as HCV in the 2004
Biodiversity Strategy, and there may be an expansion of high environmental
value land across the Shire as a result of concerted community efforts to
restore the land
· the HEV riparian
buffers are based on 3rd order streams. The current Byron-Tweed
drainage layer is in some instances up to 30m out, as such any application of
buffers to this line cannot be satisfactory. The layer will need to be updated
by air photo interpretation and GIS and re-aligned prior to identifying
vegetation within 40m of streams. This could form part of a future HEV mapping
update.
Conclusion
The REVM/HCV methodology is redundant. The Office of
Environment and Heritage have developed a model to identify land with high
environmental values. Known as the HEV model, it has been used by the
Department of Planning to inform the soon to be released Draft North Coast
Regional Plan. Council’s local strategies such as the Draft Rural
Land Use Strategy need to be consistent with regional plans. Therefore,
OEHs HEV model is being applied to inform the Site Selection Criteria and
Mapping Methodology for the Rural Land Use Strategy.
The results of OEHs HEV methodology will be reported to
Council early 2016 meeting, along with the draft Rural Land Use Strategy for
consideration.
It is important to acknowledge that mapping is a reiterative
process and that any information gaps in the HEV model will be updated as new
information becomes available or when information changes such as amendments to
listed species under the Threatened Species Conservation Act.
Financial Implications
Nil
Statutory and Policy
Compliance Implications
The HEV methodology will be used to inform the Rural Land
Use Strategy, E Zones, and the review of the Biodiversity Conservation
Strategy.
Staff Reports - Sustainable Environment and Economy 5.2 - Attachment 1
Staff Reports - Sustainable Environment and Economy 5.2 - Attachment 2


 Figure 1. Relationship of vegetation mapping review to
other projects
Figure 1. Relationship of vegetation mapping review to
other projects
Staff Reports - Sustainable Environment and Economy 5.3
Report No. 5.3 Wildlife
Corridor Mapping
Directorate: Sustainable
Environment and Economy
Report
Author: Sharyn
French, Manager Environmental and Economic Planning
File No: I2016/30
Theme: Ecology
Planning Policy and Natural Environment
Summary:
This report provides background information to the Committee
of the mapping methodology for wildlife corridors. The Biodiversity
Conservation Strategy sub group will meet to further discuss.
|
RECOMMENDATION:
That the Biodiversity and Sustainability Advisory
Committee note the report and that the Biodiversity Conservation
Strategy sub group will meet to discuss the review of the wildlife corridor
mapping.
|
Attachments:
1 Wildlife
corridor mapping, E2016/1421 ,
page 28
2 OEH
Priority Investment Areas Mapping Guide, E2016/4859
, page 34
Report
Byron Shire’s wildlife corridors were developed as
part of the Byron Biodiversity Conservation Strategy (BCS) 2004 and are based
on wildlife corridor mapping produced by National Parks and Wildlife Service
(NPWS). The NPWS mapping was refined by ecologists and botanists involved in
the production of the BCS based on detailed knowledge of the Byron Shire
landscape and the ecology of local fauna and flora species. Wildlife corridors
have been developed to identify important links across the landscape to
encourage the movement of flora and fauna species.
The current mapping represents existing, potential and
preferred habitat and corridors as a single layer. The original mapping
categorised the land as “primary corridors” comprising remnant
native vegetation and “secondary corridors” – cleared land
which lay in important connectivity locations as well as corridors dominated by
exotic vegetation such as camphor laurel. In 2007, the different
classifications were collapsed into a single GIS layer for wildlife corridors. (see
Attachment 1 – Figure 1A)
When viewing the mapped corridors, they appear as wide
avenues under which stricter environmental planning conditions apply. What this
fails to take into account is the different classes of corridor and the
difference between existing and potential habitat. While linear corridors with
continuous vegetation are the more recognisable form, stepping stones of
isolated patches of vegetation can still act as effective wildlife corridors.
For them to provide effective connectivity, however, the maximum distance
between them is generally accepted to be 100m (OEH factsheet).
Mapping methodology
Byron Biodiversity Conservation
Strategy 2004
Development of planning controls for wildlife corridors
Primary (existing native vegetation) and secondary wildlife
corridors (exotic vegetation and non-vegetated areas), were mapped from the
NPWS data and refined by BSC ecologists
Primary corridors were given an ecological value of 27,
deeming them HCV.
In developing planning controls
for secondary wildlife corridors Council had regard to the following.
· The
need to review Councils DCP (or similar planning control) for exempt and
complying development to ensure the appropriateness of any forms of development
in ‘secondary wildlife corridors’;
· All
identified wildlife corridors are to be afforded environmental protection
zoning and where possible enhanced;
· Clearing,
draining, filling or destruction of High Conservation Value vegetation or
habitats, vegetated wildlife corridors and threatened species habitat will not
be permitted unless there are no other alternatives;
· Development
of effective planning controls shall promote and allow for environmental repair
and enhancement and active management;
· Development
of effective planning controls shall maintain, protect and enhance corridor
values in order to facilitate the movement and dispersal of species across the
landscape;
· Development
of effective planning controls that control development that will impact on
potential corridor values;
· To
ensure that any development that occurs in a ‘secondary wildlife
corridor’ will be required to undertake environmental repair and
enhancement actions as part of that development (similar to that in the Byron
Rural Settlement Strategy with 900 trees per dwelling).
Development of mapped wildlife corridors
The NSW NPWS (now Department of Environment and Conservation
- DEC) prepared mapping of regional and subregional wildlife corridors for
north-east NSW (including Byron Shire), based on key fauna habitat modelling
and vegetation mapping (See Attachment 1 – Figure 2). This mapping was
refined by Council to better reflect on ground attributes (such as vegetation
cover and existing environmental protection zones). Regional corridors (greater
than 500m in width allowing migratory pathways across altitudes and latitudes,
thereby connecting regions such as coastal, hinterland and tableland
ecosystems) and subregional corridors (with vegetated landscape features such
as ridges and valleys requiring connection, preferably with corridors greater
than 300m wide) were then amalgamated to a single layer, with mapped rivers
(with a 20-metre buffer) added to include the main riparian corridors. (See
Attachment 1 – Figure 3)
Key notes from the 2003 NPWS
study upon which Council’s methodology is based:
· Corridors
are specific to a biological group for which likely preferred habitat can be
mapped (faunal assemblages).
· For
any particular assemblage, animals usually follow the path of least resistance
when moving through landscapes, and corridors are based on the best available
combination of a habitat hierarchy linking two patches of habitat.
· Corridors
are not necessarily continuous—they may be broken by currently degraded
or cleared areas but must contribute to overall landscape connectivity, or have
the potential to do so given restoration. Accordingly, stepping-stone patches
provide connectivity and can function as corridors for mobile species,
particularly those willing to cross expanses of cleared land (e.g. Date et al.
1991, 1996; Brooker et al. 1999; Eby et al. 1999).
· All
else being equal, wide corridors are better than narrow corridors but spatial
dimensions should reflect the demographic requirements of species that are rare
and that have specialized habitat and foraging requirements. The requirements
of wide-ranging species (e.g. nomads and migrants) are also important (Dobson
et al. 1999).
· Corridors
spanning natural spatial gradients (e.g. altitudinal and latitudinal gradients)
are critically important in the context of ecological processes and climate
change. Species acting as vectors for ecological processes (e.g. propagule
dispersers, predators) require special consideration;
· Sub
– regional corridors are landscape corridors that serve more as routes
for dispersal and movement for assemblage reference species and wide-ranging
species, rather than habitats in their own right.
Neighbouring Councils’ mapping methodology
Lismore
In producing their Biodiversity Conservation Strategy (BCS),
Lismore Council engaged Landmark Ecological Services to produce a study based
on the mapping of key habitats and corridors (http://www.lismore.nsw.gov.au/page.asp?f=RES-CVI-50-43-25
). Vertebrate fauna and their habitat were used as surrogates to determine
overall biodiversity values and to identify and rank key habitats and
corridors. Key habitats were identified using vegetation mapping developed in
2011, mapping of watercourses and soils, vertebrate records from the Atlas of
NSW Wildlife (OEH, Sydney) and previous corridor mapping undertaken for the
LGA. Key habitats were identified and ranked on the basis of their known or
potential value as habitat for threatened species and for other
conservation-priority species with core habitat in the Lismore LGA.
The study compared its mapping methodology to the former
Catchment Management Authority (CMA) mapping, and resolved habitat types to a
finer scale. It also contained prioritisation for rehabilitation and
preservation of habitat and corridors, and their ranking in terms of their
significance in achieving these outcomes.
This is by far the most comprehensive effort amongst the
surrounding councils to map corridors. The information was provided under a
subheading of Urban Green Corridors Plan within the BCS.
Tweed
The Tweed Council’s two staff concerned with
environment are on leave till 18 January. A search of their website and phone
contact revealed very little information on wildlife corridors. The only
mention was within their recently released CKPoM. No mapping or methodology was
detailed or known, with references only to the need to provide corridors for
koalas without any management actions provided. Mapping identified habitat with
no corridors identified.
Work on a biodiversity management plan is ongoing, with the
potential for inclusion of vegetation mapping which factors in connecting
corridors.
Ballina
Ballina Council has utilised the NPWS mapping to inform
their corridor identification in their DCP 2012. Due to staff leave
arrangements, there is no information available till after the 18 January as to
methodology which may have been more recently employed for vegetation mapping.
No further information is available on their website.
State planning
OEH is developing two mapping categories for future land
management; Priority Investment Areas (PIA) and High Environmental Value (HEV).
PIA are sites where funding for biodiversity management can
make the greatest difference for biodiversity and typically include large
remnants and biodiversity corridors (See Attachment 2). These priority areas
will assist funding bodies in identifying preferred locations to invest
biodiversity funds. The North Coast mapping is currently classified as
“near completion”.
The corridors identified as PIAs include only those of state
and regional significance. While corridors of local significance play an
important role for connectivity, they are not identified as PIAs and the
identification of local corridors remains the responsibility of local
government and Local Land Services, through Local Environmental Plans (LEPs)
and other mechanisms.
This differs from HEV which are areas that contain values of
particular significance that are considered for protection under statutory
instruments. The HEV criteria are used by OEH Regions to construct an
HEV map for submission to the Department of Planning & Environment (DPE)
for inclusion in Regional Growth Plans (RGPs) (See separate report on HEV for
methodology).
A landowner’s rights to carry out activities such as
agriculture and development are not altered by their property being identified
within a PIA; it is not a constraint but rather an opportunity to attract
funding for critical habitat restoration and preservation. PIA’s may
however comprise areas of HEV. Landuse planning should be informed by HEV
mapping, and the use of PIA mapping as the base layer for land use planning is
not recommended.
One of the key corridor projects in NSW is the Border Ranges
Alliance in the Great Eastern Ranges corridor. An independent report to the
Interstate Agency Working Group convened under the Environment Heritage and
Protection Council/Natural Resource Management Ministerial Council provides
comprehensive detailing of the rational of and need for wildlife corridors. See
http://www.environment.nsw.gov.au/resources/nature/ccandger.pdf
for the paper.
National level
The previous government produced a National Wildlife
Corridors Plan: a framework for landscape-scale conservation in 2012. (https://www.environment.gov.au/system/files/resources/e73bc1c8-81f0-4800-8f1a-3fb6cb7558ac/files/national-wildlife-corridors-plan.pdf
) In its own words “The Corridors Plan represents the
Australian Government’s commitment to retain, restore and facilitate
active management of corridors and natural patterns of vegetation, waterways
and other landscape features across public and private lands, through our
cities and towns, and between our national parks. Through the Corridors Plan,
cooperative, voluntary action on the part of all land managers to restore
ecological connections throughout the landscape is supported—be it farm
land, urban land, conservation areas or Indigenous land that is being
managed.”
The plan stressed the importance of wildlife corridors in
assisting species survive the impacts of climate change, and seeks to increase
community participation in wildlife corridors and connectivity conservation.
Examples of current local on ground work
Land for Wildlife – restoring rainforest in a
biodiversity hotspot
In collaboration between Council, NSW Environmental Trust (ET)
and local Land for Wildlife members, weed control, tree planting and native
fauna nesting box deployment is occurring across 11Ha on 11 properties.
Currently entering its second year, this ongoing project is funded by Council
and ET grant ($99,000). The majority of the properties lie within areas
currently mapped by Council as wildlife corridor. (See Attachment 1 –
Figure 4)
The project is categorised by ET under Vegetation
corridors/Vegetation management and feedback from ET prior to the delivery of
the second year of funding included “The achievements so far in the
on-ground component of the project are excellent. The Grantee is targeting high
priority areas identified in the Border Ranges Biodiversity Management Plan and
then using work plans to guide on-ground work.”
Koala Connections
Guided by the Tweed and Byron Coast Koala Habitat Studies by
Dr Steve Philips, the project will improve north-south and inland to coastal
indicative koala linkages, and improve ecosystem resilience and adaptation to
climate change. The project works will enhance the wildlife corridors of Byron
Shire, improving the linkages between the hinterland koala populations of the
Huonbrook - Wilsons Creek area, and the coastal populations near Tyagarah.
Where habitat connections are through many small holdings, several neighbours
are working together under the Koala Connections program, to develop a strategy
for on ground works. Action plans will provide the guidance for each site to
rebuild the habitat. Attachment 1 – Figure 5 shows the overlap between
current primary koala habitat and class A secondary habitat with the wildlife
corridors.
Background Overview – sourced from OEH
Habitat loss and fragmentation are the two main contributors
to continuing biodiversity decline across the landscape. Wildlife corridors may
be a key tool in slowing or possibly reversing this trend.
While stepping stone fragmented habitats may be of some use
to birds and mammals able to fly, linear corridors provide a more comprehensive
protection for enabling the movement of plant, fungi and animal species. The
maximum separation distance for patches to provide connectivity and act as a
corridor is generally accepted to be 100 metres.
Corridors are critical for the maintenance of ecological
processes including facilitating the movement of animals and the continuation
of viable populations. This is particularly important for ensuring genetic
diversity within species. Communities with isolated gene pools can become
susceptible to inbreeding, while potentially losing resilience to survive
impacts from habitat loss and disease outbreak. Corridors also allow for
greater recolonisation post impact.
In helping species adjust to climate change impacts by
allowing altitudinal and latitudinal movements, promoting the increase in
corridors also potentially makes a contribution to increasing carbon store
capacity of a region while improving water quality and flow patterns in
catchments. This can reduce impacts of erosion over the longer term.
Many animals are also vital for the fertilisation of plant
species, particularly rainforest trees. The inability of native fauna to reach
isolated remnant ecosystems may lead to local extinctions. Fragmented habitats
also become more susceptible to issues such as arise from edge effects, where
weed species are able to infiltrate the remnant. Wider corridors are more
resilient and can act as habitat in their own right.
Regionally, it is important to maintain corridors greater
than 500m in width. This can allow migratory pathways across altitudes and
latitudes, thereby connecting regions such as coastal, hinterland and tableland
ecosystems.
On a sub-regional scale, vegetated landscape features such
as ridges and valleys require connecting, preferably with corridors greater
than 300m wide.
Locally, corridors provide important connections amongst
remnant patches of vegetation and landscape features such as creek lines,
gullies, wetlands and ridges.
Conclusion
The current Council wildlife corridor mapping was developed
as part of the Byron Biodiversity Conservation Strategy (BCS) 2004 and is based
on wildlife corridor mapping produced by National Parks and Wildlife Service
(NPWS) refined by BSC ecologists.
The corridors are vital connectivity measures facilitating
species movement across fragmented habitat. They act to limit species loss by
providing resilience for genetic diversity, assist population recovery post
fire/flood and reduce negative impacts of climate change by allowing movement
to more suitable habitat.
Future mapping may be more readily accepted by the
landholders if corridors were categorised as existing or potential. It would be
good to prioritise supporting riparian and ridgeline revegetation over paddock
scale projects, as these are both frequented habitat for wildlife and more
likely to gain the cooperation of landowners. Funding such as for the Land for
Wildlife project may then be more readily acquired through PIA mapping.
The most detailed and comprehensive corridor mapping for a
neighbouring council at present is that produced by Landmark for Lismore LGA.
Future mapping should coordinate Byron corridors with Lismore, Tweed and
Ballina corridors.
State government moves from HCV to HEV classification are
reflected in new mapping methodology. PIA mapping (near completion) will
assist in prioritising areas for biodiversity protection, but should not be
used for future wildlife corridor mapping.
Financial Implications
Nil
Statutory and Policy
Compliance Implications
The review of the Biodiversity and Conservation Strategy
will consider a methodology for wildlife corridors.
Staff Reports - Sustainable Environment and Economy 5.3 - Attachment 2
Attachment
1
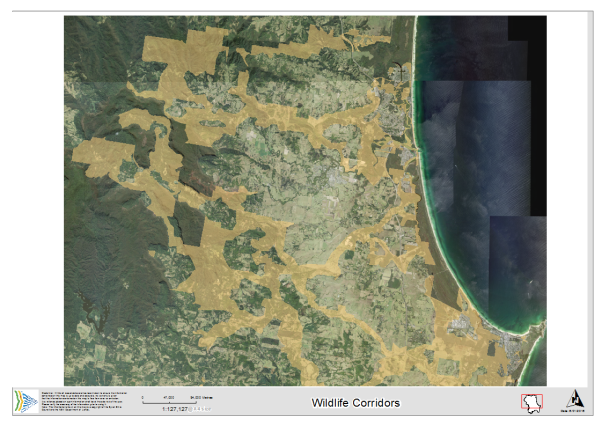
Figure 1 A)The current wildlife corridor
mapping built from NPWS input and Council’s 2007 vegetation layer.
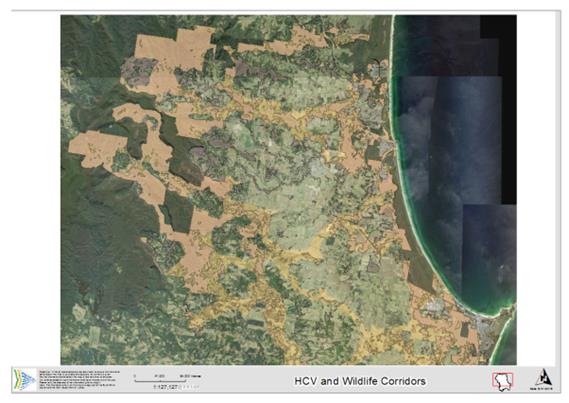
Figure 1 B) Corridors combined with HCV layer
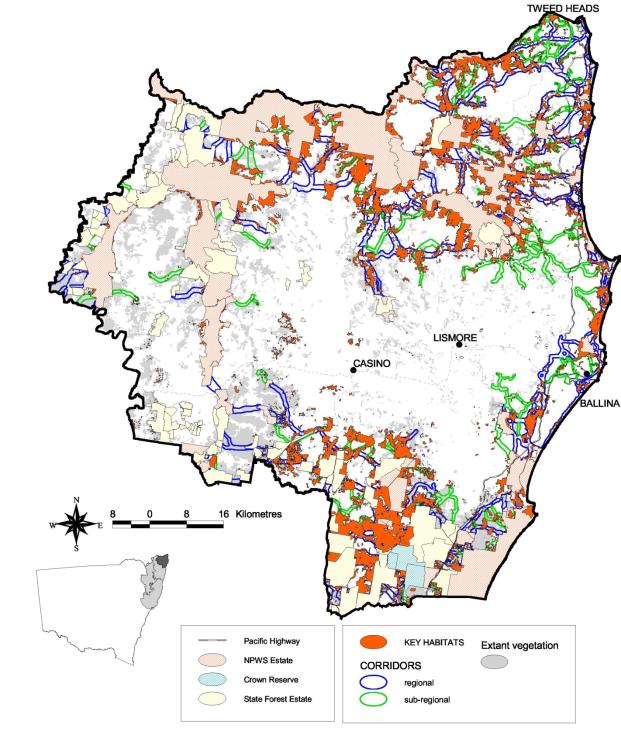
Figure 2: Key habitats and
wildlife corridors of north east NSW – NPWS
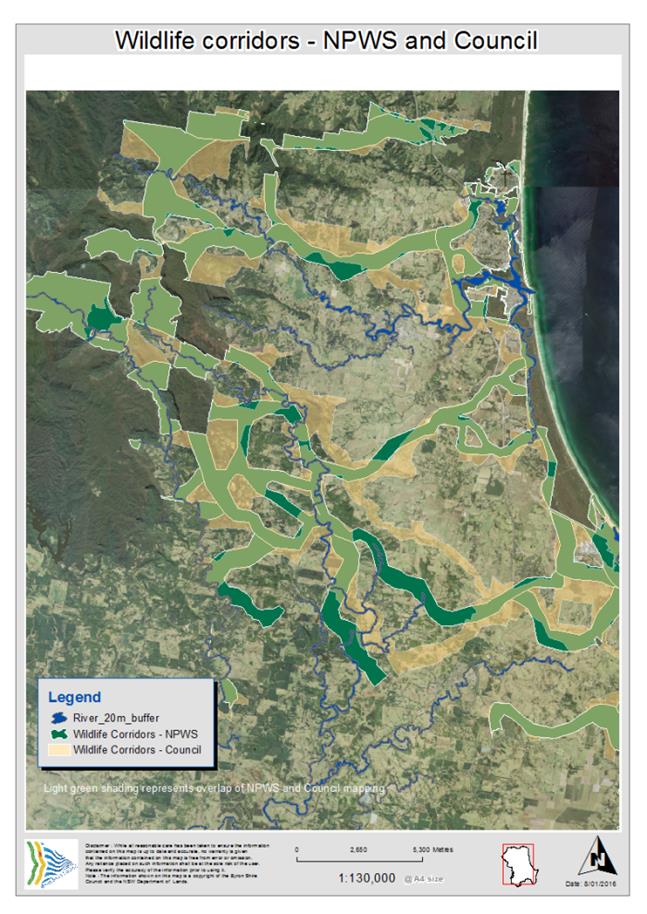
Figure
3:
The original NPWS corridors with Council’s adjusted corridor mapping
overlaid.
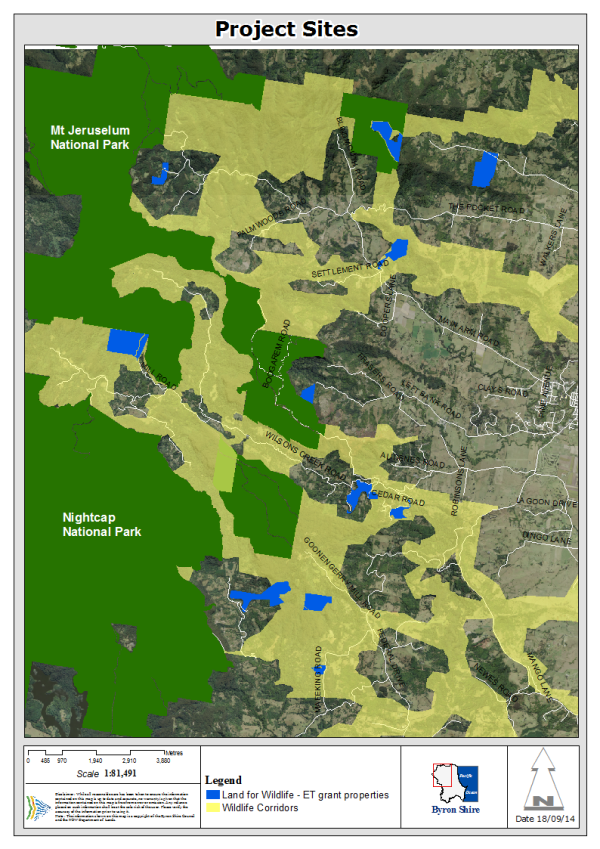
Figure
4 The
Locations of properties involved in the Council - ET Trust – Land for
Wildlife project.
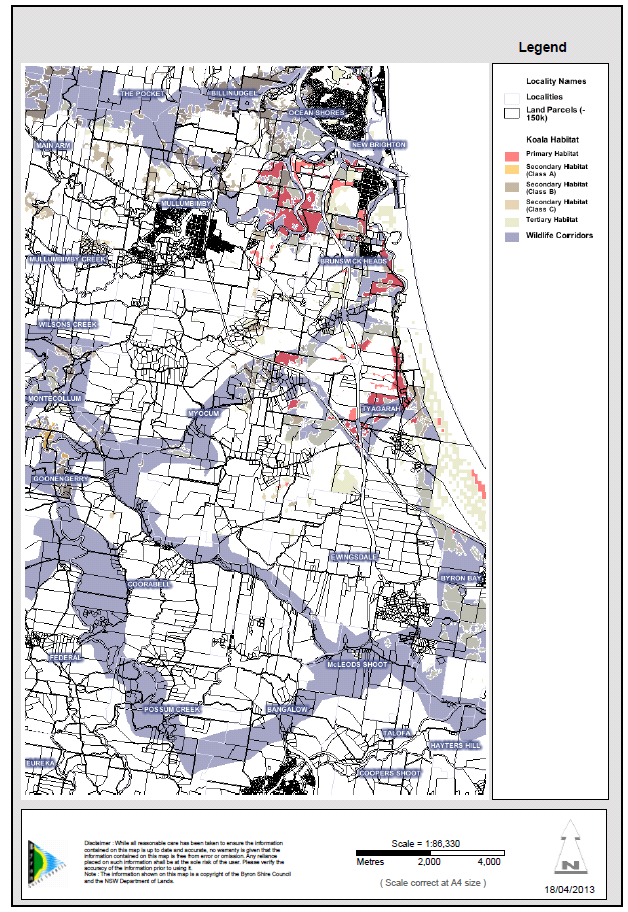
Figure 5 Koala habitat
identified within the Koala Connections project in relation to current wildlife
corridors.
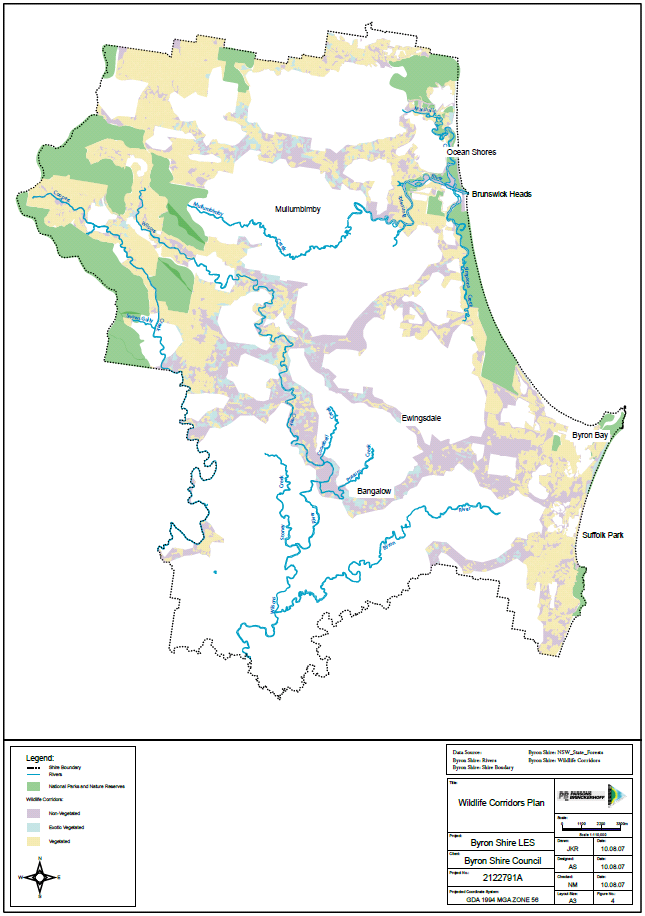
Figure 6 The wildlife corridor plan prior to
the collapsing of the layers as shown in Figure 1A

Priority Investment Area Use
and Mapping Guide
06/05/2015
Staff Reports - Sustainable Environment and Economy 5.3 - Attachment 2
Contents
Contents. 1
Executive summary. 2
1 Introduction. 3
2 Policy
context 4
3 Use of
PIAs. 7
3.1 Principal uses. 7
3.1.1 A decision
support tool for grant providers. 7
3.1.2 Guiding
expenditure through offset funds. 7
3.2 Relationship to other
programs. 8
3.2.1 Supporting Local
Land Service programs. 8
3.2.2 Supporting local
government programs. 8
3.2.3 Supporting
community organisations and projects. 9
3.2.4 Reserve
establishment 9
3.2.5 Saving our
Species Program.. 10
3.3 Relationship to strategic
planning and development assessment 10
3.3.1 Strategic
planning. 10
3.3.2 Development
approval processes. 11
4 PIA
mapping standards and guidance. 12
4.1 Features included in
Priority Investment Areas. 12
4.1.1 Core areas. 12
4.1.2 Biodiversity
corridors. 12
4.2 Mapping standards. 14
4.3 Mapping guide. 15
Staff Reports - Sustainable Environment and Economy 5.3 - Attachment 2
Executive summary
Priority Investment Areas (PIAs) identify areas where
funding for biodiversity management can make the greatest difference for
biodiversity. PIAs comprise of core areas of vegetation and biodiversity
corridors that are important at a state and regional level. These
priority areas will assist funding bodies in identifying preferred locations to
invest biodiversity funds. They may also provide useful information for land
owners and land managers on the areas that have an increased potential of
receiving biodiversity management funds.
PIAs are not developed for the
purpose of informing land use planning or development applications and are not
intended to be used for land use planning purposes. A landowner’s right
to carry out activities such as agriculture and development is not altered by
their property being identified within a PIA.
A consistent and repeatable
approach to the identification and mapping of PIAs across NSW is required to
ensure equity in the mapping produced. Landowners within the Priority
Investment Areas may be preferentially targeted to receive financial benefits
if they protect bushland compared to landowners outside these areas. It
is important, therefore, that the identification of these priority areas is
transparent and follows a consistent approach.
This document provides overarching mapping standards
to guide the preparation of PIA mapping. Mapping guidance is provided for core
areas, state biodiversity corridors and regional biodiversity corridors. The
document sets minimum standards for the quality of both input and output data,
whilst allowing for differences in regional data availability and land use
pressures. To summarise, the guide
requires the mapping of PIAs to:
· Draw on existing data sources where information is
available and suitable;
· Be mapped at a property scale;
· Be prepared with local knowledge, validation and
consultation.
PIA mapping has not yet been
completed for all regions in NSW. In regions where mapping is not
available, OEH will continue to base biodiversity investment decisions on
available environmental information as is current practice.
1 Introduction
Priority Investment Areas
(PIAs) identify areas where funding for biodiversity management can make the
greatest difference for biodiversity. The PIAs include:
· core areas,
large remnants where management will contribute the greatest benefit to the conservation
of key state and regional biodiversity values within a region; and
· state and regional biodiversity corridors, linear areas which link core areas and play a
crucial role in maintaining connections between animal and plant populations
that would otherwise be isolated and at greater risk of local extinction.
Government regularly makes
funding available to support biodiversity management actions through various
grant programs and it is committed to ensuring that these funds are spent in an
effective and accountable way. Identifying priority areas for biodiversity
investment is one way of ensuring that funds are targeted to areas of greatest
strategic benefit, based on an assessment of broad scale biodiversity and
stakeholder values.
PIAs will be used in two ways.
Firstly, to inform funding bodies of preferred locations to invest biodiversity
funds. Secondly, it may provide useful information for land owners and land
managers on the areas that have an increased potential of receiving biodiversity
management funds. As such, being mapped in a PIA may increase the
opportunities for landowners to receive funding to protect their bushland, but
participation in any funding program is entirely voluntary.
PIAs are not developed for the
purpose of informing land use planning or development applications and are not
intended to be used for land use planning purposes. PIAs do not identify all
significant vegetation, and therefore it cannot be assumed that areas not
identified as a PIA are of lower environmental value.
A landowner’s right to
carry out activities such as agriculture and development is not altered by
their property being identified within a PIA. Areas within PIAs may have
environmental values (including areas that also conform to the HEV criteria)
that may need to be considered as part of existing statutory planning and
development approval processes, and would require an appropriately scaled level
of environmental assessment as specified by the relevant planning or consent
authority. The identification of land as a PIA does not alter these
existing requirements in any way.
PIA mapping is currently not
available in all regions in NSW. In regions where mapping is not
available OEH will continue to base biodiversity investment decisions on available
environmental information as is current practice.
2 Policy context
Land of biodiversity value in
NSW may be categorised into a series of sub-groups for land use and
conservation planning purposes (Figure 1). Within NSW, all areas of native
vegetation and habitat require an assessment of biodiversity impacts under
the development application process[2].
A subset of these areas,
termed areas of High Environmental Value, contains values of particular
significance that are considered for protection in statutory processes.
It includes, for instance, land containing threatened ecological communities,
habitat for threatened species, important wetlands and protected areas.
The term High Environmental Value is equivalent to the terms
‘State and regional biodiversity value’, ‘High Conservation
Value’ or ‘Environmentally Sensitive Areas’.
The Office of Environment and
Heritage (OEH) recommends that areas of ‘High Environmental Value’
be identified and considered for protection through all land use planning
processes, including growth strategies and regional and local plans.
Further guidance in relation to land use planning is provided in Section 3.3.
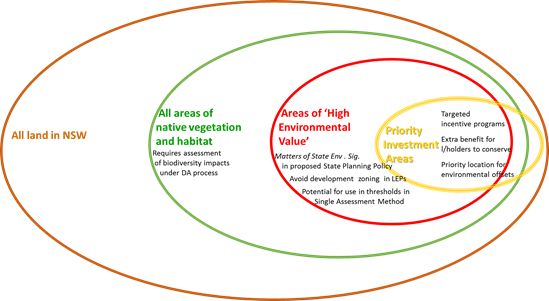
Figure 1: Relationship
of Priority Investment Areas to areas of High Environmental Value and other
native vegetation1
Priority investment areas are geographically the smallest subset of
environmental priorities. PIAs generally consist of areas of High
Environmental Value, however on some occasions may also include areas of native
vegetation and habitat or, where cleared land is identified in a PIA, may also
include other land in NSW. PIAs are recommended by OEH as the
priorities for biodiversity funds.
Priority investment areas
are not a ‘retention target’. They do not represent the only biodiversity values
that should be protected through planning and development
processes. As described above, planning and development approvals
need to consider retaining and protecting a broader range of biodiversity
values wherever feasible, especially those areas of High Environmental Value.
Figure 2 provides an example from Western Sydney of how PIAs,
areas of High Environmental Value and areas of native vegetation
interact. The figures show that a significant amount of High
Environmental Value vegetation and habitat can occur outside the mapped
PIAs. This is possible as the PIAs identify only the best available areas
for biodiversity investment, not all environmentally sensitive areas.
Figure 2 demonstrates the importance of identifying both PIAs
and areas of High Environmental Value. This information can then be used, as
required, to provide input into a range of biodiversity investment, land use
and conservation planning processes.
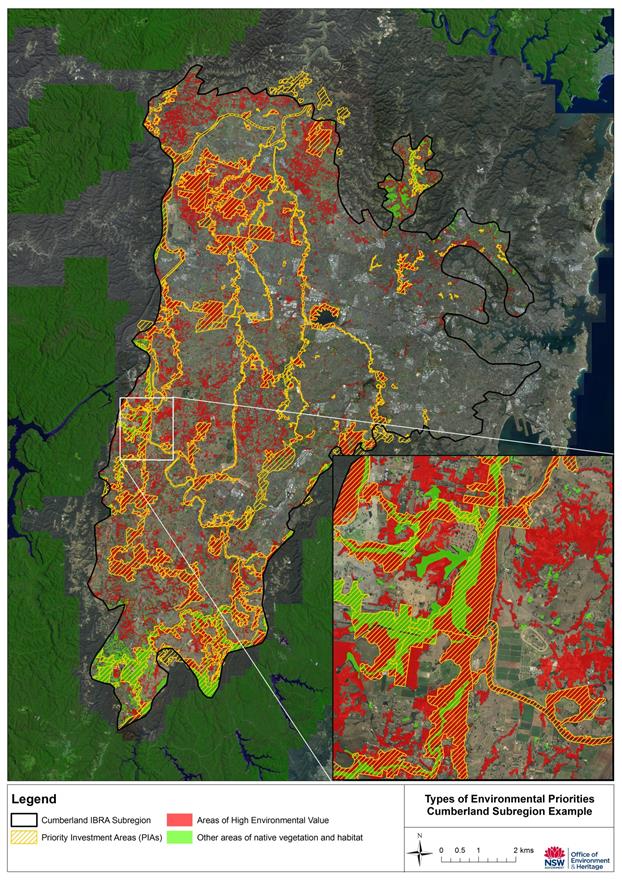
Figure 2: Example
of Priority Investment Areas and High Environmental Value mapping in western
Sydney
Note: Areas of HEV may be excluded from PIA mapping for a
number of reasons, including vegetation condition, vegetation type and existing
or planned land use.
3 Use of PIAs
PIA mapping provides a
single, accessible map that identifies the best areas for strategic investment
in biodiversity management.
3.1 Principal uses
Federal,
state and local governments regularly make funding available to support
biodiversity management actions through various grant programs and are
commitment to ensuring that these funds are spent in an effective and
accountable way. Identifying priority areas for biodiversity investment is one
way of ensuring that funds are targeted to areas of greatest strategic benefit,
based on an assessment of broad scale biodiversity and stakeholder
values. The availability of PIA mapping can assist a large number of
stakeholders by providing information related to the location of biodiversity
priorities.
3.1.1 A
decision support tool for grant providers
By
investing in the PIAs, fund managers can be confident that they are
contributing to strategic conservation outcomes that have a level of broad
based stakeholder support.
PIA
mapping can be utilised in different ways depending on the objectives of the
grant funding program. For example, a program may target only
biodiversity core areas or only corridors within the project area.
Programs targeted toward specific features or landscape units can use the PIA
mapping as an initial filter to target areas for investigation.
OEH
recommends that program funding be preferentially targeted to land that is
within or partially within the PIAs. Methods to achieve this include a
weighting (e.g. 10 – 25%) that is applied to grant applications that are
located within, or partially within, a PIA. This enables applications
outside of the priority areas to also be competitive if they provide other
benefits.
As would
be expected, a grant program would need to undertake site based assessments to
ensure that the land has the specific features that are targeted for funding.
3.1.2 Guiding
expenditure through offset funds
The rules
and governance framework associated with the major projects offset fund are
currently being prepared.
The
availability of a central offset fund provides OEH (and any nominated fund
manager) an opportunity to achieve strategic environmental outcomes by
targeting expenditure to priority locations. The use of an offset fund by
proponents may also lead to scrutiny of the fund manager, and the processes
followed to obtain and secure biodiversity offsets. An approach that
demonstrates that offsets are being obtained using a transparent approach from
high priority sites may therefore be beneficial.
It is
proposed that the mapped PIAs be part of the governance framework for the
offset fund to demonstrate that offsets are being obtained from strategic
locations which provide the greatest benefit to conservation. Under this
framework, the offset fund must locate offsets within PIAs as a first
preference before other land is considered. Further criteria can be used
to prioritise land within the PIAs. For example, like for like, IBRA subregion
or credit profile requirements can be identified within the PIAs to target
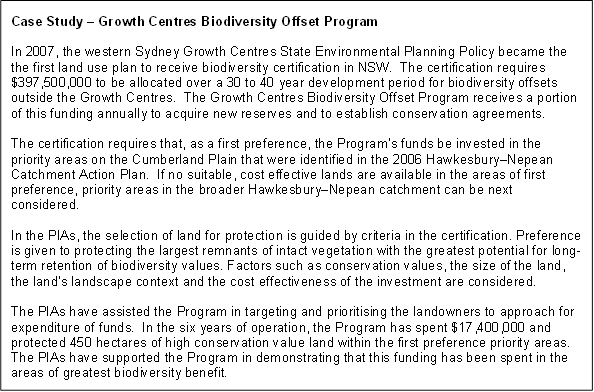
funding towards the values required to offset a particular impact. The Growth
Centres Biodiversity Offset Program is an example of this approach (case study
below).
3.2 Relationship to other
programs
3.2.1 Supporting
Local Land Service programs
Local Land Services (LLSs)
identify regional and local priorities in their Catchment Action Plans (CAPs)
to guide their expenditure of funds. In some circumstances the locations
identified in a CAP may differ from those identified in PIA mapping due to
differing mapping approaches and objectives.
Depending on the purpose of
the funding stream, the LLS is encouraged to consider PIAs in the expenditure
of funding. This may include prioritising, as a first preference, funding
to areas where the PIAs over-lap with the CAP priorities, before considering
investment in other areas.
It is acknowledged that the
LLS may have different purposes for funding than those identified by the PIAs,
or may be able to achieve positive biodiversity outcomes outside mapped PIAs.
3.2.2 Supporting
local government programs
Consultation with
councils has identified the benefit of a strategic, regional context of
biodiversity priorities to support local biodiversity management planning and
prioritisation. The PIAs provide a resource to support the establishment
of local priorities by councils.
Councils are able
to build on the identified PIAs within their LGA, enhancing the network of core
areas and corridors identified with lands of local biodiversity importance in
their council area, such as local corridors. PIAs may also be of
assistance to local government in the preparation of local documents (such as
biodiversity strategies) or in the prioritisation of effort in applying for
grant funding.
Council can
utilise the information to determine if any council owned sites are identified
as PIAs, thus increasing the potential to receive funding to manage or conserve
these areas. Council may also wish to prioritise PIAs in the expenditure
of their own funds, where local and regional priorities align.
3.2.3 Supporting
community organisations and projects
PIA mapping
provides community groups with information related to biodiversity investment
priorities that can assist in the selection of appropriate sites to expend
effort. As PIAs have an increased chance to receive funding, and
contribute to a wider network, community groups can choose to focus on these
areas when considering applications for grant or other funding. This may be
particularly relevant to new groups, or existing groups looking for new sites
or opportunities.
PIA mapping does
not identify all areas of state or regional priorities, nor does it identify
areas of local value. Groups working outside of identified PIAs continue
to provide a positive benefit for biodiversity within the study area.
3.2.4 Reserve
establishment
Addition of land to the
National Parks estate occurs in accordance with the principles of the National
Parks and Wildlife Act 1974 and corresponding Government policy namely, the
National Parks Establishment Plan (currently under review and publicly
exhibited as the ‘Directions Statement for National Park
Establishment’). Additions in the medium term are prioritised
towards better landscape connectivity, improving reserve design and management
and areas of cultural importance[1].
Other long-term conservation themes include poorly reserved ecosystems,
wetlands and riparian features, water catchments and areas of
geodiversity.
The PIA
map is one of many sources of information that support the reserve
establishment process. The PIA map provides this support by identifying
core areas of poorly reserved ecosystems and State and regionally significant
corridors. There are a range of other values that are important for
reservation and so not all new reserves or additions to existing reserves will
occur in PIAs.
The PIA
map is therefore not a ‘plan’ for building the reserve
system. Land identified on the map is not necessarily suitable for
reservation. The land may however be suitable for other management
opportunities, such as grant funding to land owners.
3.2.5 Saving
our Species Program
The PIAs do not identify all
state and regional priority areas. For instance, the Saving our Species program provides additional priorities for areas of
value for threatened species management.
It is expected that the purpose of the
funding will determine which priority areas are best suited for guiding
investment. Investment in threatened species management is best
prioritised through the Saving our Species Program. Government offset and
grant programs which aim to achieve the greatest benefit for vegetation
management are best prioritised through the PIA mapping.
3.3 Relationship to strategic
planning and development assessment
3.3.1 Strategic
planning
The primary information provided by OEH
for considering biodiversity values in land use planning processes is the
mapping and criteria for High Environmental Values (HEV). OEH recommends
that areas of HEV be identified and considered for protection through all land
use planning processes, including growth strategies and regional and local
plans.
Priority investment areas are
not suitable for use in land use planning processes in lieu of consideration of
the HEV map, or other appropriate landscape-scale assessment of biodiversity
values. This is because the PIAs do not identify all areas of high conservation
value and also because it includes areas in a range of conditions.
The PIA map will be publicly available and
it is recognised that planning authorities may have an interest in considering
the map in land use planning, particularly for the identification of
‘corridors’ which are not included within the definition of
HEV. The following advice will accompany the PIA mapping to ensure that
it is not used inappropriately:
· Land use planning should be informed by the HEV layer
provided by OEH. OEH does not warrant the use of the PIA map as being suitable
for land use planning purposes in isolation from the HEV map.
· If a Planning Authority intends to use the PIA
mapping, it is required to undertake a process of validation and amendment of
the data, including consulting with stakeholders on the accuracy of the mapping
and its intended use.
· Validation of PIAs is likely to include re-evaluating
the boundaries of core areas and corridors to take into account changes in the
extent of vegetation since the PIA Map was prepared. It may also include
adding or removing areas due to the outcomes of the planning process including
responses to public consultation, or alignment of areas with boundaries more
consistent with land use planning, such as cadastral boundaries.
· If a Planning Authority incorporates biodiversity
information into a land use plan through the above process, then responsibility
for the interpretation and use of the revised layer rests with the Planning
Authority. The revised data is different from OEH’s PIA map and being
used for a different purpose.
In some regions of the state, councils
have already incorporated corridor mapping into strategic plans, including
LEPs. Such regions include the Illawarra and the South Coast. In these
circumstances OEH recognises that the corridor mapping has been validated by
the council in consultation with stakeholders as part of the land use planning
process.
If corridors have already been adopted for
use by planning authorities, including those prepared consistent with the
guidance listed above, then OEH recognises this layer as being developed for
planning purposes and may support the council’s stated planning uses for
the map. OEH may also support the use of this map in regional plans and growth
strategies and to inform the use of appropriate provisions in local plans.
3.3.2 Development
approval processes
Priority
investment areas are not suitable for use in development assessment processes.
Assessments must be undertaken in accordance with the statutory requirements
applying to the particular proposal. Through the assessment process
consideration should be given to protecting all areas of High Environmental
Value, as well as areas of local biodiversity value.
A
landowner’s right to carry out activities such as agriculture and
development is not altered by their property being identified within a
PIA. Areas within PIAs may have existing environmental values (including areas that also conform to the HEV criteria) that
may need to be considered as part of existing statutory planning and
development approval processes, and would require an appropriately scaled level
of environmental assessment as specified by the relevant planning or consent
authority. The identification of land as a PIA does not alter these
existing requirements in any way.
OEH
recommends that the Biobanking Assessment Methodology and the Framework for
Biodiversity Assessment (or any future methodology) be used where appropriate
to guide development approval decisions. These methods provide guidance
on offset requirements and on areas that cannot be cleared and offset.
4 PIA mapping standards and guidance
4.1 Features included in Priority
Investment Areas
Priority
Investment Areas identify high priority biodiversity assets (‘core
areas’), state biodiversity corridors and regional biodiversity
corridors. Combined, these features are termed ‘Priority Investment
Areas’.
4.1.1 Core
areas
Core areas
of native vegetation and habitat where management will contribute the greatest
benefit to the conservation of state and regional biodiversity values within a
region.
Areas
considered for inclusion as core areas may include a variety of significant
biodiversity features, for instance, State and Commonwealth Threatened
Ecological Communities (TECs), under-reserved vegetation types, over-cleared
vegetation types, vegetation types present in over-cleared landscapes, significant
vegetation remnants, significant threatened flora and fauna habitat and large
and well connected and configured patches of native vegetation. Core
areas may also include other biodiversity values that may be important
regionally, such as endemic vegetation communities or habitat for endemic
species, important wetlands (Directory of Important Wetlands in Australia
(DIWA), State Environmental Planning Policy 14 (SEPP 14)), karst areas,
old-growth forest, rainforest, Commonwealth listed Matters of National
Environmental Significance (MNES), areas listed in statutory conservation or
protection mechanisms (such as State Planning Policies) and significant sites
identified by the community.
The core
areas will contain a subset of these biodiversity features at locations which
are likely to have:
· high long-term viability (due to their patch size,
condition, landscape position, connectedness and current/planned future land
use), and/or
· other unique or significant features.
Core areas
can be identified and mapped in a number of different ways. Where regional data
exists on conservation priorities, then this data may be included where it
generally meets the mapping guidance provided in this document. Outputs
of conservation planning and decision support tools, such as the Biodiversity
Forecaster Tool (BFT)[3],patch
size analysis or fragmentation analysis, may also be used to assist in the
identification of core areas. Irrespective of the approach taken to identify
core areas, validation is required using local data, experts and stakeholder
consultation before data is considered suitable for identification as a core
area.
4.1.2 Biodiversity
corridors
Biodiversity corridors generally connect two or more
areas of native vegetation or are part of an important habitat link, where
maintaining vegetation in good condition and improving its connectivity across
a larger area is the management aim (Drielsma et al. 2012[4]).
While corridors containing good condition vegetation will be preferentially
identified, it is important to note that the biodiversity corridors will also
identify areas of ‘structural connectivity’ (as defined by Doerr
2010[5]). These corridors will
include areas where native vegetation is interspersed with areas of non-native
vegetation, disconnected linear elements or other isolated stepping stone type
features.
The corridors identified as PIAs include only those of
state and regional significance. While corridors of local significance
play an important role for connectivity, they are not identified as PIAs and
the identification of local corridors remains the responsibility of local
government and Local Land Services, through Local Environmental Plans (LEPs)
and other mechanisms.
State biodiversity corridors
State biodiversity corridors are key linkages of native vegetation identified
through state-wide analysis and provide connectivity between IBRA regions and
subregions.
State biodiversity corridors have been identified by a
state-wide assessment of connectivity previously completed by OEH through the NSW
Native Vegetation Management (NVM) Benefits project (Drielsma et al
2012). As a first principle, the identification of state biodiversity
corridors will focus on validating the output of the NVM Benefits state
significant ‘consolidate’ (corridor) mapping to allow its use at
the property scale.
Given the state corridors were identified with state
level data and information, the intent of the guide is to identify and map
these state scale corridors by refining the state scale information with local
and regional scale data, such as fine scale vegetation maps, aerial photography
and any other suitable data, including local or regional corridor
information. The refined, more fine scale information is then validated
through consultation with local experts and stakeholders.
Provided that the above definition for state
biodiversity corridors is met, other projects conducted by OEH or other state
agencies, local government or non-government bodies may contribute to the
identification of state biodiversity corridors. Again, the outputs of these
projects would need to be assessed and validated, to allow its use at property
scale.
Regional biodiversity corridors
Regional biodiversity corridors are key linkages of native vegetation within an IBRA
sub-region, between IBRA sub-regions or between significant biodiversity
features.
Regional biodiversity corridors provide intra-regional
connectivity, rather than the cross-regional connectivity provided by state
biodiversity corridors. As a guide, regional biodiversity corridors will
generally provide links between significant biodiversity features, including:
· State biodiversity corridors;
· Mapped core areas;
· Large native vegetation remnants; or,
· Other significant areas, such as the coastline, NPWS
reserves or important Council or Crown reserves.
Regional biodiversity corridors may include areas of
high social value[6]
to local communities, however do not include local corridors, which are defined
as linkages that either extend from a significant biodiversity feature into the
surrounding landscape, or that link local landscape features such as reserves,
creek lines, gullies, wetlands and ridgelines (adapted from DEC 2004[7]). Similarly
regional biodiversity corridors do not include the state biodiversity corridors
already defined.
4.2 Mapping standards
A number of overarching mapping standards are
specified below to guide the quality of data produced for the PIA map. The
mapping standards define both the quality of input and output data required for
the identification and mapping of PIAs. As such, the mapping of PIAs
should:
· Draw on existing data sources where information is
available and suitable;
· Be mapped at a property scale;
· Be prepared with local knowledge, validation and
consultation.
The following mapping standards apply:
1. Priority
Investment Areas can be mapped over all land tenures, however investment will
be limited to only those tenures able to receive it.
· Existing offsets are generally not available to
receive offset or grant funding, however are often part of state and regional
corridors or are part of larger core areas. Whilst these areas will be mapped
as PIAs, they will not be available to receive funding and will be identified
by a separate spatial data layer in the Biodiversity Investment Spatial Viewer
(BISV).
· NPWS Reserves have limited eligibility to receive
offset funding. Existing reserves cannot be counted as offset sites because
they are already protected. In some cases offsets are transferred from
private ownership to national park along with any management funding allocated
to that land. Environmental grants may be provided to NPWS reserves for
other purposes, for example to restore degraded wetlands. NPWS reserves
can be included as PIAs and may be viewed as a separate layer in the BISV.
2. Priority
Investment Areas are to be delineated using the best available regional
information that is fit for purpose.
· Best available information that is fit for purpose
includes the most comprehensive regional scale vegetation mapping, vegetation
classification and land use information at the time of map production.
3. Priority
Investment Areas are mapped in vector format, validated using recent aerial
photography (less than 10 years old) and mapped at a ‘property’
scale (~1:10,000 - 1:20,000).
· Property scale mapping will assist end users determine
if their study area is located within a Priority Investment Area.
4. The
boundaries of Priority Investment Areas should generally be aligned with either
extant vegetation or cadastral boundaries.
5. Priority
Investment Areas are to include predominantly vegetated lands.
· PIAs may include cleared land incidentally or as areas
of potential connectivity value.
6. Priority
Investment Areas may be considered as both a core area and biodiversity
corridor. In these circumstances, land is to be identified as both a core area
and biodiversity corridor.
7. Priority
Investment Areas that adjoin the boundaries of the study area should be mapped
with consideration given to any adjacent Priority Investment Area mapping
available. Adjacent Priority Investment Areas must be edge matched to
ensure consistency between study areas.
8. Priority
Investment Areas will only include mapping products that have been either
publicly released or, if not publicly released, have been prepared in
consultation with stakeholders.
· If the mapping is not publicly released, stakeholders
to be consulted may include (for instance) local council staff, Department of
Planning and Environment, Office of Strategic Lands, Department of Premier and
Cabinet, Local Aboriginal Land Councils, Local Land Services, non-government
organisations such as community and environment groups and known local experts.
4.3 Mapping guide
The principles contained in Table 1 provide guidance
on the type of mapping suitable for identifying and mapping Priority Investment
Areas. Mapping guidance has been defined for core areas, state
biodiversity corridors and regional biodiversity corridors.
The guide ensures some level of consistency between
regions. The consistent application of this guide is an important issue
for equity between landowners. Landowners within the Priority Investment
Areas may be preferentially targeted to receive financial benefits if they
protect bushland compared to landowners outside these areas. It is
important, therefore, that the identification of these priority areas is
transparent and follows a consistent approach.
Table 1: Mapping guide for identifying state and
regional Priority Investment Areas
|
Criteria type
|
Core areas
|
|
|
Criteria: Core
areas of native vegetation and habitat where management will contribute
the greatest benefit to the conservation of state and regional biodiversity
values within a region
|
|
Core areas
|
Mapping guide:
1. Based
on existing mapping OR through regional analysis assisted by conservation
planning/decision support tools, such as the Biodiversity Forecasting Tool
(BFT), patch size or fragmentation analysis, or alternative approach
dependant on the data available within the study area.
2. Core
areas are to be mapped by initially defining ‘key’ state and
regional biodiversity values for the study area or region. Key
biodiversity values may include significant vegetation types (such as
state and Commonwealth threatened ecological communities (TECs),
under-reserved vegetation types, over-cleared vegetation types, vegetation
types present in over-cleared landscapes and endemic vegetation communities),
significant vegetation remnants, significant threatened flora populations
and fauna habitat, and other state and regional biodiversity values
such as ‘matters of national environmental significance’ (MNES),
important wetlands, habitat for endemic species, karst areas, old-growth
forest, rainforest and areas listed by statutory conservation or protection
mechanisms.
· The
selection of ‘key’ biodiversity values is to include
consideration of potential future offset requirements in the region.
3. The following guidelines are to be
considered when mapping core areas:
a. For
significant vegetation types, a target in the order of 20 - 50% (to be
determined regionally) of the existing area of each vegetation type should be
used to guide decisions related to the amount of vegetation to be included as
a core area.
· The
above target is for the sole purpose of prioritising investment and is not a
vegetation retention target. The target does not represent the only
biodiversity values that warrant protection within a region.
· The
target range listed above is a guide and may require regional variation.
Targets applied will be developed in consultation with stakeholders and with
OEH over-sight to ensure consistency across subregions.
· Areas
in conservation reserves are counted towards the minimum target for each
significant vegetation type.
b. For significant vegetation remnants[8],
core areas may comprise large vegetated areas that are significant in the
landscape, including non-threatened vegetation communities or important
habitat for non-threatened fauna which rely on large, intact patches.
c. For significant threatened flora populations and
fauna habitat, core areas can comprise significant populations of
threatened species within the subregion.
d. For
other state and regional biodiversity values (such as MNES, important
wetlands, habitat for endemic species, karst areas, old-growth forest,
rainforest and areas listed by statutory conservation or protection
mechanism), no minimum areas apply.
4. In addressing 3, consideration is to
be given to;
a. areas
where biodiversity values are likely to be viable in the long-term.
Preference is to be given to vegetation in large, well configured patches,
with good condition and connectivity. Consideration should also be given to
selecting areas that are representative of the diversity across the region.
b. Areas
of high social value as identified by local councils, residents and community
groups that can demonstrate ongoing involvement in the biodiversity
management of a site. Where an area is considered for inclusion due to
social values the area must contain key state or regional biodiversity values
and must meet minimum standards for condition, connectivity patch size and
viability etc.
5. Core
areas are to exclude, where feasible, areas that are likely to be impacted by
development
· Areas
likely to be impacted by development include land zoned for urban land uses
or areas where land use intensification or fragmentation is likely. As
a general rule land zoned residential (R1-R4), industrial (IN1-IN4) or
business (B1-B7) are to be excluded from PIAs.
|
|
Criteria type
|
State biodiversity corridors
|
|
|
Criteria: State
biodiversity corridors are key linkages of native vegetation identified
through state-wide analysis and provide connectivity between IBRA regions and
subregions
|
|
State biodiversity
corridors
|
Mapping guide:
1. State
biodiversity corridors are identified in the NVM Benefits map (Drielsma et
al, 2012) as the top 10% of benefits from the ‘consolidate’
layer, or which otherwise meet the above definition AND ARE
2. Validated
using regional data and information in order to refine the boundaries mapped
at a state scale.
· It
is recognised that the validation process may result in a new corridor route
being selected that achieves the same linkage benefit as the corridor mapped
at the state scale. This new route will take into account fine scale
data that identifies native vegetation cover.
3. State
biodiversity corridors are to exclude, where feasible, areas that are likely
to be impacted by development
· Areas likely to be impacted by development include
land zoned for urban land uses or areas where land use intensification or
fragmentation is likely. As a general rule land zoned residential
(R1-R4), industrial (IN1-IN4) or business (B1-B7) are to be excluded from
PIAs.
4. Corridors
generally have a minimum width of 100m, however it is recognised that in some
over-cleared landscapes this may not always be achievable. Similarly,
in some landscapes with more extensive areas of contiguous vegetation a far
greater width (i.e. several kilometres) may be appropriate.
5. Corridors
generally comprise of continuous native vegetation cover, however it is
recognised that most corridors will contain some discontinuities for roads or
other purposes. As a general guide, discontinuities are to be less than
100m in width, noting that greater discontinuities may be required for some
fragmented landscapes or key linkages.
6. In
areas of contiguous vegetation, corridors may include entire vegetated areas,
or parts of these vegetated areas that have particular vegetation types or
landscape features (e.g. escarpment, rainforest or riparian corridors).
|
|
Criteria type
|
Regional biodiversity corridors
|
|
|
Criteria: Regional
biodiversity corridors are key linkages of native vegetation within an IBRA
sub-region, between IBRA sub-regions or between significant biodiversity
features
|
|
Regional biodiversity
corridors
|
Mapping guide:
1. Regional
biodiversity corridors provide linkages between significant biodiversity
features within an IBRA sub-region, including:
a. State
biodiversity corridors;
b. Mapped
core areas;
c. Large
native vegetation remnants[9];
or,
d. Other
significant areas, such as the coastline, NPWS Estate or important Council or
Crown reserves.
2. Regional
biodiversity corridors generally do not extend between several IBRA sub-regions,
but may cross between two sub-regions.
3. Regional
biodiversity corridors do not include state biodiversity corridors (as
defined above) or local corridors.
· Local
corridors are linkages of native vegetation that either extend from a
significant biodiversity feature into the surrounding landscape, or link
local landscape features such as reserves, creek lines, gullies, wetlands and
ridgelines (adapted from DEC 2004).
4. Regional
biodiversity corridors include consideration of areas of high social value as
identified by local councils, residents and community groups that can
demonstrate ongoing involvement in the biodiversity management of a site.
Where an area is considered for inclusion due to social values the area must
meet minimum standards for connectivity under item 1 above.
5. Regional
biodiversity corridors are to exclude, where feasible, areas that are likely
to be impacted by development:
· Areas likely to be impacted by development include
land zoned for urban land uses or areas where land use intensification or
fragmentation is likely. As a general rule land zoned residential
(R1-R4), industrial (IN1-IN4) or business (B1-B7) are to be excluded from
PIAs.
6. Corridors
generally have a minimum width of 100m, however it is recognised that in some
over-cleared landscapes this may not always be achievable. Similarly,
in some landscapes with more extensive areas of contiguous vegetation a far
greater width (i.e. several kilometres) may be appropriate.
7. Corridors
generally comprise of continuous native vegetation cover, however it is
recognised that most corridors will contain some discontinuities for roads or
other purposes. As a general guide, discontinuities are to be less than
100m in width, noting that greater discontinuities may be required for some
fragmented landscapes or key linkages.
8. In
areas of contiguous vegetation, corridors may include entire vegetated areas,
or parts of these vegetated areas that have particular vegetation types or
landscape features (e.g. escarpment, rainforest or riparian corridors).
|
Attachment 1-
Table 20, 23 and 31 in the
Biobanking Assessment Methodology (OEH 2014).
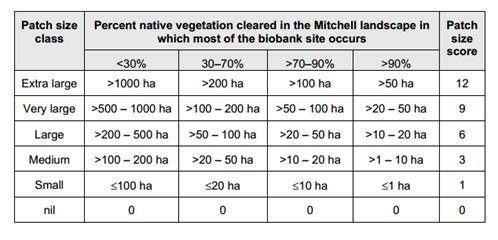
__________________________________
Refer
to the Directions
Statement for National Park Establishment - 2015–2020