BYRON SHIRE COUNCIL
13.4 - Attachment 1
BYRON SHIRE COUNCIL
13.4 - Attachment 1
BYRON SHIRE COUNCIL
13.4 - Attachment 1
INFORMATION ABOUT THIS DOCUMENT
|
Date Adopted by Council |
|
Resolution No. |
|
|
Policy Responsibility |
Corporate & Community Development |
||
|
Review Timeframe |
Progress reports as required |
||
|
Last Review Date: |
March 2016 |
Next Scheduled Review Date |
First half 2019/2020 FY |
Document History
|
Doc No. |
Date Amended |
Details Comments e.g. Resolution No. |
|
E2015/64437 |
February 2016 |
Preliminary draft for consultation |
|
E2016/16143 |
March 2016 |
Draft reported to Council |
Further Document Information and Relationships
|
Related Legislation |
Local
Government Act |
|
Related Policies |
Safer Community Compact 2012-2016 (E2012/2282) |
|
Related Procedures/ Protocols, Statements, documents |
|
Table of Contents
1 Introduction
1.1 Crime Prevention Strategies and Action Plan – NSW Department of Justice
1.2 Development of Byron Shire Safer Community Compact
1.3 Background and achievements of Safer Community Compact 2012-2016
2. Byron Shire Local Government Area – an Overview of Demographic and Socio-Economic Data
3. Tourism Numbers
4. Crime Profile
4.1 What is a Crime Profile?
4.1.1 Bureau of Crime Statistics and Research
4.1.2 Tweed/Byron Area Command – NSW Police – Qualitative Data Analysis
4.2 Data Analysis
4.2.1 Top 5 Major Offences by NSW Local Government Area Ranking
4.2.2 Top 5 Offences in Byron Shire by Number of Incidents
4.3 Community Response. 19
4.3.1 Byron Shire Council Community Research (2013)
4.3.2 Byron Bay Town Centre Masterplan – community input
5. Priority Crimes
5.1 Assault (Non-Domestic Violence)
5.2 Other Theft
6. Alcohol-Related Crime
6.1 Liquor Licenses
6.2 Alcohol-Related Assault
7. Stakeholder Consultation
8. Monitoring and Evaluation
9. Action Plan
9.1 Safer Streets
9.2 Working Together
9.3 Safe Zones
9.4 Lock It Up!
10. Appendix One
10.1 Achievements of Safer Community Compact 2012-2016
10.2 Community Safety Audits
10.3 Byron Bay Town Centre Masterplan
10.4 The Night-time Economy in Byron Shire
11. Appendix Two
11.1 Drink-Driving
11.2 Sexual Assault
Tables, Charts and Diagrams
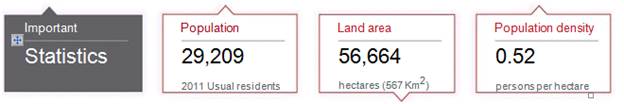
Table 1 - 2011 Census Data Snapshot for Byron Shire
Table 2 - Population density, 2011
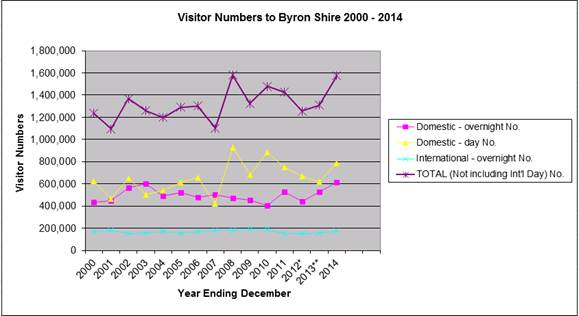
Chart 1 – Visitor Trends to Byron Shire 2000 - 2014
Chart 2 – Proportion of residents to visitors in Byron Shire 2014
Table 3 -Top 5 Ranked Major Offences for NSW LGAs
Table 4 - Major Offences - Annual Totals from January 2010 to December 2014
Table 5 - Top 5 Offences in Byron Shire by Number of Incidences
Table 6 - Top 5 Offences Annual Totals from January 2010 to December 2014
Chart 3 - Recorded Incidence of Possession and/or Use of Cannabis Between October 2011 and September 2015
Chart 4 - Recorded incidents of Other Theft between October 2010 and September 2015
Chart 5 - Recorded incidents of Offensive Conduct between October 2010 and September 2015
Chart 6 - Recorded incidents of Malicious Damage to Property between October 2010 and September 2015
Chart 7 - Assault – non-DV - Comparison of Incidence Between Local Government Areas
Diagram 1 - Assault, Non-DV - Byron Shire Hotspot Map 2015
Chart 8 – Assault – non-DV - Incidents by month between January 2010 and January 2015
Chart 9 – Assault – non-DV - Incidence by Day and Time
Chart 10 – Assault – non DV - Age and Gender of Offenders
Chart 11 – Assault – non-DV - Age and Gender of Victims
Chart 12 - Other Theft - Comparison between Local Government Areas
Chart 13 - Number of Liquor Licenses - Comparison between Local Government Areas
Table 7 – Liquor License Types in Byron Shire at February 2016
Table 8 - Percentage of NSW Crimes Alcohol-Related
Chart 14 - Percentage of Crimes Alcohol-Related in the Byron LGA
Table 9 - Alcohol attributable hospitalisations by Local Government Area, NSW 2012-13 to 2013-14
Chart 15 - Assault – alcohol related - Comparison of incidents between Local Government Areas
Chart 16 – Assault – non DV (alcohol related) - age of offenders
Chart 17 - Exceed the prescribed content of alcohol or other substance limit -Comparison between Local Government Areas
Chart 18 - Number of Prescribed Concentration of Alcohol Offences by Day of the Week
Chart 19 - Number of Prescribed Concentration of Alcohol Offences by Time of the Day
Chart 20 - Alcohol as a Factor in all Crashes
Chart 21 – Alcohol-Related Road Crashes in Byron Shire
Chart 22 – Sexual Assault (alcohol related) - Comparison between Local Government Areas
In 2008, the Attorney General’s Department released revised crime prevention planning guidelines as part of the NSW Crime Prevention Framework. These guidelines support the development of an evidence-based approach that encourages situational crime prevention measures. Councils are asked to identify one or two priority crimes through
a Crime Prevention Strategy and to develop a number of targeted actions to address them.
The Byron Shire Council has followed the Department’s guidelines in the development of this Safer Community Compact. Incorporated in the development of this Compact are the Department 5 key stages in the development of a Crime Prevention Strategy:
1. Develop a crime profile (which includes the level, location and types of both reported and non-reported crime in the local area, trends, and factors that influence the incidence of crime in the local setting).
2. Research crime prevention approaches (actions or activities that have been proven to positively impact on the crimes to be targeted, making sure that the approaches selected will reduce risk factors and increase protective factors in our community)
3. Negotiate support (engaging with agencies and businesses that have an influence over the factors either causing the targeted crimes or limiting them)
4. Develop an Action Plan (with clear and measurable objectives, performance measures and time frames for six-monthly reporting to the Attorney General’s Department)
5. Implement and monitor the crime prevention strategy.
During previous years, the Department have focused on the following areas for funding:
· Assault (non domestic violence), including Crime Prevention Through Environmental Design measures
· Break and enter (dwelling) /steal from dwelling
· Malicious damage
· Retail theft
· Steal from motor vehicle, and
· Steal from person.
Byron Shire Council has a proven and ongoing commitment to improving community safety, and reducing crime, making the Byron Shire an even safer place to live, work and visit. Council recognises that crime reduction and prevention is more effective when a collaborative approach is taken, using a combination of measures that are tailored to local circumstances.
The Byron Shire Safer Community Compact is an evidence-based plan that draws on information from the Bureau of Crime Statistics and Research (BOCSAR) and Tweed Byron Local Area Command Police to develop a Crime Profile.
Council adopted the Safer Community Compact 2012 – 2016 in February 2013 with the two priority crimes being, Assault – Non-Domestic Violence[1] and Other Theft[2].
Following evidenced-based analysis, consultation with key community stakeholders, police and local service providers, the priority crimes remain unchanged.
For the Safer Community Compact 2016-2019, the two priority crimes are:
1. Assault – Non-Domestic Violence1
2. Other Theft2.
The key objectives of the SCC are to guide the actions of Byron Shire Council and its partners to:
i. reduce the incidence of Assault (Non-Domestic Violence), specifically alcohol-related
ii. reduce incidences of other crimes that have a high relation to alcohol such as, malicious damage to property, offensive conduct, sexual assault, exceed the prescribed content of alcohol or other substance limit, for example.
iii. reduce the incidence of Other Theft
iv. increase community perceptions of safety.
The Byron Shire Safer Community Compact:
· follows the NSW Department of Justice and Attorney General’s crime prevention planning guidelines,
· builds on the Safer Community Compact 2012-2016,
· incorporates the 2007 Safety Audit of Ocean Shores and Brunswick Heads,
· incorporates the 2008 & 2013 Safety Audits of the Byron Bay Central Business District,
· incorporates the Byron Bay Alcohol Action Plan 2013,
· considers the Byron Bay Town Centre Masterplan and the Vibrant Byron Bay Strategy, including Night-time Economy research undertaken for Byron Shire,
· and incorporates stakeholder input.
The previous Safer Community Compact 2012-2016 helped initiate several projects, both undertaken by Council, and also by business and community. A primary outcome of the previous Compact was the increased collaboration between Council, community groups and business groups.
Council initiatives included:
· Trialling a late night bus, which was subsequently adapted and is now provided by Byron Bay Taxi’s and Limousines.
· An alcohol education campaign was locally produced comprising a hip hop video and posters and distributed widely throughout peak summer, including as community service announcements on TV.
· Improved street lighting and CCTV in key areas
· Development of the Byron Bay Town Centre Masterplan
· Safer Summer in the Bay strategies that have been very successful in reducing arrests, hospital presentations and waste collected over the new year period.
· Continued support of the Schoolies Safety Response.
Business and community initiatives included an education campaign by the Byron Bay Liquor Accord and ongoing RSA training of high school students; the introduction of voluntary measures by the Byron Bay Liquor Accord; and the Byron Bay Alcohol Action Plan which was driven by the Office of Liquor Gaming and Racing.
For further information about achievements and background information, please refer to Appendix One.
Data, including tables and graphs in this section are taken from the Byron Shire Council .id profile web portal.
Following are some tables and graphs outlining selected /key demographic information for the Byron Shire.
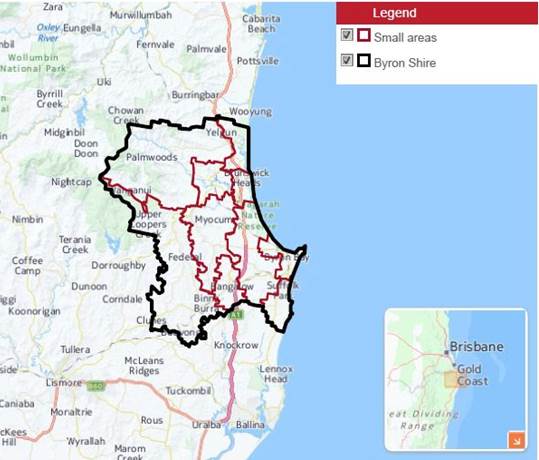
Location and boundaries
Byron Shire is located on the Far North Coast of NSW, about 800 kilometres north of the Sydney CBD and 200 kilometres south of the Brisbane CBD.
|
|
Byron Shire |
Regional NSW |
NSW |
Australia |
|
Median age |
42 |
41 |
38 |
37 |
|
Median weekly household income |
$885 |
$961 |
$1,237 |
$1,234 |
|
Couples with children |
23% |
27% |
32% |
31% |
|
Older couples without children |
7% |
12% |
9% |
9% |
|
Number of dwellings |
14,570 |
n/a |
n/a |
n/a |
|
Medium and high density housing |
17% |
16% |
31% |
31% |
|
Households with a mortgage |
26% |
30% |
32% |
33% |
|
Median weekly rent |
$350 |
$220 |
$300 |
$285 |
|
Households renting |
30% |
27% |
29% |
29% |
|
Non-English Speaking backgrounds |
7% |
5% |
19% |
16% |
|
University attendance |
3% |
3% |
4% |
4% |
|
Bachelor or Higher degree |
21% |
12% |
20% |
19% |
|
Vocational Qualification |
19% |
22% |
18% |
18% |
|
Public transport (to work) |
1% |
2% |
14% |
10% |
|
Unemployment |
8.7% |
6.2% |
5.9% |
5.6% |
|
Volunteer |
26% |
20% |
|
|
|
SEIFA index of disadvantage 2011 |
977 |
969 |
996 |
1002 |
|
Byron Shire - Enumerated |
|||
|
Area |
Number |
Hectare |
Persons / hectare |
|
Bangalow |
1,803 |
2,410 |
1 |
|
Brunswick Heads |
1,853 |
1,432 |
1 |
|
Byron Bay |
5,908 |
1,912 |
3 |
|
Mullumbimby |
3,314 |
2,765 |
1 |
|
Myocum - Coorabell and District |
1,634 |
6,736 |
0 |
|
Ocean Shores - New Brighton - South Golden Beach |
5,815 |
2,238 |
3 |
|
Rural North West |
2,440 |
15,612 |
0 |
|
Rural South West |
2,114 |
14,478 |
0 |
|
Suffolk Park - Broken Head |
3,584 |
2,070 |
2 |
|
Tyagarah - Ewingsdale and District |
1,528 |
7,010 |
0 |
|
Byron Shire |
29,988 |
56,664 |
1 |
|
Regional NSW |
2,516,204 |
78,897,085 |
0 |
|
Northern Rivers |
279,947 |
2,075,777 |
0 |
|
New South Wales |
6,896,776 |
80,134,300 |
0 |
|
Australia |
21,504,278 |
770,213,508 |
0 |
Byron Shire receives approximately 1.5 million* visitors per year, with 90% of them visiting Byron Bay**
*Tourism Research Australia year ending December 2014
** Byron Shire Visitor Profile and Satisfaction Survey 2011
Chart 1 shows visitor number trends for the past 15 years. Day visitors make up approximately half of all visitors to the Shire and largely (72%) travel from South East Queensland. Byron Shire has the highest number of international visitors in NSW outside Sydney.
It is estimated visitors spend $426 million per annum in the Byron Shire with the estimated number of jobs directly related to visitor spend approximately 3,400 (or 7%).
The number of tourists/ visitors to the Byron Shire significantly outweighs the residential population as shown in Chart 2. This should be taken into consideration when viewing the Bureau of Crime Statistics and Research statistics that compare the incidence of crime per 100,000 residential population, which in turn provides the local government area ranking in the state for that crime. It is suggested that if the incidence of crime was compared to the estimated residential AND visitor population at any one time, Byron Shire would not rank as highly in the state on some crimes.
A crime profile identifies the level and types of the crime including: time, location, and the factors that influence the incidence of that crime in a local setting. Acknowledgement of where and why a crime is occurring, who is committing it, and who are the victims enable the development of strategies that can specifically reduce that crime.
This crime profile consists of a detailed analysis of crime data provided by the NSW Bureau of Crime Statistics and Research (BOCSAR) and the Tweed Byron Local Area Command, NSW Police. After distinguishing the overall picture of crime within the Shire, the two priority crimes selected are:
a) Assault (Non-Domestic Violence)
b) Other Theft
BOCSAR is a statistical and research agency within the Department of Justice that develops and maintains statistical databases on crime and criminal justice in NSW. Its database records criminal incidents reported to the NSW police. All statistics included in the SCC are sourced from BOCSAR unless otherwise cited.
Statistics for some offence categories do not accurately reflect the actual level of crime in the community due to factors such as crimes not being reported. For example a large number of assaults, sexual assault and robberies are not reported to police. Another factor that influences the statistics for the Byron Shire is that the rankings are based on the number of crimes relative to the resident population. Therefore Byron Shire will be ranked higher compared with other regions due to the large number of tourists not being reflected in the denominator of the rate calculation. It is worth noting that many of the incidences of crime are higher during peak visitation times.
This crime profile includes comment from the Tweed Byron Local Area Command, NSW Police on the hotspots, priority times, victims and offenders that relate to the crimes identified from BOSCAR crime statistics. Also included is information provided by the Tweed Byron Local Area Command relating to Police priorities, local knowledge, or ‘what the statistics don’t show’, and other factors that contribute to the occurrence of crime. For example, large events and celebrations, such as Schoolies and New Year’s Eve, which attract more people to Byron Bay with the associated additional risks. Council has taken a proactive approach to the provision of safe, family-friendly entertainment at public events within its control, and this plan will reinforce the joint approach to community safety for the future.
The Tweed Byron Local Area Command, NSW Police have advised that the crime statistics included in this report should be read with caution given that there is a very strong link between increased enforcement / crime-targeting and increases in reported incidents. For example, an increase in the statistics does not necessarily reflect an increase in the incidence of that crime being committed but rather could indicate an increase in the number of offenders detected during a priority crime-targeting campaign. Eg, during a drink-driving campaign, it is likely that the number of drink-driving incidents will increase.
The analysis of statistics allows for an evidence base on which targeted strategies can be developed. The BOCSAR statistics are grouped into two categories; Major Offences and Other Offences. Major Offences includes the most serious personal violence and property offences. Detailed statistics are provided by BOCSAR for the Major Crimes and only basic statistics are available for Other Offences. From this data, the top 5 Major Offences along with the five most commonly occurring crimes in the Byron Shire are identified. A more detailed analysis of the Priority Crime selected – Assault – non-domestic violence, is presented below.
Analysis of information from BOCSAR has revealed the following Major Offences as those that rank highest for Byron Shire when compared to the other 138 Local Government Areas in the State with a population over 3000 people.
|
Number of recorded criminal incidents for major offences in Byron Shire for 2014 |
Rate per 100,000 population for 2014 |
State Rank |
||
|
Type of Offence |
No. of Offences |
Byron Shire |
NSW Average |
|
|
Steal from person |
60 |
189.8 |
82.8 |
1 |
|
Assault – non domestic violence |
302 |
955.3 |
428.1 |
5 |
|
Steal from dwelling |
182 |
575.7 |
302.1 |
17 |
|
Fraud |
189 |
597.9 |
661.5 |
27 |
|
Steal from retail store |
90 |
284.7 |
277.6 |
36 |
Table 3 shows that Byron Shire has three major offences that are ranked in the top twenty-five Local Government Areas in the State. This represents a decrease since 2010. Fraud and Steal from retail store have moved into the top 5 major offences for Byron Shire and break and enter non-dwelling and steal from motor vehicle now rank lower and are no longer in the top 5 major offences for the Shire.
Notes to the top 5 major offences in Byron Shire:
· 59% of victims of Steal from Person offences are between the ages of 18-29, 53% of these offences happen within a licensed premises.
· 61% of assault – non-domestic violence offences are alcohol-related, primarily occur during November, December and January and on a Saturday night between 6pm – 6am.
· 80% of offenders for assault – non-domestic violence are male aged between 20 – 40+. 44% of assault – non-domestic violence occur in outdoor/ public spaces, 22% in licensed premises and 16% in residences.
· Steal from dwelling occurs 56% on a weekday and 54% during daylight hours.
· 53% of fraud occurs in the retail/wholesale sector.
· 73% of steal from retail store occurs on a weekday with 87% during daylight hours.
Tweed / Byron Local Area Command Comment
Steal from Person: Confirming the information in the statistics, the Police stated that the majority of these crimes occur in licensed premises.
Assault (Non-DV): regularly alcohol-related and occur in or around licensed premises in Byron Bay on the weekends in the early hours of the morning.
Steal from Dwelling: This is often an opportunistic crime as some of the victims report having not locked their house. The property stolen is usually light, portable and easily concealed.
Fraud: The majority of fraud offences are ‘fail to pay for petrol’.
Steal from Retail Store: An increase in the incidence of this crime is probably due to an increase in reporting of steal from retail store. Whereas these crimes may not have been reported in the past, now insurance companies require a police report for insurance claims.
The table below displays the total recorded incidence of the five highest ranking Major Crimes over the past five years along with the average annual percentage variance over that period. It is evident from this table that the incidence of crime over the past 5 years is either stable or decreasing, with the exception of fraud and steal from retail store.
|
Offence |
Jan - Dec 2010 |
Jan - Dec 2011 |
Jan - Dec 2012 |
Jan - Dec 2013 |
Jan - Dec 2014 |
Average Annual Percentage Variance |
|
Steal from person |
68 |
78 |
108 |
86 |
60 |
1% |
|
Assault - non-domestic violence |
305 |
349 |
350 |
316 |
302 |
0% |
|
Steal from dwelling |
172 |
166 |
215 |
201 |
182 |
3% |
|
Fraud
|
103 |
82 |
110 |
153 |
189 |
19% |
|
Steal from retail store |
74 |
85 |
98 |
101 |
90 |
6% |
The following table outlines the top five crimes (Major and Other) by the total number of incidents recorded in 2014 within the Byron Shire (excluding driving offences).
|
Number of recorded criminal incidents for other offences in Byron Shire for 2014 |
Rate per 100,000 population for 2014 |
State Rank |
||
|
Type of Offence |
No. of Offences |
Byron Shire |
NSW Average |
|
|
Possession and/or use of cannabis |
879 |
2780.6 |
336.4 |
1 |
|
Other Theft* |
471 |
1489.9 |
436 |
1 |
|
Malicious damage to property |
328 |
1037.6 |
920.2 |
57 |
|
Assault – non domestic violence |
302 |
955.3 |
428 |
5 |
|
Offensive conduct |
255 |
806.7 |
86.6 |
1 |
*Other Theft includes the police incident categories of steal from marine vessels, steal vessels, other stealing occurring somewhere other than a residential dwelling (eg at temporary accommodation, business/commercial premises, in outdoor/public places).
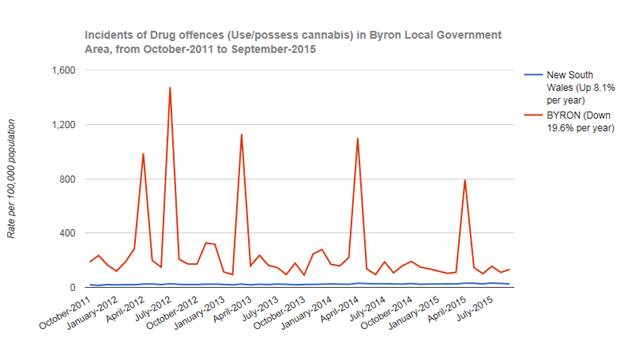
Byron Shire is ranked number one in the State for Possession and/or use of Cannabis with over 8 times the NSW average of number of offences per 100,000 population. Theft and Offensive Conduct also rank the highest in the State with over three times the NSW average of number of offences per 100,000 population for Theft and over 9 times the state average for Offensive Conduct.
Since 2010, the number of liquor offences has dropped and this crime is no longer in the top five offences for the Byron Shire, although it is still 1.3 times the state average.
Tweed / Byron Local Area Command Comment
Possession and/or use of Cannabis: A significant proportion of these incidents occur at music festivals and large events held in the Byron Shire. Over the period of the 2015 Byron Bay Blues Festival (Easter), approximately 151 cannabis charges were laid (as demonstrated by a spike in Chart 3 below). Targeted Drug Detection Dog operations are used at festivals and events and on other operations.
Other Theft: Of considerable concern to the Police is the incidence of Theft. The majority of these offences are theft of personal property off the beaches or from shared dormitories in backpacker hostels.
Malicious Damage to Property: Perpetrators are often bored and/or intoxicated people. Offences include, but are not limited to, graffiti, broken windows, damaged letterboxes, etc.
Offensive Conduct: Offenders have often just come out of licensed premises. Offences include urinating on the street and anti-social behavior in the public arena.
|
Offence |
Jan - Dec 2010 |
Jan - Dec 2011 |
Jan - Dec 2012 |
Jan - Dec 2013 |
Jan - Dec 2014 |
Average Annual Percentage Variance |
|||||||
|
Possession and/or use of cannabis |
689 |
749 |
1432 |
916 |
879 |
15% |
|
|||||||
|
Other Theft |
515 |
588 |
571 |
466 |
471 |
-2% |
|
|||||||
|
Malicious damage to property |
426 |
374 |
396 |
391 |
328 |
-6% |
|
|||||||
|
Assault - non-domestic violence |
305 |
349 |
350 |
316 |
302 |
0% |
|
|||||||
|
Offensive conduct |
204 |
247 |
362 |
377 |
255 |
10% |
|
|||||||
Table 6 highlights fluctuations in the total number of incidents recorded annually over the past five years, showing a peak for most crimes in 2012. Possession and/or use of cannabis has had an annual average percentage increase of 15%. This change is due to an increase in targeted drug operations carried out by the Tweed Byron Police, coupled with a full time Drug Detection Dog for the Local Area Command.
The following three Charts show the trends in incidents of possession and/or use of cannabis, other theft, offensive conduct and malicious damage to property.
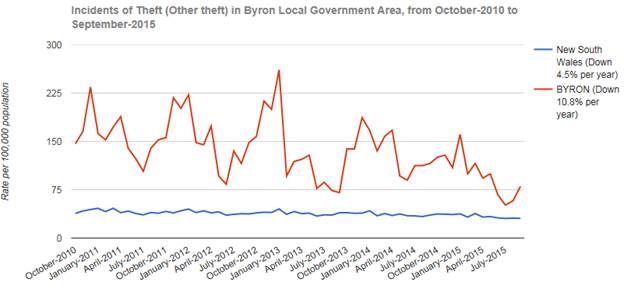
For ‘Other Theft’ Byron Shire is also ranked number one in the State. Chart 2 clearly demonstrates that the incidence of Theft is greater during holiday periods such as December / January and Easter. Offenders are generally male and over 18 years old.
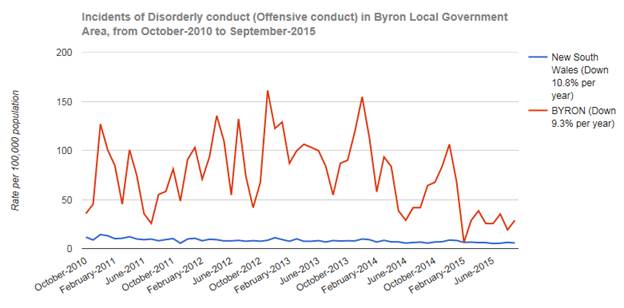
Offensive conduct has steadily risen each year until 2013 and then dropped in 2014. In 2014, 90% of offensive conduct offensives were recorded as alcohol-related with 93% committed by the 20-29 age group.
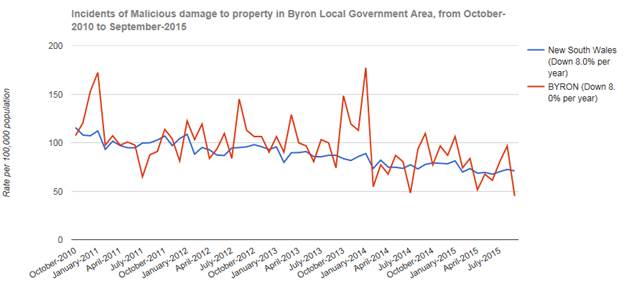
Malicious damage to property offences have steadily been declining in Byron Shire, with approximately 60% recorded as alcohol-related and most generally committed by 20 – 40 year olds.
Byron Shire Council undertook a Community Survey in November 2013. The purpose of the survey was to examine community attitudes and perceptions towards current and future services and facilities provided by Council. Key objectives of the research included:
1. to assess and establish the community’s priorities and satisfaction in relation to Council activities, services and facilities; and
2. to identify the community’s overall level of satisfaction with Council’s performance.
The sample consisted of 400 residents randomly selected by computer. This provided a maximum sampling error of plus or minus 4.9% at 95% confidence.
An analysis of the data found that ‘crime prevention and safety initiatives ranked number 8 (from 38 priorities) as a community priority. This item was considered to have a ‘very high’ level of importance, with a satisfaction rating of ‘moderately low’, therefore a performance gap was identified, placing this item in the top ten largest performance gaps for Byron Shire Council. Interestingly, the ‘quality of town centre and public spaces’ was mapped similarly in terms of importance and satisfaction results, but was not ranked in the top ten largest performance gaps.
Byron Shire Council has recently developed the Byron Bay Town Centre Masterplan, which seeks to promote the town’s natural environment, relaxed atmosphere, spiritual and cultural diversity, health and well-being experiences, innovative enterprises, and provide a consistent image for Byron Bay. This will help to attract appropriate visitor markets, extend length of stays and encourage visitor dispersal across the Shire. More importantly, an innovative place making strategy will provide a vibrant and diverse town centre for the resident population to enjoy - a place to be reclaimed.
Consultation with the community during the development of the Masterplan yielded the following comments:
· We’d like to see all areas of Byron Bay changed so it can be safer during school holiday periods.
· My least favourite place in Byron Bay is Railway Park as I don’t feel safe there.
· The lighting in Byron Bay is poor and there seems to be random attacks in town all the time from this.
· Challenges identified include ‘keeping eyes on the street for safety late at night’, ‘public safety’ and that lighting needs to be increased as there are presently many dark/ spooky places in town.
· Need more family friendly non-alcohol related places and spaces during the day and night.
The priority crimes were selected based on input from the Tweed Byron Police, analysis of the crime statistics and with consideration of the responses and recommendations of the community. Whilst there were other crimes with a higher number of incidents, the social impact of the crime and the effect on individuals was considered when selecting a priority crime. For example, the incidences of possession and/or use of cannabis is very high for Byron Shire, however through consultation with the Police and community members, the effect of these users on the local community or individuals was considered to have less impact, use less resources and not be as violent as other crimes, for example, malicious damage to property or sexual assault.
Assault (non-domestic violence)
Assault (non-domestic violence), with an emphasis on alcohol-related assault, was chosen for the following reasons:
i. A high rate of incidents – 302 recorded offences in 2014
ii. Byron Shire Council and the community have strategies that can be put in place to impact the occurrence of this crime.
iii. 955.3 incidents per 100,000 population compared to 428.1 for NSW
iv. Ranking of 5 out of 138 Local Government Areas in NSW
v. Stable levels of recorded incidents over a 5-year period
In the Byron Shire, 61% of assaults can be attributed to alcohol. A range of other crimes have a high rate of alcohol-related offences, such as
a. malicious damage to property (328 incidents),
b. offensive conduct (255 incidents and has trended up by 10% over the past five years),
c. exceed the prescribed content of alcohol or other substance limit (297 incidents),
d. sexual assault (66 incidents in 2014 – community consultation raised a concern that this was significantly underreported).
By reducing the incidents of alcohol-related anti-social behavior, it will have an impact on reducing incidents of other crimes which are alcohol-related. For further information, refer to Appendix Two which outlines Alcohol and Crime in the Byron Shire.
Other Theft
i. A high rate of incidents – 471 recorded offences in 2014
ii. Byron Shire Council and the community have strategies that can be put in place to impact the occurrence of this crime.
iii. 1489.9 incidents per 100,000 population compared to 436 for NSW
iv. Ranking of 1 out of 138 Local Government Areas in NSW
v. Stable levels of recorded incidents over a 5-year period
The majority of the incidents of other theft are visitors to the area leaving unsecured personal belongings on the beach, or in visitor accommodation. By creating greater awareness around personal property security, there may also be an impact on crimes associated with theft, such as:
a. Steal from motor vehicle (187 incidents in 2014)
b. Steal from dwelling (182 incidents)
c. Break and enter dwelling (114 incidents)
The ABS defines assault ‘as the direct infliction of force, injury or violence upon a person, including attempts or threats’.
Assault (Non-DV) is a Major Offence. Other offences associated with Assault (Non-DV) are Disorderly Conduct, Offensive Conduct, Offensive Language, Harassment, and Threatening Behaviour. Assault (Non-DV) may also lead to Malicious Damage of Property.
Assault (Non-DV) has a significant impact on the victim and also on the community. Members of the community impacted by this crime are witnesses, the Police, health care workers, business owners and their staff, and the residents of the town. The community’s perception of safety is diminished.
The Tweed Byron Police state that a large proportion of Assault (Non-DV) goes unreported due to victims choosing not to report the incident or the Police not being notified at all. Therefore the crime data should be considered an underestimate of the actual incidents.
The crime data shows that the Byron Shire has a higher incidence of Assault (Non-DV) than the NSW State average and that of the surrounding Local Government Areas as can be seen in Chart 7.
Of the recorded incidents, 44% takes place in a public/outdoor area, 22% in a licensed premises and a further 16% in a private residence; and 61% of incidents can be attributed to alcohol.
80% of Assault (Non-DV) within the Shire occurs in the Byron Bay CBD.
The BOCSAR statistics state that 61% of Assault (Non-DV) recorded in the Byron Shire is alcohol-related with 78% of the Shire’s alcohol-related assault happening in the Byron Bay CBD.
The incidence of Assault (Non-DV) peaks during the holiday periods of December / January, April, July and September / October as shown in Chart 8.
The incidence of assault is highest between 6pm and 6am on Saturday night/ Sunday mornings, and Friday night/ Saturday mornings. The rise in incidents on Wednesday mornings between 12-6am appears to be an anomaly with no explanation. This result is correlated to an increase in the consumption of alcohol at these times. Alcohol is a contributing factor in 61% of Assault (Non-DV) within the Byron Shire.
27% of Assault (Non-DV) are committed by males aged 20-29 and 29% being committed by males aged 40+. 20% of all Assault (Non-DV) are committed by women, as shown in Chart 10.
Victims of Assault (Non-DV) are predominantly males aged 20-40+ with 75% of the total recorded incidence. 21% of victims are women.
The Bureau of Crime Statistics and Research define ‘Other Theft’ as including the police incident categories of steal from marine vessels, steal vessels, other stealing occurring somewhere other than a residential dwelling (eg at temporary accommodation, business/commercial premises, in outdoor/public places).
The Tweed Byron Police reported that the majority of Other Theft in the Byron Shire is the theft of personal property left temporarily unattended on the beaches. Incidents increase when tourist numbers are high, particularly over the summer months. Victims are most often holiday-makers, less aware of the risk, who leave their camera, phone, purse and other personal effects on the beach as they swim, surf or walk on the beach. There is little information about the offenders of this crime as they are seldom identified.
Another ‘Other Theft’ offence regularly reported to the Tweed Byron Police is the theft of personal property from shared dormitories at backpacker hostels. These incidents often involve the theft of an item such as an MP3 player left unsecured on the victim’s bed or in their luggage. The opportunity for this offence is often enhanced due to the lack of secure facilities such as lockers in the dormitories of some hostels. Victims and offenders are generally tourists. Incidents increase in high tourist periods.
The Byron Shire is ranked number one in the State for Other Theft and has more than three times the incidents of the surrounding LGAs, and the NSW average rate per 100,000 population.
Strategies to reduce the incidence of other theft may also assist in reducing a range of other stealing offences, such as steal from motor vehicle, steal from dwelling, break and enter dwelling and steal from retail store.
Qualitative data and anecdotal evidence shows that, alcohol and crime can often go together. While intoxication does not always lead to offending, there is an increased likelihood that the offender will be intoxicated[3].
Evidence shows that 61% of the assault – non domestic violence incidents are alcohol related. By reducing the incidents of alcohol-related anti-social behavior, it will have an impact on other crimes which are alcohol-related, such as malicious damage to property, offensive conduct, exceed the prescribed content of alcohol and other substance limit (drink driving) and sexual assault.
Based on the success of the previous Safer Community Compact in forming partnerships and improving collaboration, Council will continue to target crime related to alcohol by working with the state government with regards to drink driving and other service providers, for example, with sexual assault, as opportunities arise. For statistics around drink driving offences and sexual assault, refer to Appendix Two.
There is a substantial amount of evidence in the scientific literature showing a cross-sectional relationship between alcohol outlet density and a range of alcohol-related harms[4]. It has been suggested that to reduce alcohol-related crime, a need exists to systematically reduce the levels of alcohol consumption, such as increase in tax on alcohol, restricting outlet sales hours or restricting the number of outlets.6
It has been found that drinking in licensed venues is associated with high levels of alcohol-related problems including violence and aggression[5],[6]. A NSW study found that “total alcohol sales were significantly and positively correlated with the rate of malicious damage to property, assault and offensive behaviour, regardless of type of alcohol”[7].
In addition, the trading hours of licensed venues have an impact on alcohol-related crime, “the balance of reliable evidence…suggests that extended late-night trading hours lead to increased consumption and related harms”.[8]
In 2014, the Office of Liquor, Gaming and Racing (OLGR) reported that there are 125 liquor licenses within the Byron Shire. This equates to 389 liquor licenses per 100,000 population. This is considerably higher than the surrounding Local Government Areas and the NSW state average of 218 as is demonstrated in Chart 13.
The type of liquor licence and trading hours are provided in Table 7.
Notes:
1. Extended Trading Auth refers to licences where there is an 'Extended trading authorisation' class.
2. Trades after Midnight refers to licences where:
a. trading hours in GLS have at least one day of the week where there is an end time between 12:01am and 5:00am, OR
b. there is an 'Unrestricted on premises hours' class (clubs).
3. 24 Hour Trading refers to licences where:
a. trading hours in GLS have at least one day of the week where the start time is 5:00am and the end time is 5:00am, OR
b. there is an 'Unrestricted on premises hours' class (clubs).
Important: Liquor other - notifications are included in the LGA Summary and
Licence Listing reports. These are treated as licences in GLS, but are not
licences per legislation.
Table 8 provides an overview of research findings relating to the proportion of offences for which alcohol has been identified as a contributing factor in NSW.
|
Offence |
Percentage Alcohol-Related 2010 |
Percentage alcohol-related 2015 |
|
Assault |
73% |
32% |
|
Noise |
59% |
74% |
|
Malicious Damage |
58% |
11% |
|
Domestic Violence |
40% |
22% |
|
Street Offences |
77% |
54% |
Source: NSW Police
Chart 14 outlines offences related to alcohol where, in the Byron Shire 61% of Assault (Non-DV), 48% of Assault – domestic violence related, 43% of Robbery and 20% of Malicious damage to property offences are alcohol-related.
 * It
is difficult for police to make a determination about the involvement of
alcohol in a criminal incident if the identity of the offender is not known. This is common for many property offences and this
data should therefore be interpreted with this in mind
* It
is difficult for police to make a determination about the involvement of
alcohol in a criminal incident if the identity of the offender is not known. This is common for many property offences and this
data should therefore be interpreted with this in mind
The effect of alcohol related crime can be seen in Table 9 which outlines alcohol attributable hospitalisations by Local Government Area.
|
Local Government Areas |
Smoothed Number of Separations per Year |
Smoothed Rate per 100,000 population |
Smoothed Estimate of Standardised Separation Ratio |
Significantly higher or lower than State |
|
Ballina |
311.6 |
667.7 |
93.4 |
0 |
|
Byron |
223.7 |
677.1 |
94.7 |
0 |
|
Lismore |
338.8 |
742.0 |
103.8 |
0 |
|
Tweed |
632.0 |
625.8 |
87.5 |
-- |
Certain drinking patterns such as public drinking can increase the risk of violent behaviour occurring[9].
A study by Dr Anne Fox[10] in January 2015 looked at Understanding behaviour in the Australian and New Zealand night-time economies found that:
1. it is the wider culture that determines the behaviour whilst drinking, not just the drinking;
2. the physical effects of alcohol do not determine a behavioural response;
3. violent individuals, a violence-reinforcing culture and violent situations are the three interlinked drivers of anti-social behaviour and violence in the night-time economy; and
4. a dispassionate review of alcohol education is needed.
Some recommendations relevant to a crime prevention strategy such as this, include:
· the inclusion of a broader cross-section of society in the night-time environment will add social pressure to conform to positive societal norms. Fostering urban night-time entertainment environments that welcome people across the age spectrum will alter the social dynamic, and reduce the incidence of violence.
· There should be a de-emphasis on the consumption of alcohol for its own sake and a refocus on entertainment and group conviviality.
· Drinking environments and educational materials should be developed to support hospitality operators in improving their establishments, reducing aggression-inducing cues or images and replacing with calming and conflict-reducing features.
· The triggers of violence can also be reduced through good amenities such as clean and safe public toilets, good availability of 24-hour food service with clean and well-managed premises and adequate transport out of the entertainment district.
· Coordination between publicans, police, government and the broader community could diffuse fights at the source, rather than moving the issue from one space to another.
· Empower the community – where successes in reducing trouble have been observed these were largely places where residents had a strong sense of and commitment to their community.
For alcohol-related assaults, Byron Shire’s rate per 100,000 population is 2.2 times more than the State average and higher than surrounding Local Government Areas as shown in Chart 15.
The BOCSAR hotspot map on page 22 demonstrates that 78% of the alcohol-related assaults occur within the Byron Bay CBD.
There are certain types of events and activities that may lead to greater incidence of alcohol-related violence / elevated risks, such as Schoolies celebrations in Byron Bay. Further, spikes in alcohol related violence in peak visitation periods
The age of offenders in alcohol related crime is similar across a number of offences. In alcohol related assault (non DV), 61% of offenders in 2013 were age 20-29 and in 2014, there was a significant rise in the 18-19 year age group of 21%, with 32% being aged 20-29 years old.
A key aspect of the SCC is consultation with the whole community. Consultation is important as it not only assists in identifying local crime concerns, but also helps to develop strategies that bring about the co-operation of the community in improving community safety.
The development of this SCC involved meetings with the Tweed Byron Police. Input was received from the Commander of the Tweed Byron Local Area Command as well as from the Inspector at Byron Bay Police Station, the Crime Manager, the Crime Prevention Officer, the Intelligence Supervisor, and the Crime Coordinator.
Other consultation included presentations to various groups, such as Councils ‘Community Roundtable’ and ‘Business Roundtable’.
A specific workshop was held to collect feedback and consult with various community members. Input was received from Byron Youth Service, Byron Bay Chamber of Commerce, Byron Bay Liquor Accord, individuals in the community and business owners, Last Drinks at 12 community group, Byron Community Centre, Mullumbimby & District Neighbourhood Centre, The Buttery, Byron Bay Limousines and Taxi’s, and North Coast Area Health Service. Feedback from the community indicated that overall the individuals consulted believe the Shire to be a safe place. Concerns raised for Mullumbimby and Brunswick Heads were underage drinking and graffiti and the effect of crime on the large number of homeless people.
Data and feedback was collected during discussions over the development of the Vibrant Byron Bay Strategy, which is a strategy focused on developing the night-time economy further to promote a vibrant and safe night life in Byron Bay for both residents and visitors.
Council staff will be responsible for ensuring the action plans are implemented and carried out by the lead agencies and project partners and that the SCC remains a living document. All project partners will be responsible for ensuring that the project milestones are met within the timeframes, or modified if necessary.
Feedback and data updates will be gathered from the Police and community members at the Community Safety Precinct Committee meetings run by the Local Area Command.
Monitoring data on the BOCSAR site will allow for the assessment of project success against the Shire’s state LGA rankings. Statistics will also be collected from the NSW Roads and Traffic Authority as well as the Office of Liquor, Gaming and Racing.
Regular community surveys undertaken by Council will assist in assessing the public’s perception of crime. Council has undertaken to conduct community surveys bi-annually.
The projects included in this plan aim to reduce the incidence of the two priority crimes:
1. Assault – Non-Domestic Violence (alcohol-related); and
2. Other Theft.
|
Target Offence: |
Assault Non-DV (with a focus on alcohol-related assault) |
|
Project: |
Safer Streets – Crime Prevention Through Environmental Design (CPTED) Opportunities have been identified in the Byron Bay Town Centre Masterplan in CPTED:
1. Use CPTED principles to increase surveillance, control access, improve territorial reinforcement and manage space. Primarily these are found in the strategies for improvements in the public domain with a whole sub-strategy on providing a ‘safe and friendly centre’ of town. There are also links with other sub-strategies in the plan, namely ‘access and movement’, ‘culture’ and ‘economic development’.
2. The Plan has an emphasis on ‘placemaking’ strategies to activate spaces for the public to enjoy. Generally they are temporary activities that engage the community and activate under-utilised areas. These provide an excellent opportunity to engage with businesses and residents to improve public amenity. The Masterplan divides Byron Bay up into ‘catalyst sites’ and we propose to actively involve businesses in these precincts in developing placemaking activities, particularly to improve the night-time economy landscape. |
|
Rationale: |
CPTED has proven to be highly effective in discouraging and preventing crime and increasing the public perception of safety. Councils are encouraged to focus on Situational Crime Prevention and adopt CPTED strategies.
Safety Audits carried out by the Tweed Byron Police outline areas where actions can be taken to improve safety and prevent crime. The Byron Bay Town Centre Masterplan included extensive community consultation over a twelve-month period during 2014 and includes information about community attitudes and suggestions for action.
The majority of Assault (Non-DV) offences within the Shire occur on the streets of Byron Bay in close proximity to licensed premises. By working with businesses and the community to activate under-utilised sites and improve the night-time activity in Byron Bay, community safety and perceptions of safety will increase. |
|
Lead Agency & Prospective Partners |
Byron Shire Council Byron Bay Chamber of Commerce Businesses and community members |
|
Objective |
To reduce the incidence of alcohol-related non-domestic violence, and other alcohol related crimes, in hotspots identified by police between the hours of 6pm to 6am on Friday/Saturday and 6pm to 6am Saturday/Sunday over the life of this Compact. |
|
Expected Outcome |
1. A reduction in the incidence of non-DV assault across the Shire as well as a reduction in other crimes within the Byron Bay CBD such as Sexual Assault, Malicious Damage, Theft, Robbery and Disorderly Conduct. 2. Developing partnership between Council, licensed premises and other businesses, Byron Bay Chamber of Commerce and other relevant agencies. 3. A heightened perception of safety within the community and an increase in usage of public space. |
|
Target Offence: |
Assault Non-DV (with a focus on alcohol-related) |
|
Project: |
Working Together There are a number of community groups and organisations working to improve safety and social cohesion within the Byron Shire. Examples of these are Byron Youth Service who run Street Cruise and Mobile Youth Outreach Service, promoting a sense of safety and preventing crime across the Shire and the STEER Project. These programs will be supported and enhanced and the following strategies as suggested through community consultation.
The ‘working together’ strategy will partner with community members and organisations to promote individual safety and responsibility. The focus is on raising awareness and education across a range of projects:
1. Develop a PR campaign including a small (business card size), quirky handout for visitors and distribute at festivals, in accommodation, visitor outlets and in venues. Include information such as lock out times, no drinking in the streets, and some of the other Byron Bay Liquor Accord measures. Include messages of ‘what we love about Byron’. The idea is to communicate how to behave in Byron to have a great holiday. The material can also be shared on social media and in venues and businesses. 2. An ambassador/ guardian/ bystanders program of education for business staff, volunteers and community members. Include taxi drivers and other key community connection points. Education may include a component of the Byron Greeters program to ensure they can answer visitor questions and add to the experience of having a holiday in Byron. 3. Develop awareness tools for ‘how not to be vulnerable’ for young people, particularly around alcohol and other drugs and sexual assault. Include information about what constitutes sexual assault/ indecent assault. 4. Work with community groups and individuals to raise awareness of ‘What’s your limit?’ Mobile breath testing and other tools can be used at festivals and community events to raise individuals awareness of their own personal limit. 5. Work with the Chamber of Commerce on a business award around responsible service of alcohol and/or contributing to community safety in a positive way. |
|
Rationale: |
A number of the offenders of non-DV assault are visitors to the Shire. These visitors are not always aware of the local laws and restrictions such as Alcohol-Free Zones. Visitors may also not be aware of available support services. This project will provide visitors to the Shire with this information.
There are a number of successful educational programs communicating the effects of alcohol such as ‘RRISK’ and ‘Wake Up’ The Byron Youth Service have developed a drug awareness program which is also proving to be successful. This project will seek to work in conjunction with these types of programs.
The Working Together project has been designed to address the following concerns: i. There is a very high number of visitors to Byron Shire and therefore a constant turn over of people who don’t know the local rules or community. ii. The majority of Assault (Non-DV) offences within the Shire occur on the streets of Byron Bay in close proximity to licensed premises. iii. The Byron Shire has over four times the incidence of drink-driving than the NSW average. iv. Having a sober person in a group of people discourages disorderly and offensive conduct of the other group members, thereby reducing the incidence of assault.
|
|
Lead Agency & Prospective Partners |
Byron Shire Council Byron Bay Liquor Accord Byron Bay Chamber of Commerce NSW Roads and Maritime Services Byron Youth Service STEER project Businesses and community groups |
|
Objective |
1. To reduce the incidence of alcohol-related non-domestic violence, and other alcohol related crimes, in hotspots identified by police between the hours of 6pm to 6am on Friday/Saturday and 6pm to 6am Saturday/Sunday over the life of this Compact. 2. To reduce the incidence of drink driving by 20% in three years. 3. To reduce the incidence of underage drinking and non-DV assaults and sexual assault amongst people under the age of 18 in three years. 4. To educate 50 local business staff, including security, taxis and retail staff, in community guardianship over three years. |
|
Expected Outcome |
1. A reduction in the incidence of alcohol related non-DV assault across the Shire as well as a reduction in other crimes such as Driving Under the Influence of Alcohol, Offensive Conduct, Disorderly Conduct and Malicious Damage. 2. A reduction in the number of alcohol-related car accidents and associated injury and fatality. 3. Developing partnership between Council, the Police, licensed premises, businesses and other relevant agencies. 4. An increase in the public’s knowledge of crime risks leading to a decrease in the opportunity for crime. 5. Increasing awareness and therefore compliance of local laws and restrictions. 6. A decrease in the alcohol and drug consumption of youth and in the associated crimes such as Assault, Malicious Damage, etc. 7. An increase in community knowledge and participation (ie volunteerism) in contributing to safety in Byron Shire |
|
Target Offence: |
Assault Non-DV (with a focus on alcohol-related) |
|
Project: |
Safe Zones Create ‘safe zones’ for people and improve safety for movement around Byron Bay CBD and the Shire.
1. Create safe transport nodes, such as bus stops, taxis zones, pick up points and cycle hubs. A public bicycle hire project is currently under investigation by Council for implementation amongst key locations within Byron Bay. Other Shire-wide bus stops and transport nodes could benefit from a ‘safe zone’ treatment. 2. Businesses could opt to become ‘safety businesses’ where people could retreat to when feeling threatened, or sit and ‘chill out’ for a while during a night out. A map of safe places, including safety businesses could be developed. Work with partners who have expressed interest in developing a ‘Safe Byron’ app, such as the Byron Youth Service. 3. During peak times, create a safe public place in the Byron Bay CBD such as the Railway Square precinct where agencies can set up temporary services, such as a Police beat base, Street Cruise base, Ambassador/ Guardian base point and a safe zone for people feeling threatened. |
|
Rationale: |
The Schoolies Safety Response Hub has been very successful in creating a safe space for young people during Schoolies celebrations in Byron Bay over a number of years. This project seeks to expand on the ‘safety hub’ idea throughout the year.
Consultation with the community often raises the safety of local young people, and young people in general of concern in Byron Bay with the high rate of assault – non-domestic violence and other alcohol related crime. |
|
Lead Agency & Prospective Partners |
Byron Shire Council NSW Police Byron Youth Service Local High Schools Schoolies Safety Working Group Transport operators Businesses Byron Bay Chamber of Commerce Businesses and community groups |
|
Objective |
1. To reduce the incidence of alcohol-related non-domestic violence in hotspots identified by police between the hours of 6pm to 6am on Friday/Saturday and 6pm to 6am Saturday/Sunday. 2. To reduce the incidence of underage drinking and non-DV assaults and sexual assault amongst people under the age of 18 in three years. |
|
Expected Outcome |
1. To reduce alcohol related crime, particularly with young people as victims, by providing safe spaces leading to a decrease in the opportunity for crime. 2. To increase the community’s perception of safety within the area 3. To develop existing partnerships between Council, the Police, and community organisations. |
|
Target Offence: |
Other Theft |
|
Project: |
Lock It Up! Funding will be sought for a portable locker trailer or a similar portable locker facility for use at the beach and during events. Availability of lockers will improve safety and decrease the incidence of Other Theft by providing secure facilities for people to store their personal items while they are out and about. There are several partners who might be interested in partnering on the Lock It Up! Project, such as festival and event organisers, Cancer Council and Surf Life Saving Australia. There is also a possible social enterprise or volunteer aspect to the project to build community capacity. |
|
Rationale: |
BOCSAR statistics show that the Byron Shire is ranked number one in the State for incidence of Other Theft. The Tweed Byron Police noted that the majority of these crimes are theft of personal effects from the beach and visitor accommodation, particularly backpacker establishments.
Having lockers available near beaches and at events will provide a secure space for people to store their valuables while they are swimming, surfing or participating in other activities that distract their attention from the safety of their personal effects. |
|
Lead Agency & Prospective Partners |
Byron Shire Council NSW Police Surf Life Saving Club/ Surf Life Saving Australia Cancer Council Community Organisations Festival and event organisers |
|
Objective |
To reduce the incidence of Other Theft during the life of this Compact. |
|
Expected Outcome |
1. To provide a secure, short-term storage facility for the public’s personal valuables. 2. To decrease the opportunity for crime 3. To increase the community’s perception of safety within the area |
Council adopted the Byron Shire Safer Community Compact and Action Plan in February 2013 and implementation of its strategies has resulted in numerous achievements in community safety and crime prevention. Some of these achievements include:
· Providing a late night bus in Byron Bay from the Schoolies period (mid November) through to the end of the Christmas School Holidays (finishing Australia Day long weekend). The bus was provided every Friday and Saturday night and additional peak nights during the Christmas/ New Year period and on Australia Day.
· Developing an Alcohol Education Campaign. The outcome of the campaign was a locally produced hip hop video and posters aimed at youth and distributed via social media amongst other avenues. The ‘What are you doing to yourself?’ video can be viewed on Council’s YouTube channel http://www.youtube.com/watch?v=HD1lio2xJ5M. Late night bus information was also distributed widely. The campaign also included improved signage throughout Byron Bay about alcohol free areas. In subsequent years, the alcohol education campaign was extended to having community service announcements on NBN, Prime 7 and Bay FM over the peak summer period (and also before Pighouse Flicks movies over summer 2014/15). Posters were distributed throughout Ballina, Lismore and Byron Bay to backpacker establishments, English Language Schooles and other visitor venues
· Crime Prevention Through Environmental Design – improved street lighting in Fletcher St (between Lawson and Marvel Sts) was funded over two funding rounds – 2014 and 2015. Prior to the upgrade, Fletcher Street lighting was inadequate and non-compliant with the Australian Standard. The lighting was at a value of 170W and after the upgrade, is 5900W.
A number of projects and initiatives has been implemented by Council and the community since 2012 and are listed below. The suite of measures are aimed at improving night-time safety in the identified hotspot areas of the Byron Bay CBD.
Byron Shire Council Initiatives
1. The adoption of the Byron Bay Town Centre Masterplan and subsequent projects arising out of the plan will have a positive effect on reducing crime in the Byron Bay CBD. This holistic Town Centre Strategy will include a master plan and place-making elements to guide future development in Byron Bay CBD. Council held a trial project to ‘activate’ laneways in the Byron Bay CBD with the “Bay Lane Night-time Enhancement” project in October 2014.
2. Council is currently developing a plan to improve the night-time economy, titled ‘Vibrant Byron Bay’. The strategy seeks to promote a vibrant and safe night life in Byron Bay for both residents and visitors.
3. Council was successful in obtaining a federal grant from the Attorney-General’s Department under the “Safer Suburbs Program – Taxi Security Scheme”. Lighting around the Byron Bay taxi rank and CCTV cameras were installed for taxi rank safety.
4. New Year’s Eve is seen as a time which ‘sets the mood’ for the rest of the year in Byron Bay. Council have developed proven strategies to create a vibrant, family friendly ‘Safe Summer in the Bay’. The program has run for three years and has been very successful in reducing crowd numbers and anti-social behaviour.
5. Park and Ride was trialled over the peak summer period during 2013/14 and 2014/15 in Byron Bay. Drivers park at The Cavanbah Centre and catch a free shuttle into Byron Bay – but not just any shuttle, the Magic Bus!
6. Council continues to participate in the Schoolies Safety Response Working Group to provide a Safety Hub where young people can obtain information, advice and assistance around excessive use of alcohol and binge drinking.
7. The Community Safety Camera Program (CCTV) has been installed in Apex Park and Jonson St, Byron Bay. Council successfully obtained a grant to undertake the installation from the Attorney-General’s Department under the ‘Safer Streets Program’.
8. Lockers were installed in the old Surf Club toilets (now change rooms) to provide residents and visitors with secure storage near Main Beach.
9. Council supports the Byron Youth Service ‘Street Cruise Program’ with a contribution of $15,000 annually.
Business and Community Initiatives
During 2013, the NSW Office of Liquor, Gaming and Racing worked closely with key stakeholders in Byron Bay with the aim of reducing the incidence of alcohol related assault. Several initiatives arose from this collaboration:
1. the Byron Bay Liquor Accord was reinvigorated and now has a committed executive structure and membership base.
2. the Byron Bay Liquor Accord introduced several voluntary measures on a trial basis from 21 March to 21 September 2013. The trial measures are now sometimes included in new liquor licenses and other members of the Liquor Accord still voluntarily implement the measures.
3. the Byron Bay Liquor Accord developed their own education campaign aimed at visitors. Posters and door hangers were designed and distributed around local venues, backpackers and other accommodation establishments. The message was to respect Byron Bay, drink responsibly and know your limits. The campaign aimed to ensure visitors understood the laws and their responsibilities in relation to alcohol while visiting Byron Bay.
4. the Office of Liquor, Gaming and Racing developed a ‘Byron Bay Alcohol Action Plan’ outlining several strategies aimed at reducing alcohol related assault (non-DV). The Plan lists ‘improved night lighting in public places’ as a key strategy.
5. the Office of Liquor, Gaming and Racing also undertook both education and compliance action where required with licensed premises with an intensive campaign during the trial period of the voluntary measures introduced by the Liquor Accord.
In 2008, and again in June 2013, members of the NSW Police Force Crime Prevention Team visited Byron Bay to conduct a community safety audit. The Safety Audits outline recommendations to improve safety, usually Crime Prevention Through Environmental Design (CPTED) actions. Safety Audits were also undertaken for Ocean Shores and Brunswick Heads in 2007.
A review of the safety audits was undertaken across departments within Council during 2014. The review noted the following:
1. Many items listed in the Safety Audits are outside Council’s control, eg are on private land or other government departments hold responsibility. However, Council can play an advocacy role with business, community and government groups to improve safety.
2. Council has undertaken several projects (listed above under ‘initatives’) which will satisfy some actions in the safety audits:
a. Bay Lane Night-time Enhancement Project
b. Vibrant Byron Bay Strategy (night-time economy strategy)
c. The development of the Byron Bay Town Centre Masterplan
d. Commencement of the ‘Better Byron Crew’ who are a maintenance crew focused solely on the upkeep of the Byron Bay CBD.
3. Safer Suburbs grant funding which upgraded lighting around the Byron Bay taxi rank and included CCTV cameras installed for taxi rank safety.
4. Safer Streets grant funding which provided for an open-street CCTV system in Apex Park and Jonson St, Byron Bay.
5. Paid Parking which is the result of parking studies and aims to improve parking in the Byron Bay CBD. By reviewing the demand in the parking studies (i.e. usage, turnover, occupancy, duration of stay) and supply (number of spaces, time limits, etc), the study has found much of the on-street parking in the town centre is at, or exceeds, efficient operating capacity (i.e. 85% or greater occupancy); while the off-street and outer perimeter is under-utilised with capacity between 54%-70%. The introduction of paid parking will change the way the Byron Bay CBD is used by pedestrians and may alleviate some of the problems identified in the safety audits regarding laneways etc.
Other improvements identified by the safety audits, which have not yet been implemented, include:
1. Working collaboratively with businesses and Police to reduce crime around retail and business premises.
2. Improve ‘wayfinding’ signage. The Byron Bay Town Centre Masterplan provides some guidance for improved signage.
3. Business waste in car parks and laneways needs to be addressed.
During 2014 there was extensive community consultation with high levels of participation in community workshops, site tours and online surveys in the development of the Byron Bay Town Centre Masterplan. The consultation identified a clear need to change the misbehaviour at night. The Masterplan suggests:
· Creating activity and therefore create safe places
· Use Crime Prevention Through Environmental Design principles to increase surveillance, control access, reinforce territory for locals and manage spaces.
· Encourage night-time activation, particularly by businesses.
· Install ‘sense of security’ CCTV networks to give people a sense of safety and also enable monitoring and review of incidents that occur within the town centre.
· Promote temporary activities that engage the community and activate under utilised areas in particular.
· Stronger emphasis on safety through partnerships, including engaging with local homeless people, building business and community relationship programs, for example, food rescue programs.
In 2012, Byron Shire Council became a member of the National Local Government Drug and Alcohol Committee, chiefly to access their research program into the scale and importance of the night-time economy in Byron LGA.
Byron Shire has been included in the research for 2012 and 2014.Following are some key facts from the 2015 released report:
· Byron Shire shows continuing increase in night-time economic performance
· Byron Shire shows substantial growth in its drinks and food sub segments of c27% and 39% respectively.
· As with many other locations in this study Byron Shire has lost ground in its entertainment led activities.
· Food led activities have risen to 59.6% of all Core Night-time economy spend compared to 57.8% for all Australia.
· Drink led sales revenue is well below the all Australian average at 8.2% of all sales compared to 15.3%
· The proportion of spend on Entertainment led activities remains higher than Australia at 32,2% but the prevailing statistic is the fall from 43.2%.
· Byron Shire derives a high level of overall economic activity from its lesser number of establishments, the key reasons likely to surround the overall volume of non-resident users of Byron Shire services.
The Northern Rivers region and, in particular, the Byron Shire has a high incidence of drink-driving. In 2007, BOCSAR identified that Byron Shire has over four times the State average per 100,000 population as is outlined in Chart 17.
During 2015, the Tweed Byron Police carried out 54,328 breath tests in the Tweed / Byron Local Area Command. Of those tested, 405 drivers had an illegal Prescribed Concentration of Alcohol (PCA). This is a ratio of 1:162.
PCA offences are most common on the weekends as can been seen in Chart 18.
Source: Tweed / Byron Local Area Command.
A large proportion of these charges are being made between 11pm and 3am.
Source: Tweed / Byron Local Area Command.
Information provided by the NSW Roads and Maritime Services outlines the involvement of alcohol in all crashes within the Byron Shire, compared with Northern Region and NSW, over a five year period as seen in Chart 20.
Source: NSW Roads and Maritime Services
Of the crashes that were alcohol-related, Chart 21 shows the incidents that were fatal, caused injury and the total number of alcohol-related crashes within the Byron Shire over a five-year period.
Source: NSW Roads and Maritime Services * Includes tow away/non-injury crashes
Community consultation highlighted a concern that sexual assault in the Byron Shire was significantly underreported. The Chart below shows that there is a higher rate per 100,000 population of sexual assault compared to surrounding LGAs and the NSW average, although the trend is declining.
[1] Assault – Non Domestic Violence is all violent assaults other than those involving domestic violence or assault of police
[2] Other Theft involves crimes such as theft of unattended items, pick-pocketing, bag-snatching, stealing, theft of stock/domestic animals, and theft of non-motorised vehicles/boats/aircraft/ bicycles/surfboards/skateboards etc.
[3] Murdoch, D., Pihl, R. O., & Ross, D. (1990). Alcohol and crimes of violence: Present issues. The
International Journal of the Addictions, 25(9), 1065-1081.
[4] Donnelly, N; Poynton,
S.; Weatherburn, D; Bamford, E; & Nottage, J (2006) Liquor outlet
concentrations and alcohol-related neighbourhood problems, Sydney, NSW Bureau
of Crime Statistics and Research.
[5] Homel, R., & Clark, J. (1994). The prediction and prevention of violence in pubs and clubs. In R. Clarke (Ed.) Crime Prevention Studies. Monsey, N.Y.: Criminal Justice Press. 3: 1-46.
[6] Ireland, C. S. (1995). Alcohol and its contribution to violence: New directions for policing alcohol-related violence, crime and anti-social behaviour in New South Wales. In D. Chappell and S.Egger (Eds.) Australian Violence: Contemporary Perspectives II. Canberra: Australian Institute of Criminology.
[7] Stevenson, R. J. (1996). The impact of alcohol sales on violent crime, property destruction and public disorder. Sydney: NSW Bureau of Crime Statistics and Research.
[8] Stockwell, T. & Chikritzhs, T. (2009). Do relaxed trading hours for bars and clubs mean more relaxed drinking? A review of international research on the impacts of changes to permitted hours of drinking. Crime Prevention and Community Safety; 11 (3):153-170
[9] Homel, R., Tomsen, S., & Thommeny, J. (1991a). Pubs and violence: Violence, public drinking, and
public policy. Current Affairs Bulletin, December, 20-27.
[10] Fox. A, Understanding behaviour in the Australian and New Zealand night-time economies – An anthropological study. (2015) Lion. UK.