13.2
- Attachment 3
Byron Shire Council
Strategic Asset Management Plan
General Fund Assets
Transport
Drainage
 Buildings
Open
Space
Recreation
Facilities
Other
Structures
Plant
& Equipment
Furniture
& Fittings
|
Document
Control
|
  
|
|
|
|
Rev No
|
Date
|
Revision Details
|
Author
|
Reviewer
|
Approver
|
|
|
|
|
|
|
|
|
1.0
|
May 2016
|
Draft SAMP
developed with consultants JRA
|
JM
|
JR
|
BS/PW
|
|
2.0
|
Nov 2016
|
Draft Final SAMP
developed with consultants Assetic
E2016/100839
|
ND
|
AP
|
BS/PW
|
|
|
|
|
|
|
|
TABLE OF CONTENTS
1. INTRODUCTION.. 1
Community Profile. 1
2. EXECUTIVE SUMMARY. 3
Context 3
Current situation. 4
Strategic Asset Management Plan Methodology. 4
What does it Cost?. 5
What we will do. 5
The Next Steps. 7
2. ASSET
MANAGEMENT STRATEGY. 8
2.1 Asset
Management System.. 8
2.2 Council
Assets (General Fund) 10
2.3 Our Assets
and their management 12
2.4 Where does
Council want to be?. 23
2.5 How will
Council get there?. 24
2.6 Consequences
if actions are not completed. 25
3. LEVELS OF
SERVICE. 26
3.1 Consumer
Research and Expectations. 26
3.2 Legislative
Requirements. 31
3.3 Defining
Levels of Service. 31
4. FUTURE DEMAND. 33
4.1 Demand
Drivers. 35
4.2 Demand
Impact on Assets. 36
4.3 Demand
Management Plan. 37
4.4 Asset
Programs required to meet Demand. 37
5. LIFECYCLE
MANAGEMENT PLAN.. 39
5.1 Asset Risk
Management Plan. 39
5.2 Asset
Operations and Maintenance Plan. 40
5.3 Asset
Renewal Plan. 41
5.4 New Asset
Creation/Acquisition/Upgrade Plan. 44
5.5 Asset
Disposal Plan. 45
6. FINANCIAL
SUMMARY. 45
6.1 Financial
Indicators and Projections. 45
6.2 Funding
Strategy. 46
6.3 Valuation
Forecasts. 46
6.4 Key
Assumptions made in Financial Forecasts. 48
6.5 Forecast
Reliability and Confidence. 48
7. PLAN
IMPROVEMENT AND MONITORING.. 50
7.1 Improvement
Goals and Strategic Tasks. 50
7.2 Monitoring
and Review Procedures. 56
7.3 Performance
Measures. 56
8. REFERENCES. 57
9. APPENDICES. 58
Appendix A - Asset Management Policy. 59
Appendix B – Long Term Financial Modelling Figures. 65
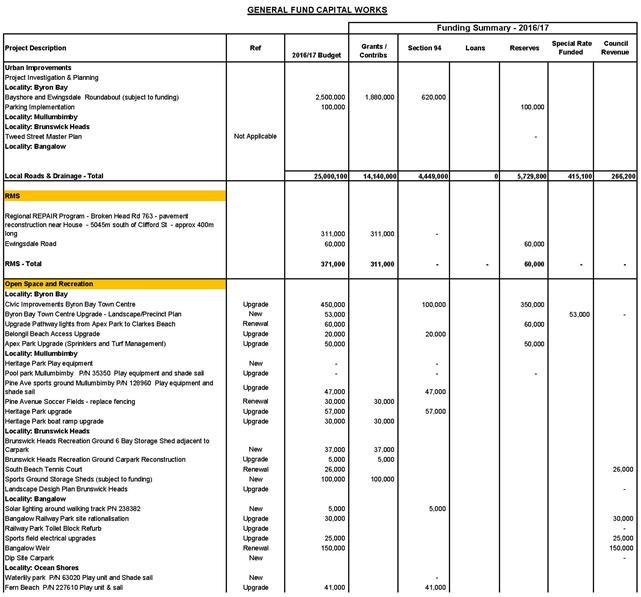
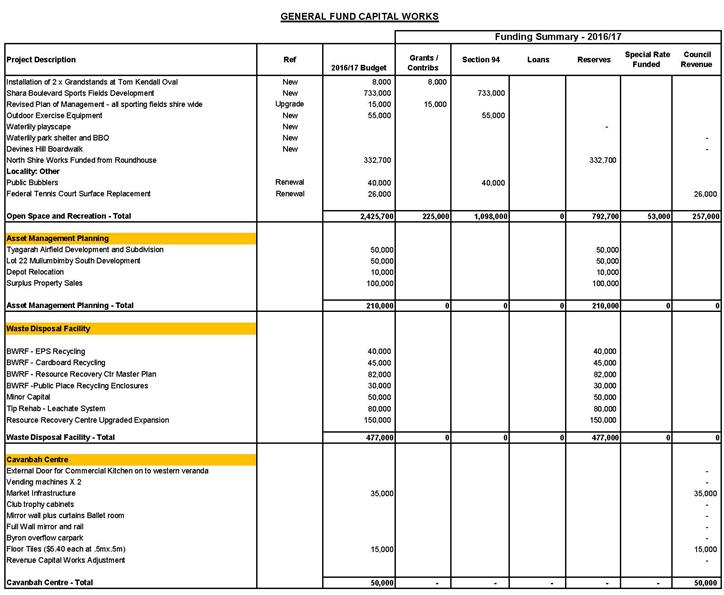
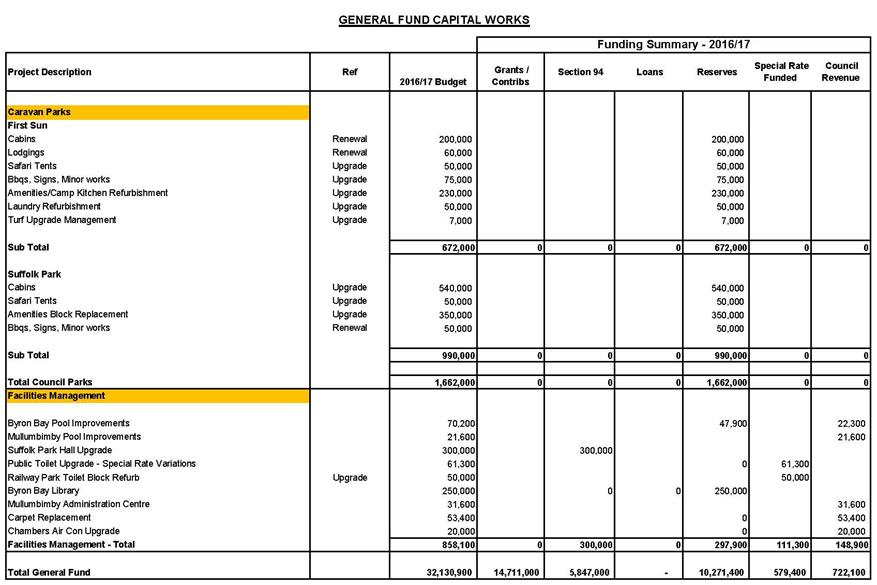
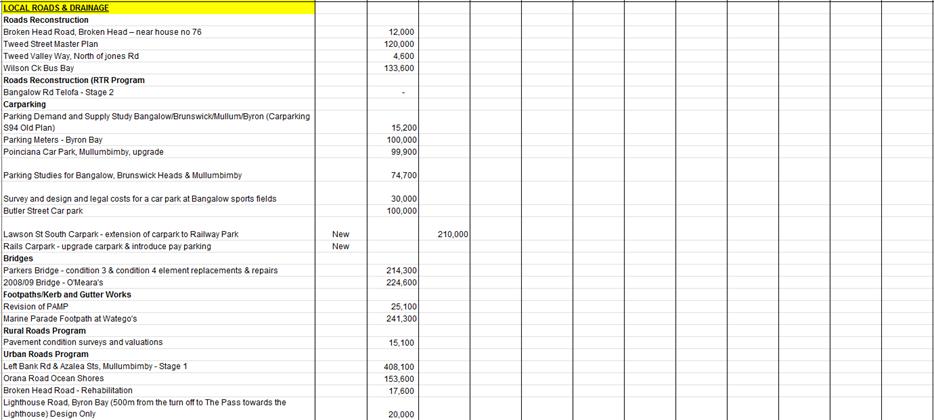
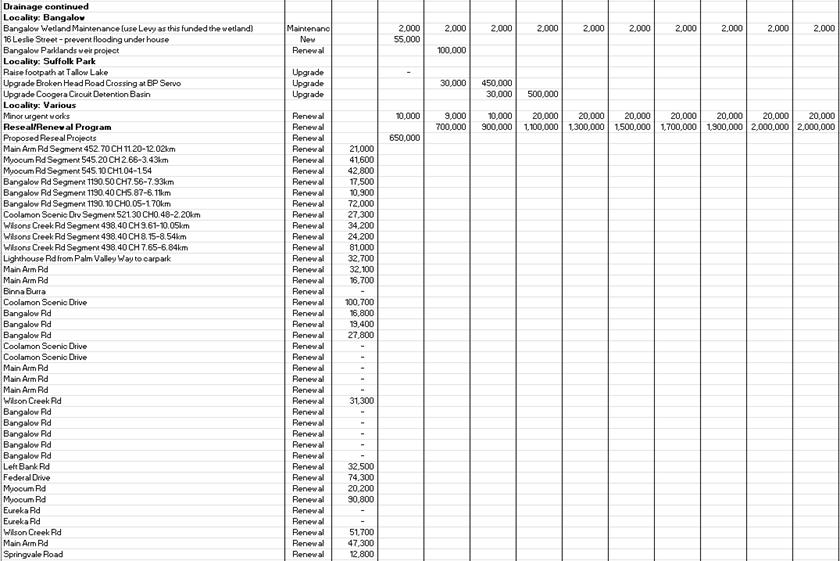
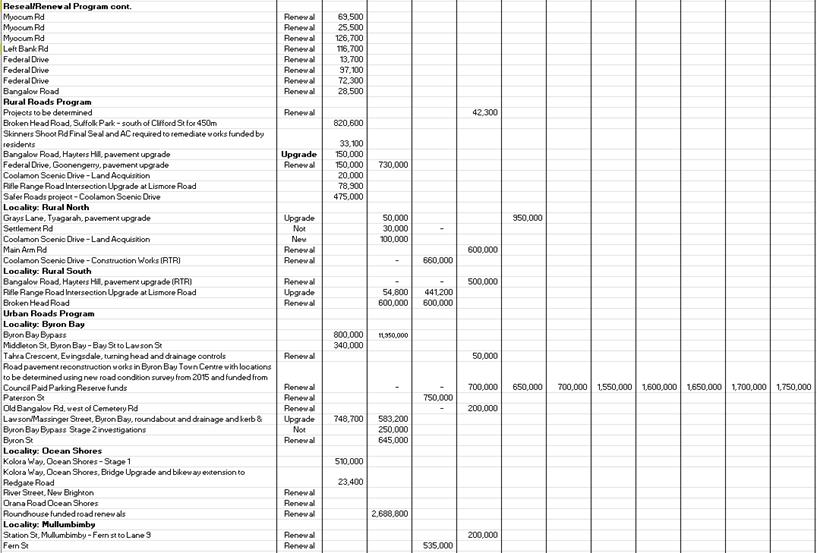
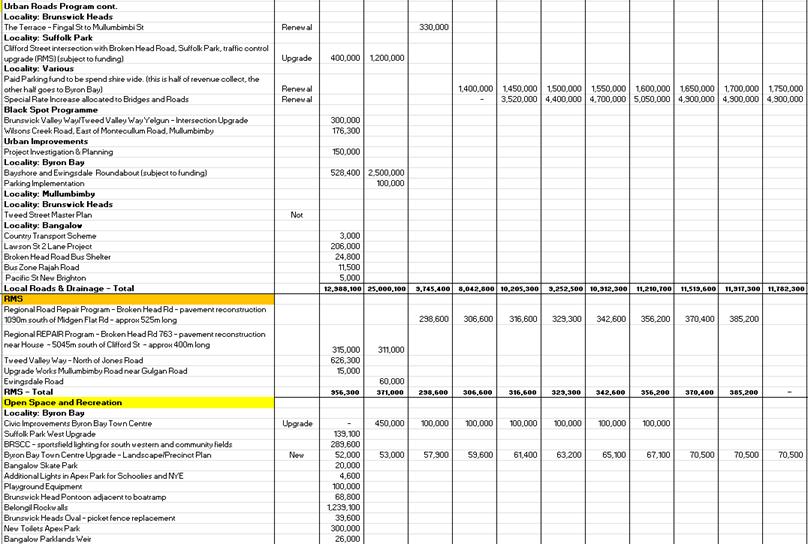
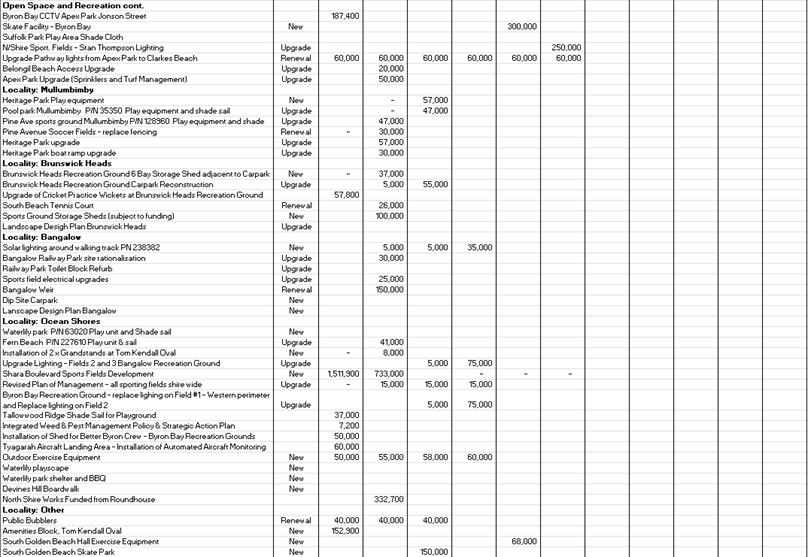
Appendix C - Adopted works program 2016/17. 66
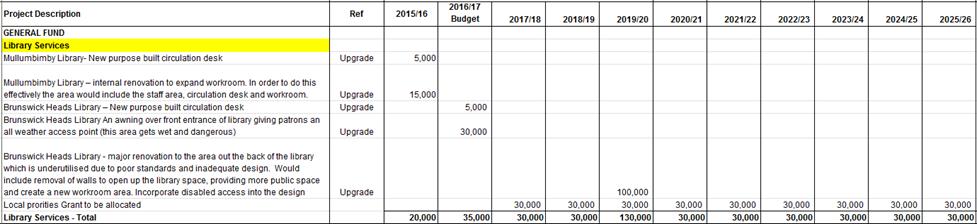
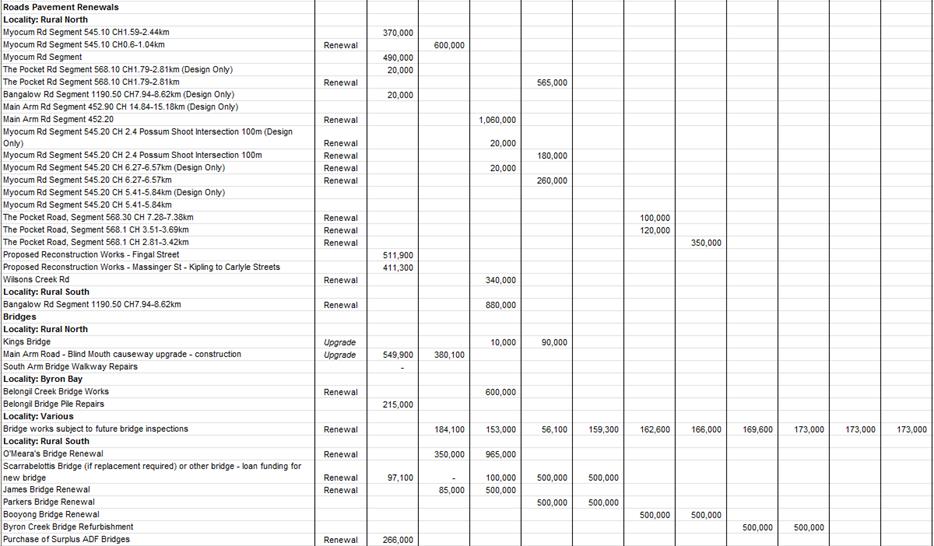
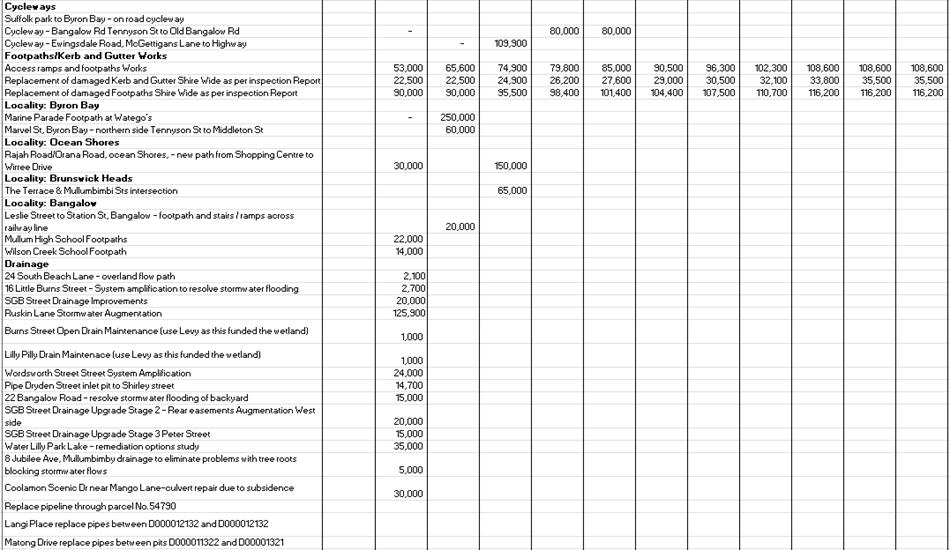
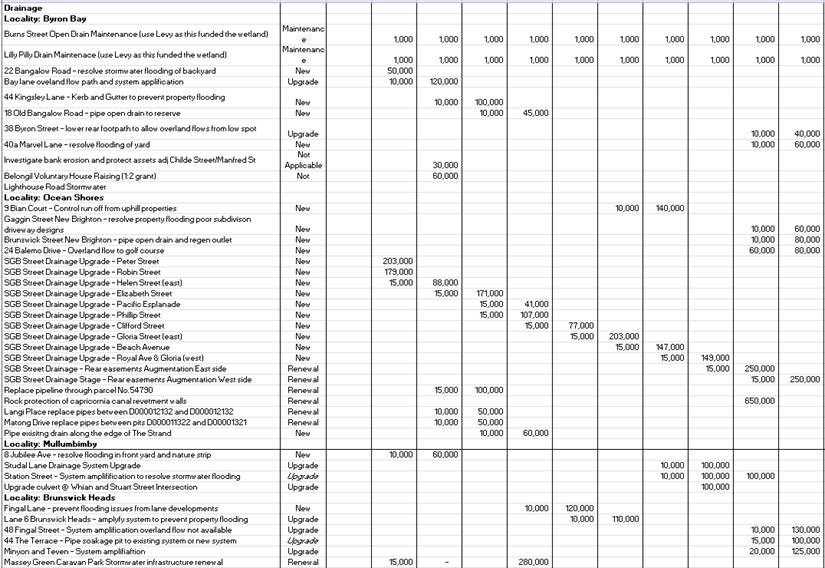
Appendix D - Projected 10 Year Capital New / Renewal / Upgrade
Program.. 71
Appendix E - Community Strategic Plan (CSP) Priority Areas and
Organisational Objectives. 83
Appendix F - Legislative Requirements. 87
Appendix G - 2015 NSW Local Government Audit Preparedness
Assessment 90
Appendix H - 2013 Maturity Assessment 95
APPENDIX I - Byron Shire Council Financial Statements 30 June
2016 Note 9a. 96
APPENDIX J - Byron Shire Council Financial Statements 30 June
2016 – Special Schedule No. 7. 97
Appendix K - Methodology Report for NSW Speical Schedule No. 7
Financial Reporting. 100
Appendix L - Glossary. 106
13.2
- Attachment 3
TABLES
Table 1 Assets covered by this plan. 10
Table 2 Assets - Note 9a as at 30 June 2016 Financial Statements. 12
Table 3 Condition Grading Model 15
Table 4 Asset Life Cycle Costs. 16
Table 5 Service consequence and risks. 19
Table 6 Key Asset Management Strategies. 24
Table 7 Community Satisfaction – Summary of Key Outcomes. 28
Table 8 Growth Projections. 34
Table 9 Demand Drivers, Projections and Impact on Services. 36
Table 10 Demand Management Plan Summary. 37
Table 11 Critical Risks and Treatment Plans. 39
Table 12 Cost to Bring to Satisfactory Summary (Appendix K -
Table 4) 43
Table 13 Key Assumptions made in AM Plan and Risks of Change. 48
Table 14 Data Confidence Assessment for Strategic Asset
Management Plan. 49
Table 15 Improvement Goals. 50
FIGURES
Figure 1 Integrate Planning & Reporting Framework. 4
Figure 2 Asset Management Elements. 9
Figure 3 Straight line depreciation (constant consumption of
asset service potential) 13
Figure 4 Assets at Fair Value of assets as per Table 2. 13
Figure 5 Condition of Assets by Percentage. 14
Figure 6 Scenario 1 - Projected Operating and Capital
Expenditure (10yr Accumulated results) 17
Figure 7 Scenario 2 Projected Operating and Capital Expenditure
(10yr Accumulated Results) 18
Figure 8 Asset Maturity Assessment 22
Figure 9 Community Survey - Priority, Satisfaction and
Investment 27
Figure 10 Community Survey - Priority vs Satisfaction. 28
Figure 11 Community Survey - Overall Satisfaction with
Council’s Performance. 29
Figure 12 Summary of Expenditure Prioritising. 30
Figure 13 Residential migration change. 34
Figure 14 Estimated Residential Population and Population
Projections to 2036. 35
Figure 15 Byron Local Government Authority Visitor Numbers. 36
Figure 16 Scenario 1 Projected Depreciated Replacement Cost 47
Figure 17 Scenario 2 Projected Depreciated Replacement Cost 48
13.2
- Attachment 3
Byron Shire is located in the north east of New South
Wales. It covers 566 square kilometres and adjoins Tweed, Lismore and Ballina
Shires. Brisbane is approximately 200km north and Sydney approximately 800km to
the south. It consists of 39km of coastline and is famed for its rural beauty
and beaches. The total infrastructure portfolio totals $565,100 million (as of
1 July 2016 not including water and sewer).
Roads are an important part of life in a rural area.
Council maintains a approximately 600km of sealed and unsealed roads. The high
levels of tourist traffic on local roads, coupled with an average 1960mm of
rainfall a year makes maintenance and repair that much more challenging.
Transport is a major issue for many in the shire.
Public transport is limited and most people rely on a vehicle or are restricted
in their access to essential services and educational facilities, which are
often located outside the Shire.
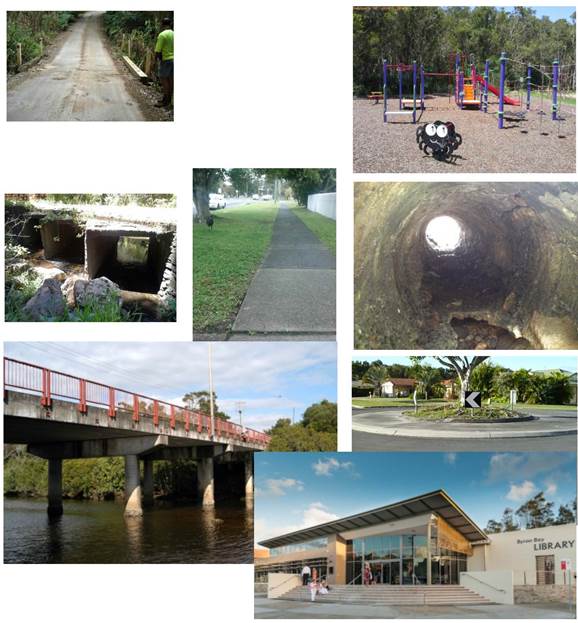
The Shire also has 30 bridges, 11 footbridges, 1308
rural pipe culverts, 85 causeways, 82 box culverts, urban drainage pipes
(104 km), 187 buildings, 4 cemeteries, 82km of footpaths/cycleways, 9 sports
fields, 112 parks, extensive park and sporting facilities.
The Community Strategic Plan’s (CSP) aim for ‘Community
Infrastructure Services’ is to sustain, connect and integrate communities and
the environment. It is essential that this Strategic Asset Management Plan
(SAMP) for general fund assets links to the CSP. This Strategic Asset
Management Plan (SAMP) has been developed in line with Council’s (Fit For the
Future) Improvement Plan submitted to the Independent Pricing and Regulatory
Tribunal (IPART) on the 30th June 2015. It has been further revised to align
with the 30th June 2016 Special Schedule 7 figures and reflects the
2016 program of consultation with the community on a proposed special rate
variation application.
SHIRE POPULATION
Population 29,209 2011 census (32, 119 ABS ERP 2014)
Distribution:
• 31.5% rural
• 16.7% Ocean Shores
• 17% Byron Bay
• 11.9 % Suffolk Park
• 10.9 % Mullumbimby
• 5.6% Brunswick Heads
• 6.5% Bangalow
POPULATION CHARACTERISTICS
• Median age: 42 years old
• 8.9% speak another language at home
• 39.0% are married, 13.96% de facto, 47.1% Not
Married
• 4.5% have a need for disability assistance
• 11.8% provided unpaid care to people with profound
or severe disabilities
• 26% of the Shire volunteer (over 15 years of age)
the state average is 16.9%
• 515 people are of Indigenous origin (1.8% of the
Shire)
EDUCATION
• 21.3% Bachelor Degree (higher than region 12.4% and
state 19.9)
• 10.0% Advanced Diploma (higher than region 7.1 and
State 8.3%)
• 19% have vocational training
INCOME
• Average individual gross weekly income $477 ($561
state)
• Average household gross weekly income $1,053 ($1,477
state)
HOUSEHOLDS
• 12, 405 households
• 75.2% are family households; 24.8% are lone
households
• 77.8% live in houses (not flats or semi-detached)
• 58.7% own or are purchasing a dwelling (paying
$1,684/ month towards a mortgage – lower than state average) (2011 Census)
• 30.5% rent (paying $350 per week on average (2011
census) higher than state average of $300)
• Median house price at June 2014 $645,242 ($136,309
.> State)
• 73.5% of households have an internet connection in
2011(66.3% have broadband)
• 84.7% own one or more cars in 2011
EMPLOYMENT (people 15 years
and over)
• 52.99% over 15 years had employment in 2011
• Proportion of full time workers to total workers
42.3% (lower than region 56.7% and state 56.5%) in 2011
• Average individual gross weekly income $477 ($561
state)
• Average household gross weekly income $1,053 ($1,477
state)
• 77% of workers live in the Shire; the balance live
outside the Shire; (20 % of working residents live in the area but work
outside) in 2011
• 62.8% use a car to get to work, with people walking
or cycling (2.9% compared to 0.8% for the State) to work higher than the region
& state
• 12.4% worked at home in 2011
• 11.5% did not go to work in 2011
ECONOMIC SYNOPSIS
• Business revenue estimated at $1.45billion (NIEIR
2014) from approximately 4,046 businesses (Business Register 2014)
• Tourist spending estimated in 2013/14 $416million
• 45.4% of businesses located in Byron Bay
• Key industries: Retail (13.7%), accommodation and
food (15.1%), health care and social assistance (9.6%), education and training
(6.8%), manufacturing (6.4%) and construction (11.2%) sectors are the principal
drivers of employment in the Shire in 2011.
CLIMATE
• Mean max temperature: 27.6 (summer), 19.3 (winter)
• Mean min temperature: 20.8 (summer), 11.7 (winter)
• Mean rainfall: highest 205.1mm, lowest 66.4mm
• Mean number of days of rain per month: highest 13.3,
lowest 6.5 days.
Byron Shire
Council is responsible for
the acquisition, operation, maintenance, renewal and disposal of an extensive
range of general fund assets with a written down value of $719.6 million as at 30 June 2016. These
assets (excluding Water & Sewerage assets) include:
|
Transport
|
Sealed Road Pavements
Unsealed
Road Pavements
Kerb and Gutter
Footpaths and cycleways
Bridges and Footbridges
Car parks
Roadside
furniture eg bus stops and seats etc
Roadside
Barriers
Retaining
Walls and Guardrails
|
|
Drainage
|
Rural Causeways and Box Culverts
Rural Pipe Culverts
Urban Stormwater Pipe
Urban
Drainage Pits eg Gross Pollutant Traps, & Headwalls
Retaining Basins
Urban Levee Walls
Bangalow Weir
|
|
Buildings
|
Community
Corporate
Recreational Buildings
Sport and Park Buildings
Public Toilets
|
|
Open Space and Recreation Facilities
|
Structures and park furniture
Sporting Facilities
Swimming Pools
Land Improvements
|
|
Plant & Equipment
|
Vehicles and Plant
Small
Plant equipment
|
|
Furniture & Fittings
|
Office furniture and equipment
|
Our assets
contribute significantly to the provision of services essential to the community’s quality of life.
Population
growth, tourist impacts, high rainfall, rising customer expectations, competing
demands for funding and a rigorous regulatory environment combine to create
circumstances where it is essential that Council is in the position to
make well-informed asset management decisions. These decisions involve setting
and delivering service levels, costs and priorities, and
have far-reaching social, environmental and financial implications for the
community.
A range of
circumstances, including under investment, has resulted in many assets being in
poor condition. There is a backlog of unfunded renewals of high risk assets.
Council is addressing this situation and is committed to achieving the
sustainable management of our assets as detailed in this Strategic Asset Management Plan (SAMP).
Byron Shire has a
comparatively high level of tourism with 3,769 average nightly tourists and average
daily traffic (AADT) counts into Byron Bay town of 21,001 (AADT 6 October 2016
Metro counts). Tourism visitation creates a significant additional load on
community assets and has contributed to the generally deteriorated state of
assets and the asset renewal backlog. A comprehensive strategy to progressively
address this impact, particularly on the transport infrastructure, is detailed in funding Scenario 2 of
this document.
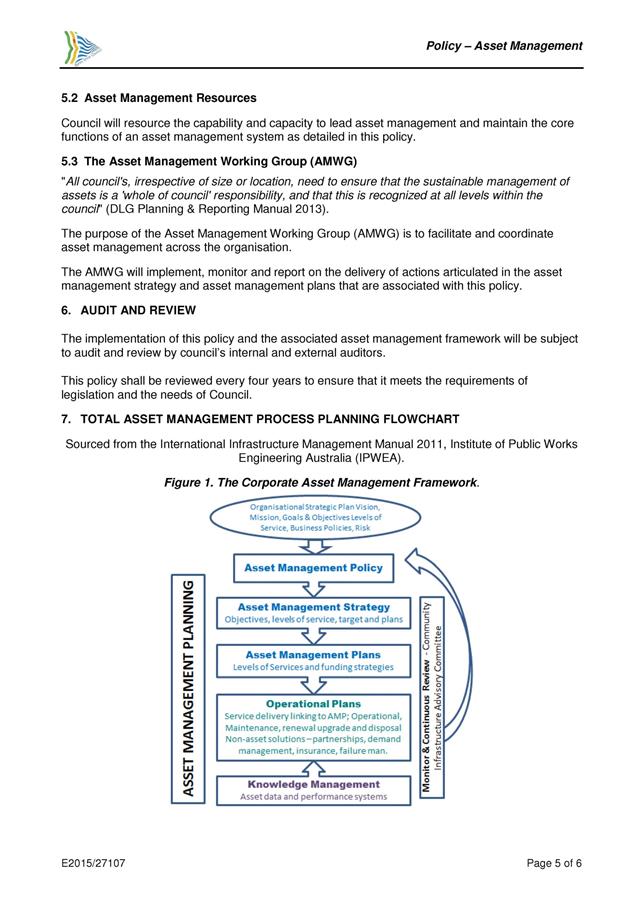
This SAMP
takes the organisational outcomes in our Community Strategic
Plan, and develops the asset management objectives, principles, framework and strategies required to achieve our
organisational outcomes (Figure 1). The SAMP
summarises activities and
expenditure projections to achieve the overall
asset management objectives.
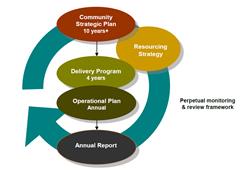
Figure 1 Integrate Planning &
Reporting Framework
The purpose of the SAMP
is to describe how Council will meet its commitment to asset management as
documented in the Asset Management Policy (Appendix A). It will achieve this by
developing a structured set of Strategic Actions aimed at enabling Council to
improve its asset management practices and service delivery needs.
Our aim is
to achieve a ‘core’ maturity in
accordance with the International Infrastructure Management Manual for asset management activities and
continue maturity improvement where the benefits exceed the costs. Improvement
tasks with costs and target dates have been identified and documented in Section
7 of the Improvement Plan.
The SAMP pertains only
to general fund assets because water and sewerage assets are covered in
separate Strategic Business Plans developed under the guidelines provided by
the NSW Best Practice Management of Water Supply and Sewerage framework.
The SAMP has been
developed in line with Council’s Fit For the Future report submitted to the
Independent Pricing and Regulatory Tribunal (IPART) on the 30th June
2015. The SAMP contains two scenarios as outlined below.
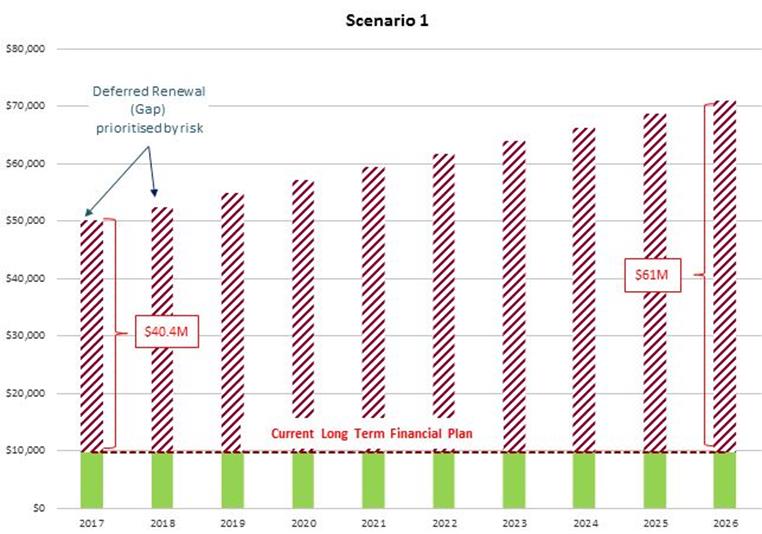
Scenario 1 represents council’s current funded position with
respect to the management of physical assets. Scenario 1 compares council’s
average annual asset consumption, accumulated high risk assets (renewal
Backlog) and additional operations and maintenance to control high risk assets
against council’s Long Term Financial Plan (LTFP). This scenario is not
financially sustainable in the long term. Scenario 1 expected outcomes are:
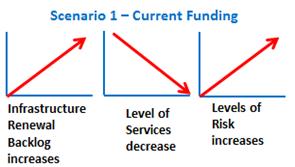
Under Scenario 1 the
condition of assets will continue to “Significantly decline and fail” as
detailed in the community consultation phase for the Special Rate Variation
2016.
Scenario 2 considers the accumulated consequences of additional
revenue to address council’s unfunded high risk assets (renewal Backlog)
including the additional operations and maintenance to manage these risks.
Scenario 2 has been developed based on Council’s fit for the future application
and includes additional revenues from a number of sources including:
· Paid Parking
· Land Sales
· Efficiency Savings
· Special Rate variation options
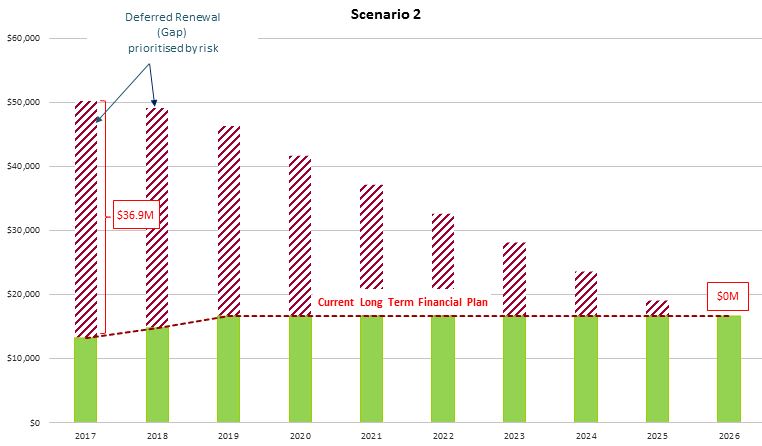
Scenario 2 seeks to
address the long term sustainability of Council and achieve the required NSW
Fit For the Future infrastructure investment measures. The main focus of the
expenditure of the additional revenue associated with Scenario 2 is on the
renewal of backlog roads and bridges. The expected outcomes are:
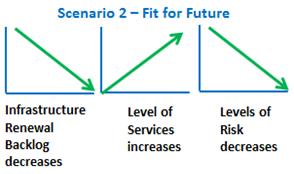
Under Scenario 2, with a
special rate variation of 10% Council will be able to address the increasing rate
of asset deterioration and “Maintain” the condition of our community assets in
a sustainable manner as detailed in the community consultation phase for the
Special Rate Variation 2016.
Scenario 1 is a
reflection of the actual funding available. The difference between Scenario 1
and Scenario 2 represents “what needs to be done”. The discussion about this
“gap” will lead us into a much better informed community discussion about what
are achievable and acceptable service levels, as well as giving a focus on
managing risk.
The forecast of the
projected outlays necessary to provide the services covered by this SAMP includes
operations, maintenance, and capital renewal of existing assets. Over the 10
year planning period the projected outlays is $158.5M or $15.8M on average per
year (Refer to Appendix B).
Estimated available
funding (Scenario 1) for this period is $97.3M or $9.7M on average per year
(Refer to Appendix B) which is 61% of the cost to provide the service. This is
a funding shortfall of -$6.1M on average per year and is predominantly
associated with roads and bridges (Table 4). This modelling includes renewal
backlog, which was reported at $38M as at 30th June 2016 (Appendix
J).
For Scenario 1 the
required expenditure exceeds the current budget allocations. The funding gap is
expected to increase from $40.4M to $61M by 2027 (Figure 9). This modelling can be compared to Scenario
2 which shows that the estimated available funding including additional revenue
for the same period is $160M or $16M on average (Appendix B) per year which
is 101% of the cost to provide the service. This is a
funding excess of-$200,000 on average per year which will provide a buffer for unidentified high
risk maintenance that is inevitable with increased asset condition assessments. This
funding does not include a provision for additional Capital Upgrade or Enhancement.
Under Scenario 2 the
additional revenues will allow council to gradually address the existing renewal
backlog and achieve a balanced position by 2027 (Figure 10). The focus of the
allocation of the additional funds is on renewals. Any diversion of available
funds to new assets will delay the recovery and achievement of a sustainable
asset renewal position.
Council has sort to be responsive
to customer requests but has been constrained by funding availability. A shift
towards a strategic approach to effective asset management provides better
accountability, sustainability, risk management, service management and
financial efficiency.
Our aim is
to provide the services needed by the community in a financially
sustainable manner. Achieving financial sustainability will require additional funding for infrastructure
whilst balancing service
levels and performance with cost and risk.
Council will continue to
improve and build its asset management capacity and capability. It may not be possible to meet all
expectations for services within current financial resources. We will continue
to work with our community to sustainably
provided needed services at
appropriate levels of service and at an affordable cost while managing
risks.
Challenges
that cannot be funded at this Stage
Implementation of
Scenario 2 and the associated additional revenue, will in part address some of
the following unfunded challenges, particularly as they pertain to roads and
bridges. However, the renewal of all poor condition assets that are not of high
risk would require significant further funding.
· Addressing the gradual decline in levels of service for roads which
will result in ongoing increases in operational and renewal costs. This situation requires continued
monitoring as the costs associated with this work and the risks to the network
are high.
· As at June 2016, 5 bridges are described as Condition 4 and 5,
a precursor to urgent risk management works and or further load limit reduction
or perhaps being closed. As at June 2016, there were 6 road bridges with
load limits. Funding constraints over the last decade has meant the backlog of
maintenance, repair and renewal tasks is substantial..
· Renewing the extensive amount of kerb and gutter that is in poor
condition but not presenting a high risk.
· Meeting all community aspirations for new and additional infrastructure
before Council has progressively addressed the renewal of high risk and failing
existing assets. This would include new assets such as cycleways.
· Renewing extensive sections of poor condition footpaths or the
construction of new footpaths before managing and renewing high risk failing
footpath sections.
· Meet all community and customer expectations for level of service and
asset performance.
To maintain
the delivery of services with deteriorating assets and increasing loads in a
constrained budgetary environment, council must continue to develop and
implement a strategic asset management program to ensure Council can
effectively address asset reinvestment needs, minimize risk, and maintain
long-term financial stability.
Managing the Risks
There are increasing risks to infrastructure associated with providing the service and
not being able to fund and complete the necessary maintenance and renewal. These risks must be managed. The
major risks are:
· Road
reseals not completed when needed resulting in water damage to the underlying
pavement.
· Significant
sections of roads that are so damaged they cannot be resealed and need costly
reconstruction. Typically costs for capital renewal ranges from $50 for heavy
patching to $100 per sqm for full depth reconstruction compared with reseal
costs of approximately $8 per sqm. This alone represents a significant
financial risk to the council.
· Limited
stormwater and road side maintenance in rural areas to reduce the risk of road
failure and landslides in our high rainfall environment.
· Potential bridge or bridge component
failure, most notably the timber bridges
and footbridges.
· Damaged
footpaths with the potential to cause trips and falls in high pedestrian
areas.
· Pavement
damage due to water penetration caused by failed kerb and gutter.
· Aging box
culverts and causeways requiring major replacement or repair.
· Load limiting of
bridges, causeways and box culverts.
· Replacing or
installing guardrail to comply to Austroads standards
Council will endeavour to manage these risks
within available funding by implementation
of asset management systems and inspection regimes, to provide a sound platform for understanding the condition, maintenance and replacement schedule for all assets.
The key actions
associated with implementing this strategic
asset management plan include:
· Engagement and consultation with the community on the
need for increased revenue associated with Scenario 2 of Council’s (Fit For the Future) Improvement Plan.
· Continue to engage with our community on
service levels, risk management and renewal of assets in order to set
priorities and allocate resources.
· Improving asset knowledge so that data accurately
records the asset inventory, how assets are performing and when assets are not
able to provide the required service levels.
· Improving our efficiency in operating, maintaining,
renewing and replacing existing assets to optimise life cycle costs.
· Identifying and managing risks associated with
providing services from assets.
· Making trade-offs between service levels and costs to
ensure that the community receives the best return from assets.
· Identifying assets surplus to needs for disposal to
make savings in future operations and maintenance costs e.g. secondary laneway
access to private properties.
· Developing partnerships with other bodies to provide
services.
· Seeking additional funding from governments and other
bodies to better reflect a ‘whole of government’ funding approach to asset
intensive services.
· Carefully evaluate the long term affordability of new
assets to include whole of life costs before construction to ensure maintenance
and capital renewal funding is available in the future budgets.
.
13.2
- Attachment 3
Asset management
enables an organisation to realise value from assets in the achievement of
organisational outcomes, while balancing financial, environmental and social
costs, risk, quality of service and performance related to assets.
An asset management
system is a set of interrelated and interacting elements of an organisation that
work together to establish the asset management policy, asset management
outcomes, and the processes needed to achieve those outcomes. An asset
management system is more than a ‘management information system’. The asset
management system provides a means for coordinating contributions from and
interactions between functional units within an organisation.
The asset management
system includes:
· The asset management policy
· The asset management outcomes
· The strategic asset management plan
· The individual asset management plans (to be developed), which are
implemented in
o Operational planning and control
o Supporting activities
o Control activities
o Other relevant processes.
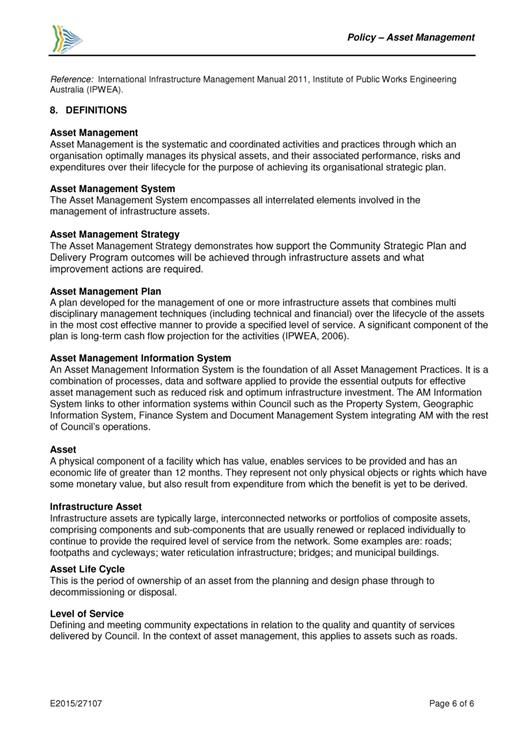
One of
the key elements of Council’s asset management improvement is the development and use of high-quality information. Consequently, the integrated information systems that store and report the data will need to be continuously improved to meet the needs of the strategy. This process is shown in Figure 2 – Asset Management
Elements.
As Council seeks
higher performance from its assets, a comprehensive dataset is a vital element
and a key measure of overall maturity. Council’s data improvement plan will
focus on a cycle of continual progress toward two major goals:
· Improve data acquisition and validation (Inspections & Defects –
Reflect™ Figure 2)
· Provide better support for decision-making (Predictive Modelling -
Figure 2)
Council will bring
asset data metrics into alignment with funding priorities that are expressed in
this SAMP, and ultimately determine funding allocations more strategically
based on asset needs and risk mitigation efforts.
The improvement plan
will leverage Council’s existing Asset Management Elements (Figure 2). The data
improvement will seek to define the roles that each of these systems play in
maintaining asset data and providing information to support the asset
management program, provide reporting and metrics for decision making and
support the lifecycle management of the Council’s assets.
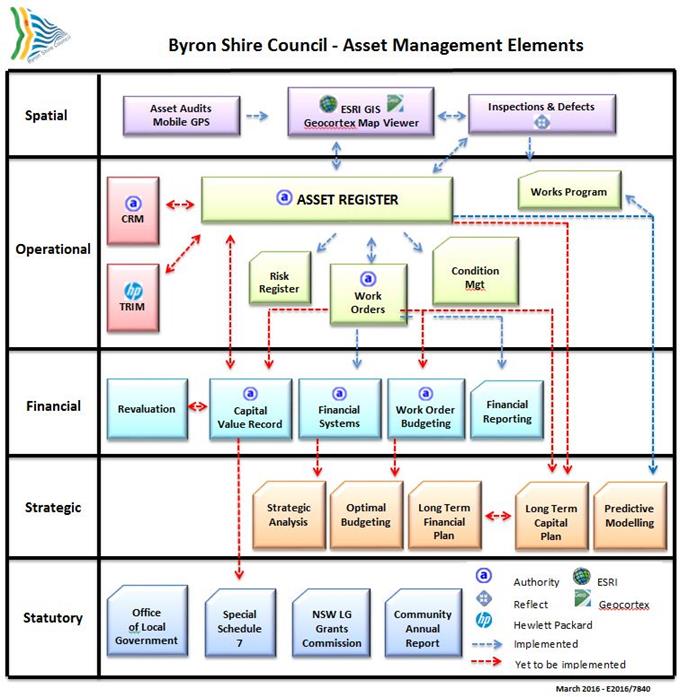
Figure 2 Asset Management Elements
The asset management
policy sets out the principles by which the organisation intends applying asset
management to achieve its organisational outcomes detailed in the Community
Strategic Plan. Our adopted asset management policy is attached as Appendix A.
The asset management
objectives provide the essential link between the organisational outcomes and
the individual asset management plans that describe how those outcomes are
going to be achieved. Asset management objectives should be specific,
measureable, achievable, realistic and time bound (i.e. SMART objectives).
This
strategic asset management plan covers
the major general fund asset
categories. It includes analysis at sub-category asset level. The purpose is to
document the relationship between the organisational outcomes set out in the
Community Strategic Plan, Resourcing Strategy, Delivery Program, and the asset
management (or service) objectives and define the strategic framework required
to achieve the asset management objectives (Refer to Figure 1 – IP&R).
The asset management
framework incorporates strategies to achieve the asset management objectives.
The strategies are developed in 4 steps:
· What assets does Council have? (section 2.2)
· Our assets and their management (section 2.3)
· Where does Council want to be? (section 2.4)
· How will Council get there?
(section 2.5)
Council manages a
lot of assets to provide services to our community. The assets provide the
foundation for the community to carry out its everyday activities, while
contributing to overall quality of life (Table 1). The SAMP focusses only on
general fund assets because water and sewerage assets are assessed in separate
Strategic Business Plans developed under the guidelines provided by the NSW
Best Practice Management of Water Supply and Sewerage framework.
Table 1 Assets covered by this plan
|
Asset Class
|
Description
|
Services Provided
|
|
Transport
|
Sealed Road Pavements
Unsealed
Road Pavements
Kerb and Gutter
Footpath and cycleways
Bridges and Footbridges
Carparks
Roadside
furniture eg bus stops
Retaining
Walls
Guardrails/Roadside
Barriers
|
The continued provision of
roads, footpaths and bridges in the Byron Shire Local Government Area at the
highest level acceptable by the community and in compliance with the
standards, specifications and legislations
|
|
Drainage
|
Causeways and Box Culverts
Rural Pipe Culverts
Urban Stormwater Pipe
Urban Drainage Pits eg Gross
Pollutant Traps, and Headwalls etc
Retaining Basins
Urban Levee Walls
Bangalow Weir
|
The continued provision of
storm water drainage surfaces, waste transportation, GPTs and water drainage
networks and systems to the Byron Shire Local Government Area at the highest
level acceptable by the community and in compliance with the standards,
specifications and legislations.
|
|
Buildings
|
Buildings _ Community
Buildings – Corporate
Recreational Buildings
Public Amenities
Sport and Park Buildings
|
The continued provision of
community centres, sporting amenities and administrative centres to the Byron
Shire Local Government Area at the highest level acceptable by the community
and in compliance with the standards, specifications and legislations.
|
|
Open Space and Recreation Facilities
|
Structures and park furniture
Sporting Facilities
Land Improvements – Depreciable
Swimming
Pools
|
The continued provision of
parks and sporting grounds to the Byron Shire Local Government Area at the
highest level acceptable by the community and in compliance with the
standards, specifications and legislations.
|
|
Plant & Equipment
|
Vehicles and Plant
Small
Plant equipment
|
Provision of vehicles and
major and minor plant to ensure the ongoing operations and maintenance of
Council’s services and assets.
|
|
Furniture & Fittings
|
Office furniture and equipment
|
Provision of suitable work
environments to ensure the ongoing operations of Council’s services.
|
The value of
physical assets covered by
this strategic asset management plan is shown in Table 2 and Figure 4. These assets are used to provide infrastructure services to the community. This information is from the Annual Financial Reporting - Note 9a
(Appendix I) however; it does not include Water, Sewer, Tip and Quarry Assets. The
depreciation methodology is presented in Figure 3.
Table 2 Assets - Note 9a as at 30
June 2016 Financial Statements
|
Byron
LGA - Note 9a
|
As at 30/6/2016
|
|
$'000
|
Fair Value
|
Carrying Value
|
Annual Depreciation Expense
|
|
Capital works In progress
|
$0
|
$0
|
$8,132
|
|
Plant & Equipment
|
$12,505
|
$5,037
|
$1,045
|
|
Office Equipment
|
$3,018
|
$599
|
$220
|
|
Furniture & Fittings
|
$296
|
$118
|
$12
|
|
Land – Operational land
|
$85,544
|
$85,544
|
$0
|
|
Land – Community Land
|
$88,832
|
$88,832
|
$0
|
|
Land under roads (post
30/6/08)
|
$6,403
|
$6,403
|
$0
|
|
Land Improvements - non
Depreciable
|
$80
|
$80
|
$0
|
|
Land Improvements -
Depreciable
|
$4,723
|
$2,391
|
$159
|
|
Buildings
|
$73,243
|
$63,330
|
$769
|
|
Other Structures
|
$2,390
|
$2,075
|
$19
|
|
Roads
|
$291,332
|
$157,197
|
$4,927
|
|
Bulk Earthworks
|
$28,999
|
$28,999
|
$0
|
|
Bridges
|
$23,909
|
$13,122
|
$293
|
|
Footpaths and cycleways
|
$7,769
|
$4,771
|
$126
|
|
Stormwater Drainage
|
$62,087
|
$45,733
|
$574
|
|
Swimming Pools
|
$2,800
|
$2,247
|
$58
|
|
Other Open
Space/Recreational Assets
|
$14,144
|
$9,870
|
$266
|
|
Other Assets
|
$3,409
|
$1,966
|
$249
|
|
TOTAL
|
$719,515
|
$518,314
|
$8,717
|
Figure 3 Straight line depreciation
(constant consumption of asset service potential)
Notes
1. Carrying Value is the same as Depreciated Replacement Cost and
Written Down Value (WDV).
2. Residual values have not been applied.
Figure 4 Assets at Fair Value of
assets as per Table 2
13.2
- Attachment 3
Table 3 Condition Grading Model
|
Condition
Grading
|
Description of Condition
|
|
1
|
Excellent: Asset in excellent condition. No
maintenance required.
|
|
2
|
Good: Asset is in good condition with limited signs
of wear. Only requires cyclic maintenance and is not requiring special
attention.
|
|
3
|
Fair: Asset is in useable condition with extensive
signs of wear. Asset requires some attention to prevent further
deterioration and to return it to a condition so that it requires only cyclic
maintenance.
|
|
4
|
Poor: Asset is in poor condition or is faulty. It
needs urgent attention to return it to a useable condition and or significant
renewal/rehabilitation is required to reduce risk.
|
|
5
|
Very Poor: Asset has failed or is at the end of its
life or is physically unsound or poses significant risk. It requires
replacement and is beyond rehabilitation.
|
The assets that were
assessed as condition 4 and 5 and considered high risk were included in the For
the Fit for Future Bring to Satisfactory Capital Renewal backlog. Refer to
Special Schedule 7 – Infrastructure Report (Appendix J).
Life cycle costs (or whole of life costs) are the
average costs that are required to sustain the service levels over the longest
asset life. Life cycle costs include operating and maintenance expenditure and
asset consumption (depreciation expense). Life cycle costs can be compared to
lifecycle expenditure to give an indication of sustainability of service
provision.
Lifecycle
expenditures include operations and maintenance expenditures (excluding
depreciation) plus capital renewal expenditure. The capital renewal component
of lifecycle expenditure can vary depending upon the timing of asset renewals.
Scenario 1
The
life cycle cost for scenario 1 is $15.8M per year (average operations and
maintenance expenditure plus depreciation expense projected over 10 years,
refer to Table 4).
The life cycle costs
can be compared to life cycle expenditure to give an initial indicator of
affordability of projected service levels when considered with age profiles.
The life cycle expenditure over the 10 year planning period is $9.7M per year
(average operations and maintenance plus capital renewal budgeted expenditure
in LTFP over 10 years).
A shortfall between life
cycle costs and life cycle expenditure is the ‘life cycle gap’.
The life cycle gap for services covered by the SAMP under scenario 1 is -$6.1M per year. Life cycle expenditure is 61% of life cycle costs. Under this scenario the required level of asset
renewals cannot be funded. The renewal backlog will grow (Figure 6) and under Scenario 1 the condition of assets will continue
to “significantly decline and fail” as detailed in the community consultation
phase for the Special Rate Variation 2016. There
is no capacity for additional capital enhancement/ upgrade.
Scenario
2
The life cycle cost
for scenario 2 is $15.8M per year (average operations and maintenance
expenditure plus depreciation expense projected over 10 years with a special rate variation of 10%) refer to Table 4. The life cycle expenditure over
the 10 year planning period is $16M per year (average operations and
maintenance plus capital renewal budgeted expenditure in LTFP).
A difference between
life cycle cost and life cycle expenditure is the life cycle gap. The life
cycle outcome for scenario 2 is a surplus of $216,000
per year. Life cycle
expenditure is 101% of life cycle costs. Under Scenario 2, Council will be able to stop the
increasing rate of asset deterioration and “Maintain” the condition of our
community assets in a sustainable manner as detailed in the community
consultation phase for the Special Rate Variation 2016.
The small projected
surplus will provide a buffer for unidentified high risk maintenance that is
inevitable with increased asset condition assessments.
This scenario does
not allow for any additional Capital Enhancement/Upgrade.
These lifecycle
costs and expenditures for both scenario 1 and 2 are shown in comparison in
Table 4 below.
Table 4 Asset Life Cycle Costs
|
Life Cycle
Cost (long term)'($000)
|
Scenario 1
|
Scenario 2
|
|
($000’s)
|
($000’s)
|
|
Life Cycle Cost
(LLC)* (depreciation + ops. and maintenance expenditures – 10 year average)
|
$15,847
|
$15,847
|
|
Life Cycle Exp.
** (Capital renewal. + operations + maintenance expenditure 10 year average)
|
$9,733
|
$16,063
|
|
Life Cycle
Gap [Life Cycle
Expenditure - Life Cycle Cost [-ve = gap]
|
-$6,114
|
$216
|
|
Life Cycle
Sustainability Indicator Life Cycle Expenditure / Life Cycle Cost]
|
61%
|
101%
|
* Life Cycle Cost The average 10 years
projected requirements for operations and maintenance expenditure and the
depreciation expense.
**Life Cycle Expenditure The average 10 years
LTFP budget planned for operations, maintenance and capital renewal
expenditure.
Note: The focus of the allocation of the additional funds is
on renewals. Any diversion of available funds to new assets will delay the
recovery and achievement of a sustainable asset renewal position.
A key asset
management objective is to provide the services that the community needs at the
optimum lifecycle cost in a financially sustainable manner. Scenario 2, Figure
7 shows the projected operations, maintenance, and capital renewal expenditure
compared with financial outlays in the long-term financial plan.
13.2
- Attachment 3
The following table
provides a summary of service consequences and risks associated with the above
Scenario 1 modelling. Please note that the table does not include all major
asset classes and service areas. Work is continuing on determining current
service levels and associated risks and will be included in future updates of
the plan as detailed asset inspections are undertaken.
Table 5 Service consequence and
risks
|
|
|
|
Sealed Roads
|
|
Sealed road network
comprises 502km of roads made up of 409km rural and 187km urban. Overall 35%
of the network is in fair condition with 42% in poor condition. This is
expected to increase over the next ten years at current funding levels.
Council's 2015/16 maintenance budgets for Pothole/Edge Breaks is $1,132,619
and for Heavy Patching is $121,314. This budget level is insufficient for
Council to achieve the maintenance level targets and the funding requirement will increase as the roads deteriorate
unless renewals associated with Scenario 2 of Council’s (Fit For the Future)
Improvement Plan are implemented.
|
The financial impact of not
doing reseals on time means the pothole maintenance budget will continue to
be exhausted before the end of the financial year, as occurred in the first 6
months of 2014/2015. This puts pressure on moving money from other budgets
areas. Community Expectations and Technical Levels of Service regarding road
defects response times continue to remain outstanding by 60% and defined risk
based response times are not achieved. Road users continue to have traffic
issues associated with single lane widths requiring drivers to pull over to
pass on grass shoulders. The average width for Rural Minor roads is 5.08m
whilst Rural Access is 4.74m. In 2014, 16 crashes were associated with loose
gravel on rural high speed roads e.g. gravel on shoulders, potholes,
corrugations/roughness, slippery surfaces, flooding or other hazardous
features. In 2014, Rural Roads High speed resulted in 27 Injuries and 3
Fatalities. The majority into trees, 50% in overcast/raining conditions,
20/30 travelling > 100km/hr. Public Liability insurance claims continue to
trend upwards.
|
|
Bridges
|
|
Council has 30 road bridges
of which 5 are in a poor or very poor condition, six with mass load limits as
of June 2015. (Parkers, South Arm, O’Mearas, Scarrabelottis, James and
Booyong Bridges) In 2015/16 urgent works were conducted at 8 road bridges to
retain there interim operational status (Parkers, South Arm, O’Mearas (closed
after June 3rd flood), Scarrabelottis, James, Booyong, Byron Creek
and Thompson Bridges) Two footbridges are the subject of
investigation and design for significant rehabilitation works. More
challenges can be anticipated as the bridges are further reviewed. Funding
constraints over the last decade has meant the backlog of maintenance, repair
and renewal tasks is substantial.
|
Load limited bridges cause
the public and business both financial costs and inconvenience. Imposing load
limits and urgent risk management works is expensive and disruptive upon
Councils scheduled works programs. The current gap in necessary funding for
maintenance, repair and renewal means future load limiting and increased load
limiting on key bridges will occur unless renewals associated with Scenario 2
of Council’s (Fit For the Future) Improvement Plan are implemented. With
Scenario 2 Council intends to borrow $6million in loans over 3 consecutive
years to address the five condition 4 bridges (Parkers, O’Mearas,
Scarrabelottis, James and Booyong). Council has called tenders for pile
repairs and corrosion protection works at Belongil Creek Bridge, the primary
access to Byron Bay, estimated at $600K to prevent future load limit/closure
potential. Council has completed the
design for Blindmouth Creek Crossing replacement and when fully funded, it
will be replaced. Ideally Council would like to start planning to replace
South Arm Bridge and Byron Creek Bridge before they further deteriorate under
increasing traffic loadings.
|
|
Footpaths & Cycleways
|
|
There are 10.97km of Footpaths/cycleways in Condition 4 & 5. With 25.1km in condition 3 and 44.2km
in condition 1 & 2. Council has a comprehensive annual risk based
inspection program based off the Statewide Mutual
Best Practice Manual. These inspections identify our priority defects and
they are programed each year utilising the available 2015/16 Maintenance Budget of $ 31,000 and
the Capital Renewal budget of
$120,000. An additional $78,000 is allocated
specifically for upgrade and new Pedestrian Access &
Mobility Plan (as per the RMS State & Local Government partnership).
|
On average
Council has 600 High and Very High Risk Defects each year. Limited and
prioritized works often involve disposal of defective
assets and reconstruction of footpaths.
Approximately 30 defect sites are actioned out of the 600 each year.
As a result Insurance Claims may increase on footpaths and cycleways in coming years. The focus on addressing existing high
risk footpath defects will remain a strategic
priority under our risk based approach. There
remains a conflict with the aspiration to build new and additional footpaths
and cycleways before the backlog of defects and deteriorated infrastructure
is renewed.
|
|
Kerb & Gutter
|
|
Approximately 60% of the
kerb and gutter is in poor and very poor condition (based on sampling). Very
limited budget is allocated to the renewal of kerb and gutter.
|
The poor condition of kerb
and gutter does not lead to many high risk locations. The negative perception
of degraded assets presents an image risk particularly in high tourism areas.
Limited funds ($22,500 in 2016/17) must be prioritized on the renewal of high
risk assets first.
|
|
Car Parks
|
|
There is a
total of 16 council car parks (with an area
of 1.64M sqm). Council currently does
not have a separate budget for maintaining these assets into the future.
Urgent maintenance is carried out using funds from the general roads
maintenance budget.
|
Council is
yet to determine the whole of life costs to manage these assets into the future. There is a low to moderate public
liability issue associated with pedestrian pothole claims.
|
|
Causeways
|
|
Currently 78% of rural causeways
have been reassessed in 2016. The remaining causeways were assessed in 2011.
As it currently stands, 45% of causeways are in Poor condition, 40% in Fair
condition, and 15% in Good condition. Council is
continuing to complete the intensive assessment program on these assets. Due
to limited funds, little
maintenance or capital renewal work has been completed on these assets. Council’s condition assessments during 2016 are
revealing assets in Condition 4 and 5 that are beyond rehabilitation and
require extensive capital works. The scoping and prioritising of these
specific site works are underway. Challenges are faced to find funding in the
current budgets. Once all condition assessments are completed, a comprehensive Maintenance and Capital
Works Plan will be developed.
|
Since 2011 there has been a
decline in condition of these assets in terms of deterioration, settlement, undercutting, erosion,
scouring, sinkholes, cracking and blockage to the barrel,
headwalls, inlet/outlet, roadway and embankment. Probability and consequences
of poor and very poor asset failure could pose high social, environmental and
economic risks to the organisation.
Council has developed a risk matrix for this asset to indicate what assets
are regarded as high risk and to facilitate the
Capital Works Plan development. The Rural Drainage reported cost to bring
to satisfactory at the 30th June 2016 was $3,025,000. Current rural
drainage backlog maintenance costs as of 8/11/2016 was $735,002.
|
|
Stormwater Box Culverts
|
|
Currently 56% of rural box
culverts have been reassessed in 2016. The remaining box culverts were
assessed in 2011. As it currently stands, 7% of box culverts are in Poor
condition, 51% in Fair condition, and 42% in Good condition. Council is
continuing to complete the intensive assessment program on these assets. Due to
limited funds, little
maintenance or capital renewal work has been completed on these assets. Council’s condition assessments during 2016 are
revealing assets in Condition 4 and 5 that are beyond rehabilitation and
require extensive capital works. The scoping and prioritising of these
specific site works are underway. Challenges are faced to find funding in the
current budgets. Once all condition assessments are completed, a comprehensive Maintenance and Capital
Works Plan will be developed.
|
Since 2011 there has been a
decline in condition of these assets in terms of deterioration, settlement, undercutting, erosion,
scouring, sinkholes, cracking and blockage to the barrel,
headwalls, inlet/outlet, roadway and embankment. Probability and consequences
of poor and very poor asset failure could pose high social, environmental and
economic risks to the organisation.
Council has developed a risk matrix for this asset to indicate what assets
are regarded as high risk and to facilitate the Capital Works Plan
development. The Rural Drainage reported cost to bring to satisfactory at the
30th June 2016 was $3,025,000. Current rural drainage backlog
maintenance costs as at 8/11/2016 was $735,002.
|
The purpose of this strategic
asset management plan is to develop the strategies to achieve the asset
management outcome through balancing of asset service performance, cost and
risk.
Council will
continue to conduct asset inspections and improve its asset data and planning maturity.
Ongoing assessments and data improvements will lead to changes to the projected
asset renewal backlog. Due to this process it is important that the SAMP and
associated long term financial planning documentation are regularly updated.
Council has taken steps to
improve our asset and financial management performance including assessing our
asset management maturity against the Local Government Financial Sustainability
National Frameworks. The National Frameworks on Asset Planning and Management
and Financial Planning and Reporting define 10 elements. From these elements[7] eleven core
competencies have been developed to assess ‘core’ competency under the National
Frameworks.
An independent maturity review
against the above frameworks was undertaken by Jeff Roorda & Associates in
November 2013 (Appendix H). Council’s maturity assessment for the core competencies
is summarised in Figure 8. The current maturity level is shown by the blue
bars. The maturity gap to be overcome for Council to achieve a core financial
and asset management competency is shown by the red bars.
Figure 8 Asset Maturity Assessment
Following significant work over the last 3 years a core
level of maturity is now achievable within the next 12-18 months.
In
addition to the review against national frameworks, Council has also been
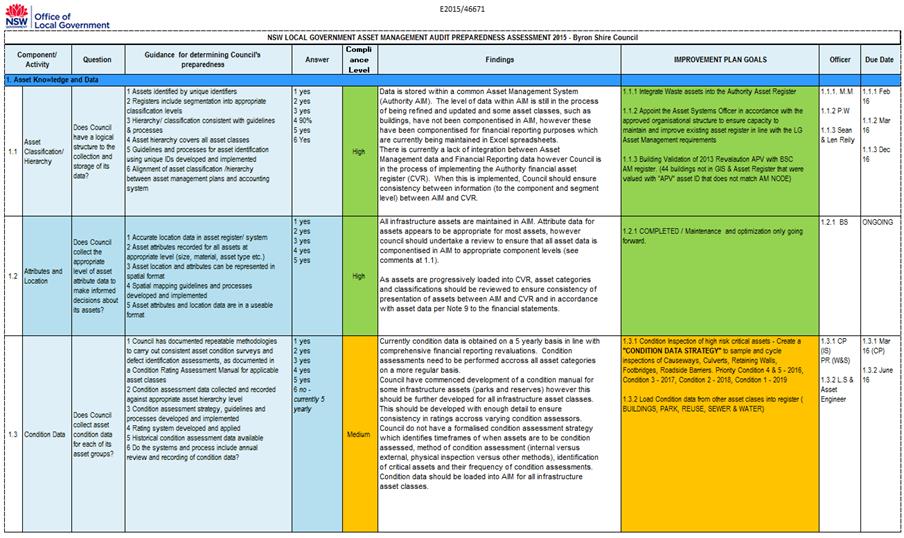
independently assessed under the NSW Local Government Asset Preparedness Audit.
Council
has an improvement plan in place for core competencies that align with the audit requirements
(Section 7.1).
The key actions
associated with implementing this strategic
asset management plan include:
· Engagement and consultation with the community on the
need for increased revenue associated with Scenario 2 of Council’s (Fit For the Future) Improvement Plan.
· Continue to engage with our community on service
levels, risk management and renewal of assets in order to set priorities and
allocate resources.
· Improving asset knowledge so that data accurately
records the asset inventory, how assets are performing and when assets are not
able to provide the required service levels.
· Improving our efficiency in operating, maintaining,
renewing and replacing existing assets to optimise life cycle costs.
· Identifying and managing risks associated with
providing services from assets,
· Making trade-offs between service levels and costs to
ensure that the community receives the best return from assets.
· Identifying assets surplus to needs for disposal to
make savings in future operations and maintenance costs eg. Secondary laneway
access to private properties.
· Developing partnerships with other bodies where
available to provide services.
· Seeking additional funding from governments and other
bodies to better reflect a ‘whole of government’ funding approach to asset
intensive services.
· Carefully evaluate the long term affordability of new
assets to include whole of life costs before construction to ensure maintenance
and capital renewal funding is available in the future budgets.
The
organisation exists to provide services to its community. Some of these
services are provided by infrastructure assets. Council routinely conducts Community Satisfaction Surveys and in 2016
completed a Community Asset Management Survey. These surveys clearly identify
community expectations and priorities (see section 3 – Levels of Service).
Physical assets
have variously been acquired by supply, by contract, constructed
by staff and via donation of assets constructed by developers and
others. The assets were created to variously
meet growth, maintain levels of service and in some cases increase levels of service.
Our goal
in managing these assets is to meet the defined level of
service (as amended from time to time) in the most cost effective manner for
present and future consumers. Community
engagement is necessary to ensure that informed decisions are made on future
levels of service and costs and that service and risk consequences are known
and accepted by stakeholders.
The Community
Strategic Plan (CSP) has been developed through engagement with the community.
The CSP sets out priorities for the community and desired outcomes. These
outcomes are dependent in many cases on infrastructure and the associated
management of assets. Council has adopted a Delivery Program to achieve these
outcomes.
This strategic asset
management plan is prepared under the direction of the Community Strategic
Plan.
Appendix E includes
a summary table of the Community Strategic Plan outcomes and associated
strategies.
To ensure the long-term financial sustainability of
the organisation, it is essential to balance the community’s expectations for
services with their ability to pay for the assets used to provide the services.
Maintenance of service levels for physical assets requires appropriate
investment over the whole of the asset life cycle. To assist in achieving this
balance, it aspires to: develop and maintain asset management governance,
skills, process, systems and data in order to provide the level of service the
community needs at present and in the future, in the most cost-effective and
fit for purpose manner.
In line with the vision, the outcomes of the
strategic asset management plan include:
· Community engagement on levels of
service and infrastructure priorities is supported and well informed.
· IP&R requirements are addressed in
accordance with the DLG Planning and Reporting Manual (2013) and asset
management is independently assessed as compliant.
· Asset management improvement actions are
identified, documented, monitored and reported to the community.
· Assets are managed in accordance with
relevant legislation eg POEO Act (1997).
· Assets are managed in accordance with
recognised best practise as detailed in the International Infrastructure
Management Manual (2015) and ISO 55001 for asset management systems.
· Future funding needs are identified and
allocated so that assets can meet their defined levels of service.
· A whole lifecycle approach is taken in
the development of operational, maintenance, acquisition, renewal, enhancement
and disposal investment strategies.
· Risk is considered in the development of
asset strategies and the impact of natural disasters on infrastructure and
services is addressed.
· Asset performance is measured against
defined levels of service and reported to the community.
· Assets are accounted in accordance with
the requirements of the appropriate asset accounting standards and reporting
requirements, including re-valuations.
· Core asset management capability is
achieved with progression to advanced asset management through continuous cycle
of review and improvement.
This strategic asset
management plan proposes the following key strategies to enable the
organisational outcome and asset management policies to be achieved.
Table 6
Key Asset Management Strategies
|
|
|
|
|
1
|
Target increased expenditure
on road reseals to minimize escalating cost of roads requiring
reconstruction.
|
Ensure lowest Lifecycle cost
service delivery
|
|
2
|
Ensure the asset inspection
regime is sufficiently resourced to identify key risks and prioritize the
deployment of available funds
|
Improved risk management of
unfunded high risk assets
|
|
3
|
Provide sufficient
information to support and justify grant applications for key infrastructure
works
|
Whole of government approach
to the management of the shire’s assets
|
|
4
|
Target increased expenditure
on road reconstruction to maintain levels of service and reduce the
escalating cost of reactive pot hole maintenance
|
Ensure lowest Lifecycle cost
service delivery
|
|
5
|
Ensure councils decisions
are made from accurate and current information in asset registers, on service
level performance and costs and ’whole of life’ costs.
|
Improved decision making and
greater value for money.
|
|
6
|
Report on our resources and
operational capability to deliver the services needed by the community in the
annual report.
|
Services delivery is matched
to available resources and operational capabilities.
|
Additional asset
management maturity actions are also included in the section 7.1 Improvement
program.
There are
consequences for the Council if the improvement actions are not completed.
These include:
· A continuation of the outcomes associated with Scenario 1 which include
an increase in infrastructure backlog, decreasing levels of service and
increased risk.
· Failure to achieve the outcomes of Scenario 2 which is to increase
revenue for highly targeted investment in assets to address the long term
sustainability of Council and achieve the required NSW Fit For the Future
infrastructure investment measures.
· Inability to achieve strategic and organisational outcomes
· Inability to achieve financial sustainability for the organisation’s
operations
· Current risks to service delivery are likely to eventuate and response
actions may not be appropriately managed
· Council may not be able to accommodate and/or manage changes in demand
for asset intensive services.
· Increased vulnerability to natural disasters through reduced access to
government funding
The expectations and requirements of various
stakeholders were considered in the preparation of this strategic asset
management plan. The following results have been extracted from Byron Shire
Council’s Community Asset Management Survey Report from September 2016
(E2016/85779).
The survey addressed the following 11 General Fund
asset areas:
1.  Urban Sealed Roads
2. Rural Sealed Roads
3. Unsealed Roads
4. Footpaths and cycleways
5. Bridges and footbridges
6. Bus Shelters
7. Urban Stormwater
8. Rural Drainage
9. Playgrounds and sports facilities
10. Public Amenities
11. Community Buildings
· Sealed Urban Roads 92%
· Public Toilets 82%
· Sealed Rural Roads 77%
· Highest Satisfaction – Community Buildings Mean Rating: 3.33
· Lowest Satisfaction – Urban Sealed Roads 2.13
The ‘position’ of the 11 asset areas that
residents were asked to rate as a priority, their satisfaction with these
areas, and the level of investment they feel should be applied is presented via three dimensional mapping in Figure 9. The
inputs in the map use the data from the recruitment survey.
Priority
is mapped on the vertical axis, and satisfaction is mapped on an ‘inverted’
horizontal axis – by ‘inverted’ we mean it runs from highest at left to lowest
at right. The size of the bubble indicates the level of investment that
residents would like spent in each area. This investment mean is also used to
colour code the measures into three investment groups:
• ‘Gold’ investment (significantly above the
average required investment)
• ‘Silver’ investment (within standard error
of the average required investment)
• ‘Bronze’ investment (significantly below
the average required investment)
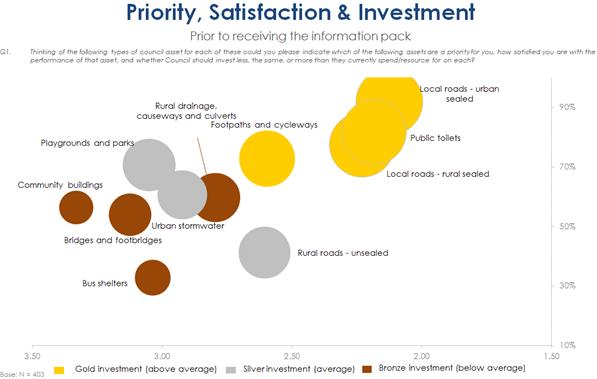
Figure 9 Community Survey - Priority,
Satisfaction and Investment
Residents indicated that
population growth and all it brings in terms of infrastructure needs are the
key long term challenges that residents believe the Byron LGA needs to address.
Urban Sealed roads, Rural Sealed Roads, Footpaths/cycleways and Pubic toilets remain
a strongly articulated priority areas as shown below in Figure 10 and Table 7. The
outcome of this survey further supports the Community Research Report, November
2013 where Road Maintenance was considered most important and also had the
lowest satisfaction mean.
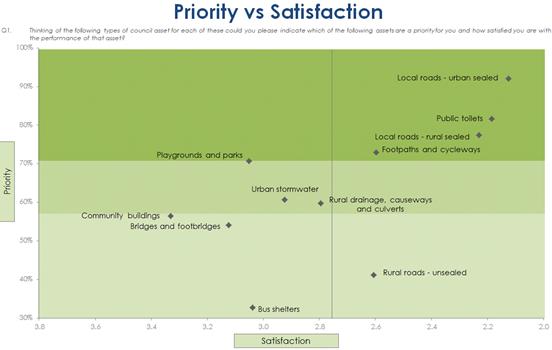
Figure 10 Community Survey - Priority
vs Satisfaction
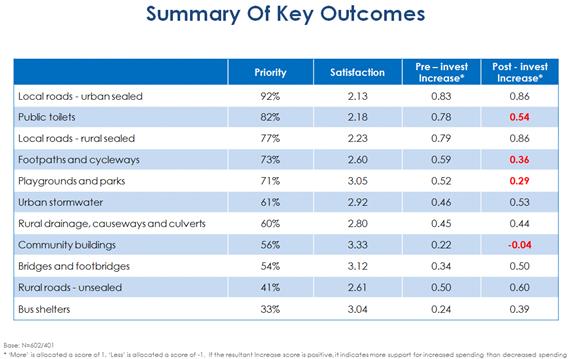
Table 7 Community Satisfaction –
Summary of Key Outcomes
After receiving the information packs the overall
satisfaction improved. This indicates that after the 604 participants were
informed of the overall general fund asset portfolio, current funding spent and
condition of the assets the overall satisfaction was 3.09 compared to 2.76
prior to receiving the information pack (Figure 11).
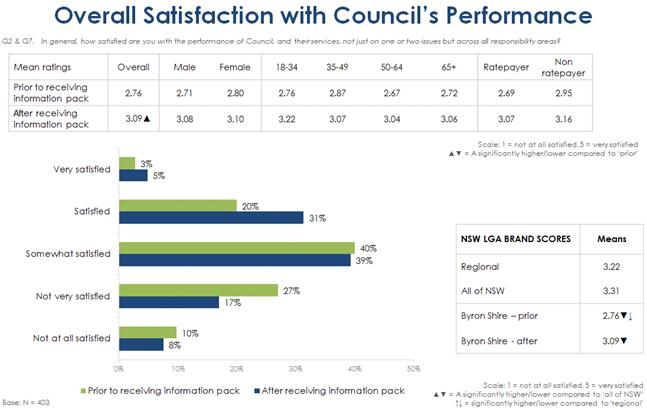
Figure 11 Community Survey -
Overall Satisfaction with Council’s Performance
Transport was the service given the highest level of
support for additional investment (Figure 12).
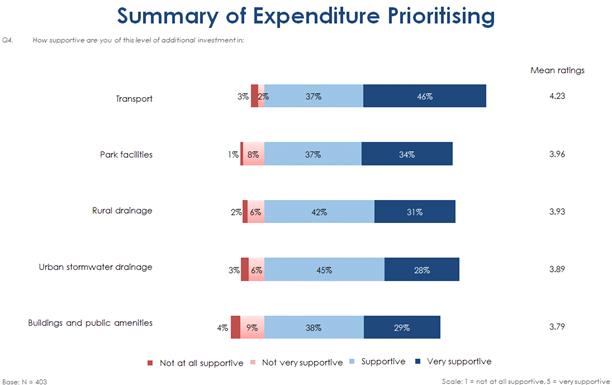
Figure 12 Summary of Expenditure
Prioritising
Council wants to understand from the
community how we should prioritise expenditure on our different community asset
types. We need a clear direction for future spending based on the community’s
views on what constitutes an acceptable level of asset conditions.
It is essential that we keep our community
assets in a safe working order and they meet community expectations. In light
of the condition audit and the current levels of infrastructure funding,
Council has determined the following asset areas need increased council
funding.
Specifically:
· Transport
which includes roads, bridges, footpaths, cycle ways, and road drainage
· Urban
stormwater drainage
· Rural
drainage
· Park
facilities
· Buildings
and public amenities
Increasing the level of funding for these
assets (as detailed in Scenario 2) will allow Council to renew those which are
currently in a poor condition. It will also ensure that the number of assets in
poor condition does not continue to grow.
It is intended to have further discussions regarding
individual Levels of Service with the community and this will be addressed in
the individual Asset Management Plans.
Council is required to meet many legislative requirements
including Federal and State legislation/ regulations. In this context, there
are many binding legal requirements that effect infrastructure and asset
management. These requirements have a significant influence on levels of
service and impact the independence of Council and the community in decision
making around the balance of asset condition, levels of service, cost and risk.
See Appendix F for list of legislative requirements.
Levels of service are defined in two ways.
Community Levels of Service measure how the community receives the service and
whether the organisation is providing community value.
Community
levels of service measures used in the asset management planning
are:
Quality How
good is the service?
Function Does it
meet users’ needs?
Capacity/Utilisation Is the
service usage
appropriate to capacity?
Technical Levels of Service - Supporting the community service levels are
operational or technical measures of performance. These technical measures
relate to the allocation of resources to service activities that the organisation undertakes to best achieve the desired community outcomes and
demonstrate effective organisational performance. Legislative requirements, infrastructure standards and industry
guides combine to strongly influence technical levels of service.
Technical
service measures are linked to annual budgets covering:
· Operations – the
regular activities to provide services such as availability, cleansing, mowing,
etc.
· Maintenance –
the activities necessary to retain an assets as near as practicable to an
appropriate service condition (eg road patching, unsealed road grading,
building and structure repairs).
· Renewal – the
activities that return the service capability of an asset up to that which it
had originally (eg road resurfacing and pavement reconstruction, pipeline
replacement and building component replacement).
· Upgrade – the activities to provide a higher level of
service (eg widening a road, sealing an unsealed road, replacing a pipeline
with a larger size) or a new service that did not exist previously (eg a new
library).
Service managers plan, implement and control
technical service levels to influence the customer service levels.
Together the
community and technical levels of service provide detail on service
performance, cost and whether service levels are likely to stay the same, get
better or worse.
Our current and projected technical levels of
service for the services covered by this strategic asset management plan will
be documented as part of the development of levels of service level associated
with individual asset management plans for each major asset category.
The Byron Local Government Area (LGA) has had very low
(<1%) rates of growth in the years 2004 to 2011. Table 8 shows the Estimated
Residential Population (ERP) of the LGA and the associated annual growth rate.
After 2011 growth in the LGA has accelerated sharply.
Table 8 Estimated Resident Population
|
Year
|
Byron (A)
|
Growth Rate
|
|
2001
|
29,453
|
|
|
2002
|
29,697
|
0.83%
|
|
2003
|
29,952
|
0.86%
|
|
2004
|
30,141
|
0.63%
|
|
2005
|
30,130
|
-0.04%
|
|
2006
|
30,125
|
-0.02%
|
|
2007
|
30,174
|
0.16%
|
|
2008
|
30,347
|
0.57%
|
|
2009
|
30,537
|
0.63%
|
|
2010
|
30,664
|
0.42%
|
|
2011
|
30,712
|
0.16%
|
|
2012
|
31,024
|
1.02%
|
|
2013
|
31,601
|
1.86%
|
|
2014
|
32,099
|
1.58%
|
|
2015
|
32,723
|
1.94%
|
ABS Regional Population Growth, Australia, 2014-15 (cat. no.
3218.0)
The main driver of growth within the LGA is net migration.
Natural increase (births less deaths) within the population has been relatively
stable over the period 2001 to 2014. Figure 13 shows the impacts of net
migration on population growth in the LGA.
In the years 2005-2011 there was a significant net
outmigration of people leaving the LGA. Since 2012, there has been a
significant reversal of that trend with growth accelerating primarily driven by
in migration. The removal of the sewer moratorium and the waiving of developer
contributions for secondary dwellings have seen a significant rise in dwelling
production and a corresponding rise in population.
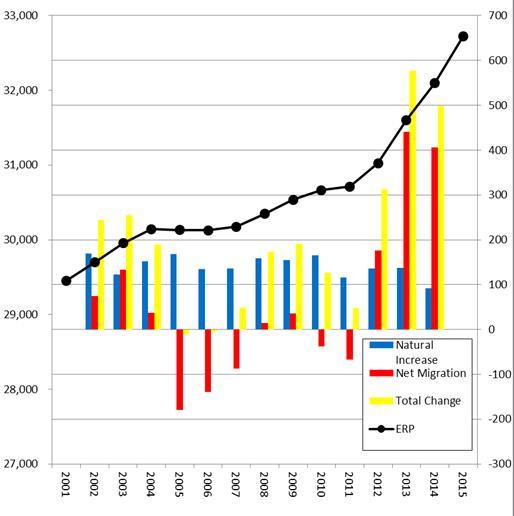
Figure 13 Residential migration
change
In March 2016 the Department of Planning released the Draft
North Coast Regional Strategy for consultation. This document indicates that
the Local Government Authority will need an additional 3750 – 4500 dwellings
above the 2011 housing stock to meet the current growth. The dwelling
production figures form the basis of the future population projections show in
Table 8. In Figure 14 and Table 8, the three growth scenarios are based on the
population projection that will occupy a projected number of dwellings based
upon a falling dwelling occupancy rate from 2.4 persons per dwelling in 2011
down to 2.25 persons per in 2036.
Table 8 Growth Projections
|
Year
|
High Growth
4500 Dwellings ERP
|
Mid Growth
4125 Dwellings ERP
|
Low Growth
3750 Dwellings ERP
|
Persons per Dwelling
|
|
2016
|
33,358
|
33,358
|
33,358
|
2.35
|
|
2021
|
36,113
|
35,848
|
35,671
|
2.33
|
|
2026
|
38,713
|
38,239
|
37,863
|
2.30
|
|
2031
|
41,092
|
40,389
|
39,794
|
2.28
|
|
2036
|
43,188
|
42,240
|
41,617
|
2.25
|
Figure 13 below represents these projections from the
current Estimate Residential Population (ERP) of 2015 to 2036.
Figure 14 Estimated Residential
Population and Population Projections to 2036
A significant proportion of this growth will occur in
the over 65 years age bracket. The NSW Department of Planning 2014 New South
Wales State and Local Government Area Population, Household and Dwelling
Projections show the over 65 years age cohort expanding from 13% of the
population to over 22% of the population by 2031. This expanding segment of the
population is the main driver of the declining occupancy rate of dwellings in
the LGA. An aging population will see significant growth in the number of single
person and couple only households.
Drivers
affecting demand include population change, changes in demographics, seasonal
factors, climate change, vehicle ownership rates, consumer
preferences and expectations, government
decisions, technological
changes, economic factors, agricultural practices, environmental awareness, tourism etc.
In 2014 the LGA received 1.376 million visitors (based
on a 4 year running average), who stay approximately 3 million visitor nights.
Such visitation significantly inflates the number of people resident in the
area on a daily basis beyond those who live in the area permanently. Tourist
numbers are variable ranging from 1.325 million visitors in March 2009 to a
peak of 1.410 in December 2011. Figure 15
depicts the 4 year running average of international overnight, domestic
overnight and domestic day visitors to the LGA. These statistics only record
visitors as those persons aged over 15 years. This will underrepresent the
impact that tourist numbers has on some types of assets.
Figure 15 Byron Local Government
Authority Visitor Numbers
These visitors place operational pressure on Council’s
infrastructure and services. The additional costs to Council from tourist
visitations is estimated at between 25 – 30% per annum (i.e. costs over and
above what would be spent without the visitation), as calculated for Council’s
2013 presentation to the Local Government Grants Commission. Council has a
small permanent ratepayer base (approximately 15,000 assessments) to support
its infrastructure without the additional burden of tourism visitation.
Prior to 2015 the opportunity to increase revenue from
visitors utilising strategies such as paid parking had not been supported. However,
after extensive consultation with Councillors and the community, including the
business and residential communities, revenue opportunities from visitors have
been broadly agreed and implementation commenced in 2015/16. The
main focus of increased revenue is paid parking in Byron Bay.
The impact of demand drivers that may affect future
service delivery and utilisation of assets are shown in Table 9.
Table 9 Demand Drivers, Projections
and Impact on Services
|
|
|
|
Population
|
|
Byron Bay LGA has an area of 566 sq km and an estimated residential population
of 32,119 at 30 June 2014 which is expected to increase to 44,300 by
2036.
|
Increased pressure on existing
infrastructure and the need for additional/expansion
of current services.
|
|
Demographics
|
|
|
The current medium age is 42 however the population is
aging which is evident by the 60-69 year age experiencing the biggest
increase of all age categories between 2006-2011.
|
Increased pressure for a diverse
range of services.
|
|
Increasing Costs
|
|
The cost to construct, maintain and replace infrastructure
is increasing
|
Increasingly difficult to maintaining
the current level of service.
|
|
Climate Change
|
|
Rising water levels and higher frequency
of extreme weather events
|
Additional
costs may be imposed to fund environmental initiatives and remedial
works.
|
|
Tourism
|
|
|
Byron has 3,769 average nightly tourists and average
daily traffic (AADT) counts into Byron Bay town of 18,378 (AADT 29 October
2015 Metro counts)
|
The
variability of tourist numbers makes it difficult to predict the impact that
it will have on assets in the future. However, with the available data we can assume significant impacts
on services and supports the
justification for paid parking in Byron Bay and the expenditure of this
revenue towards road and bridge infrastructure renewals Scenario 2.
|
Demand for new services will be managed through a
combination of managing existing assets, upgrading of existing assets and providing
new assets to meet demand.
Demand
management is
also important and practices include non-asset solutions, insuring against
risks and managing failures.
Non-asset solutions focus on providing the required
service without the need for the organisation to own the assets and management
actions including reducing demand for the service, reducing the level of
service (allowing some assets to deteriorate beyond current service levels) or
educating customers to accept appropriate asset failures. Examples of
non-asset solutions include providing joint services from
existing assets such
as aquatic centres and libraries, or public toilets provided in
commercial premises. Opportunities identified for demand
management are shown in Table 10.
Table 10 Demand Management Plan
Summary
|
|
|
|
Communicate options and capacity to fund infrastructure
works with the community
|
Monitor community expectations and communicate service
levels and financial capacity with the community to balance priorities for
infrastructure with what the community is prepared to pay for.
|
|
Funding priority works
|
Link asset management plans to long term financial plans
and community strategic plans. Continue to seek grant funding for projects
identified in the Byron Shire’s Community Plan and Asset Management Plans.
|
|
Improve understanding of costs and capacity to maintain
current service levels.
|
Continue to analyse the cost of providing service and the
capacity to fund at the current level of service.
|
|
Climate Change
|
Increased understanding of climate change effects and
required management techniques.
|
New assets required to meet growth are either created by the developer at no cost to
Council or created by Council with funding from Section 94 Development Charges.
In some circumstances Council achieves federal or state grant funding for the
creation of new assets to facilitate function and capacity needs. A clear
example is the proposed Byron Bay Bypass and more broadly the creation of new
and upgrade road and bridge assets throughout the length of the MR545 corridor.
New assets
constructed/acquired by the organisation are discussed in Section 5.5.
Acquiring
these new assets creates a future
liability and will commit the organisation to fund ongoing operations, maintenance and renewal
costs for the period that the service provided from the assets is required.
These future costs are identified and considered in developing forecasts of
future operations, maintenance and renewal costs in Section 5.
The
lifecycle management plan details how the
organisation plans to manage
and operate the assets at the agreed levels of service (defined in Section 3)
while optimising life cycle costs. The organisation’s infrastructure
is generally provided to meet
design standards where these are available.
At present a key challenge for Council is that aged infrastructure frequently
does not meet accepted modern technology standards.
Council is using the
International Infrastructure Management Manual as a guiding document and as
such the lifecycle management
plan has the following elements:
- Asset Risk Management Plan (section 5.1)
- Asset Operations and Maintenance Plan (section
5.2)
- Asset Renewal Plan (section 5.3)
- New Asset Creation/ Acquisition/ Upgrade Plan
(section 5.4)
- Asset Disposal Plan (section 5.5)
An
assessment of risks associated with service delivery from infrastructure assets
is conducted for each relevant asset management
plan. The risk assessment
process identifies credible risks, the likelihood of the risk event occurring,
the consequences should the event occur, develops a risk rating, evaluates the
risk and develops a risk treatment plan for non-acceptable risks.
Critical
risks, being those assessed as ‘Very High’ – requiring immediate corrective
action and ‘High’ – requiring prioritised corrective action identified in the Risk Asset Management Plan(s) and the adopted treatment plan are summarised in Table 11.
These risks are regularly reported to management and Council.
Table 11 Critical Risks and
Treatment Plans
|
|
|
|
|
|
Roads
|
|
Increasing financial
pressure to adequately maintain the roads portfolio
|
The long term renewal of
road seals is not adequate
|
Very High
|
Additional analysis of data
inventory, assessment of useful lives will be critical to ensure the long
term financial planning for roads is reliable.
|
|
Road Maintenance
|
Increasing maintenance
requirements
|
High
|
Continue to improve data and
reporting with Authority Work Orders and Asset Edge Reflect Software.
Documented service level
risks and utilisation for establishing future maintenance priorities.
|
|
Road Damage
|
Damage to roads as a result
of major storm events
|
Very High
|
At present cannot be managed
within councils resourcing.
Continue to improve data
collective and preparedness.
|
|
Bridges
|
|
Bridges and Footbridges
|
Failure. Structural or
functional.
|
Very High
|
Increase inspections.
Load
limit road bridges to reduce risk and implement site specific risk mitigation
measures.
|
|
Stormwater Drainage
|
|
Stormwater Network
|
General deterioration of the
network resulting in structural and capacity failures
|
High
|
Assess adequacy of
inspections, particularly in aged network areas
Keep data up to date so that
renewals can be planned
|
|
Stormwater Network
|
Flooding due to blockages
|
High
|
Assess adequacy of programs
and monitor frequency of problems due to inadequate cleaning or maintenance.
|
|
Stormwater Network
|
Flooding caused by
inadequate or lack of stormwater t systems
|
High
|
Review stormwater management
program
|
|
Box Culverts and Causeways
|
|
Box Culverts and Causeways
|
Failure. Structural or
functional.
|
High
|
Increase inspections
Load
limit to reduce risk
Implement
planned maintenance schedules to ensure access to all structures to enable
inspections
|
|
Footpaths
|
|
Footpaths
|
Path users trip and injure
themselves on damaged path surface.
|
Medium
|
Regular inspection of path
condition and defects in accordance with footpath policy. Inspections by
Council personnel for any hazards reported by public. Use of materials in new
path construction to increase life of footpath. Train operational staff
around risk mitigation processes.
|
|
Retaining Walls
|
Failure. Structural or
functional.
|
High
|
Increase inspections
Survey Monitoring
|
|
Roadside Barriers (Guardrails)
|
Failure. Structural or
functional.
|
Medium
|
GPS audit, condition inspect
and evaluate risk for entire asset group
Prepare
and scope a priorities risk replacement program to comply to Australian
standards
|
|
Roadside Furniture (Bus Stops)
|
Failure. Structural or
functional.
|
Medium
|
Potentially remove or
replace condition 4 or 5 bus stops
|
Operations
include regular activities to provide services such as public health, safety
and amenity, e.g. cleansing, utility
services, street sweeping,
grass mowing and street lighting.
Routine
maintenance is the regular on-going work that is necessary to keep assets
operating, including instances where portions of the asset fail and need
immediate repair to make the asset operational again.
Operations
activities affect service levels including quality and function, such as cleanliness, appearance, etc., through street sweeping and grass mowing
frequency, intensity and spacing of street lights and cleaning frequency and
opening hours of building and other facilities.
Maintenance
includes all actions necessary for retaining an asset as near as practicable to
an appropriate service condition including regular ongoing day-to-day work
necessary to keep assets operating, e.g. road patching but excluding
rehabilitation or renewal.
Maintenance
expenditure levels are considered to be inadequate to
meet the targets set in the
infrastructure risk management procedures. Where maintenance expenditure levels result in lower service levels and higher risk
profiles these will be high lighted in the
respective asset management plans
and Infrastructure Services Risk Management
Procedures (E2014/62240).
Council will operate and maintain assets to
provide the defined level of service to approved budgets in the most
cost-efficient manner. The operation and maintenance activities include:
· Scheduling
operations activities to deliver the defined level of service in the most
efficient manner.
· Undertaking
maintenance activities through a planned maintenance system to reduce
maintenance costs and improve maintenance outcomes. Undertake cost-benefit
analysis to determine the most cost-effective split between planned and
unplanned maintenance activities (50 – 70% planned desirable as measured by
cost).
· Maintain a
current infrastructure risk register for assets and present service risks associated
with providing services from infrastructure assets and reporting Very High and
High risks and residual risks after treatment to management and Council.
· Review current
and required skills base and implement workforce training and development to
meet required operations and maintenance needs.
· Review asset
utilisation to identify underutilised assets and appropriate remedies, and over
utilised assets and customer demand management options.
· Maintain a
current hierarchy of critical assets and required operations and maintenance
activities
· Develop and
regularly review appropriate emergency response capability.
· Review
management of operations and maintenance activities to ensures Council are obtaining best value for resources used.
Historically the
budget allocations for operations and maintenance of acquired assets have not
kept pace with the value and scale of the assets.
Future operations
and maintenance budgets must be developed on a whole of life basis and reflect
an optimal investment to ensure the best value outcome for the community.
Failure to invest in
adequate levels of maintenance decreases levels of service, increases risk
profiles and shortens asset life.
Operations and
maintenance planning will be documented in individual Asset Management Plans.
Renewal
and replacement expenditure is work which does not increase the asset’s design
capacity but restores, rehabilitates, replaces or renews an existing asset to
its original or lesser required service potential. Work over and above
restoring an asset to original service potential is upgrade/expansion or new
works expenditure (Appendix C Current
Works Program).
Council plans capital renewal and replacement projects
to meet level of service outcomes and minimise infrastructure service risks
by:
· Planning and
scheduling renewal projects to deliver the defined level of service in the most
efficient manner.
· Undertaking
project scoping for all capital renewal and replacement projects to identify:
o the service
delivery ‘deficiency’, present risk and optimum time for renewal/replacement,
o the project
outcome to rectify the deficiency,
o the range of
options, estimated capital and life cycle costs for each option that could
address the service deficiency,
o evaluate the
options against evaluation criteria, and
o select the
best option to be included in capital renewal programs.
· Using optimal
renewal methods wherever possible. A good
example is the timber bridge replacement program utilizing surplus ADF steel
bridges.
· Utilising and updating the infrastructure risk register for assets
and where a funding gap exists, reporting Very High and High risks and
residual risks after treatment to management and Council.
· Translate the required
skills and training into the work force plan to meet required construction and renewal needs.
· Maintain a
current hierarchy of critical assets and capital renewal treatments and timings
required.
· Review
management of capital renewal and replacement activities to ensure we are
obtaining best value for resources used.
Asset
renewal and replacement is typically undertaken to either:
· Ensure the
reliability of the existing infrastructure to deliver the service it was
constructed to facilitate (e.g. replace a bridge that has a 5 tonne
load limit), or
· To ensure the
infrastructure is of sufficient quality to meet the service requirements (e.g.
roughness of a road).
It is
possible to get some indication of capital renewal and replacement priorities
by identifying assets or asset groups that:
· Have a high
consequence of failure,
· Have a high
utilisation and where subsequent impact on users would be
greatest,
· The total value
represents the greatest net value to the organisation,
· Have the highest
average age relative to their expected lives,
· Are identified
in the asset management plan as key cost factors,
· Have high
operational or maintenance costs, and
· Where
replacement with modern equivalent assets would yield material savings.
In August 2016, Council
has invested in MyPredictor modelling software. This software utilises various
dataset inputs and parameters to determine optimised spending scenarios. The
following asset classes have sufficient data to model: Sealed Roads, Unsealed
Roads, Bridges, and Footpaths/cycleways. Further models will be run to provide
decision support tools for future asset renewal plans as asset management data
matures.
The
ranking criteria used to determine priority of identified renewal and
replacement proposals will be detailed in the respective asset management plans.
Both Scenario 1 and
2 of Council’s (Fit For the Future) Improvement Plan include forward estimates
and budget provisions for infrastructure renewals.
The budget values
for infrastructure renewal in Scenario 1 are insufficient to address the ‘bring
to satisfactory’ backlog of outstanding renewals and in fact will ultimately
lead to an increase in the total backlog value.
The budget values
for infrastructure renewal in Scenario 2 are sufficient over ten years to
address the ‘bring to satisfactory’ backlog of outstanding renewals and will
ultimately lead to a balanced position by 2027.
Cost to ‘Bring to
Satisfactory’ (BTS) has been
assessed from the documented cost to renew the assets that are not funded in
the current budget and constitute critical risks to the organisation. These are
aligned with the renewal requirements for critical assets in the Risk Register
and are summarised in the following table. Full calculations including the Risk
Register, BTS Calculator and asset working sheets are contained in Byron SS7
calculator and working papers (Appendix K).
Table 12 Cost to Bring to
Satisfactory Summary (Appendix K - Table 4)
|
Category
|
Sub Category
|
Description
|
BTS
$’000
|
|
Buildings
|
All Buildings
|
Maintenance and risk
remediation works is reactive. High risk items are funded when found -
additional funding for inspection and maintenance to move to more proactive
maintenance strategies
|
$2,069
|
|
Structures
|
Retaining Walls
|
Renew condition 4,5 or high
risk condition 3
|
$170
|
|
Structures
|
Fences
|
Renew condition 4 and 5
high risk fences
|
$338
|
|
Roads
|
Sealed Roads - Structure
|
Patch or renewal all
condition 4 and 5 road pavements derived from condition data and MyPredictor
Asset Modelling Software.
|
$24,036
|
|
Roads
|
Unsealed
|
Grading and re-sheeting
with gravel all condition 4 and 5 road pavements derived from condition data
and MyPredictor Asset Modelling Software.
|
$795
|
|
Roads
|
Bridges
|
Total Rectification Cost
based on Level 2 bridge inspection or equivalent of all condition 4 and
MyPredictor Asset Modelling Software.
|
$6,174
|
|
Roads
|
Bus Shelters
|
Comprehensive asset
condition assessment. Replace condition 4 and 5.
|
$270
|
|
Roads
|
Footpaths and Cycleways
|
High Risk Path Defect
Rectification. Replace high risk path concrete bays and grind where possible
|
$968
|
|
Roads
|
Kerb and Gutter
|
OCEAN SHORES renew high
risk sections
|
$80
|
|
Roads
|
Barriers
|
Full list of upgrade =
3,546,866. Complete safety audit and allocate $100,000 as the renewal
component for high criticality items. No claims no service requests.
Review next year.
|
$150
|
|
Stormwater Drainage
|
Causeways & Box
Culverts
|
Renew or repair all
causeways and culverts in condition 4 and 5
|
$3,025
|
|
Stormwater Drainage
|
Stormwater
|
No high risk pipes and pits
- high risk items included in box culverts
|
$0
|
|
Parks
|
Recreation Facilities
|
Complete asset condition
inspection in 2016. Renew condition 4 and 5 park assets that are considered
high risk.
|
$223
|
|
Parks
|
Play Equipment
|
Complete asset condition
inspection in 2016. Renew condition 4 and 5 park assets that are considered
high risk.
|
$196
|
|
Parks
|
Park Furniture
|
Complete asset condition
inspection in 2016. Renew condition 4 and 5 park assets that are considered
high risk.
|
$182
|
|
Parks
|
Park Shelters
|
Complete asset condition
inspection in 2016. Renew condition 4 and 5 park assets that are considered
high risk.
|
$63
|
|
Parks
|
Hard Scape
|
Complete asset condition
inspection in 2016. Renew condition 4 and 5 park assets that are considered
high risk.
|
$101
|
|
Parks
|
Park & Sports Field
Lighting
|
Complete asset condition
inspection in 2016. Renew condition 4 and 5 park assets that are considered
high risk.
|
$157
|
|
Parks
|
Grandstands
|
Complete asset condition inspection
in 2016. Renew condition 4 and 5 park assets that are considered high risk.
|
$12
|
|
Parks
|
Sports Equipment
|
Complete asset condition
inspection in 2016. Renew condition 4 and 5 park assets that are considered
high risk.
|
$35
|
|
|
|
TOTAL
|
$39,084
|
New
works are those works that create a new asset that did not previously exist, or
works which upgrade or improve an existing asset beyond its existing capacity (Appendix C Current Works Program). They may result from growth, social or
environmental needs. Assets may also be acquired at no cost to the organisation from land development. These assets from growth are discussed in Section 4.5.
Council will continue to proactively leverage available Section 94 Development
Contributions, target grant opportunities and partner for investment where
appropriate. The SAMP highlights that acquisition of new assets generates an
ongoing maintenance obligation that must be unfunded. Whilst new assets have a
natural community attraction the focus of
the SAMP is on the allocation of additional funds to asset renewals. Any
diversion of available funds to new assets will delay the recovery and
achievement of a sustainable asset renewal position.
New
assets and upgrade/expansion of existing assets are identified from various
sources such as MyPredictor modelling
software (Figure 2), councillor
or community requests, proposals identified by strategic plans or partnerships
with other organisations. Customer
requests are inspected to
verify need and to develop a preliminary renewal estimate. Verified proposals
are ranked by priority and available funds and scheduled in future works
programmes. The priority ranking criteria is detailed in the respective asset management plans.
Council will plan capital upgrade and new
projects to meet level of service outcomes by:
· Planning and
scheduling capital upgrade and new projects to deliver the defined level of
service in the most efficient manner
· Undertake thorough project scoping for all capital upgrade/new projects as detailed in Section 5.3.1.
· Review current
and required skills base and implement training and development to meet
required construction and project management needs
· Review
management of capital project management activities to ensure Council are obtaining best value for resources used.
Standards
and specifications for maintenance of
existing assets and construction of new assets and upgrade/expansion of existing assets are detailed in relevant asset management plans.
Council is acquiring
a significant increase in assets in the short term through major projects such
as the Byron Bay Bypass and the hand over of former state roads due to highway
upgrades.
Council will
continue to acquire assets through developer funded works and development
charges. This is expected to continue steadily in accordance with Council’s
land use planning instruments and strategies.
The
projected 10 year upgrade/new capital works program is
shown in Appendix D.
Disposal
includes any activity associated with disposal of a decommissioned asset
including sale, demolition or relocation. Assets identified for possible
decommissioning and disposal are shown in
the respective asset management plans.
This section
contains the financial requirements resulting from all the information
presented in the previous sections of this
strategic asset management
plan. The financial projections will be improved as further information
becomes available on desired levels of service and current and projected future
asset performance.
In addition to long term life cycle
costs/expenditures there are 3 key indicators for service delivery
sustainability that have been considered within this plan:
1. Asset
Renewal funding ratio
(Projected capital renewal Exp.
AMP / Estimated Capital Renewal LTFP)
2. Medium
term 10 Year Sustainability
(Planned budget expenditures /
Projected Expenditures)
3. Short
Term 5 Year Sustainability
(Planned budget
expenditures / Projected Expenditures)
The Asset Renewal Funding Ratio is the most
important indicator and reveals whether projected capital renewal and
replacement expenditure are able to be financed in the long-term financial
plan. The 3 key indicators are detailed in the Table 14 below.
Table 14 Financial Indicators and Projections
|
Key
|
Sustainability
of service delivery
|
Scenario 1
|
Scenario 2
|
|
Indicator
|
($000’s)
|
($000’s)
|
|
1
|
Asset Renewal Funding Ratio
|
132%
|
179%
|
|
2
|
Medium Term (10 yrs)
Sustainability
|
|
|
10 year Operations,
Maintenance & Renewal Projected Expenditure
|
$15,847
|
$15,847
|
|
10 year Operations,
Maintenance & Renewal Planned (Budget) Expenditures
|
$9,733
|
$16,063
|
|
10 year Funding Shortfall
|
-$6,114
|
$216
|
|
10 year Sustainability
Indicator (Planned Exp. / Projected Exp.)
|
61%
|
101%
|
|
3
|
Short Term (5 years)
Sustainability
|
|
|
5 year Operations,
Maintenance & Renewal Projected Expenditure
|
$19,662
|
$19,662
|
|
5 year Operations,
Maintenance & Renewal Planned (Budget) Expenditure
|
$9,733
|
$15,556
|
|
5 year Funding Shortfall
|
-$9,929
|
-$4,106
|
|
5 year Sustainability
Indicator (Planned Exp. / Projected Exp.)
|
50%
|
79%
|
The funding strategy
to provide the services covered by this strategic asset management plan and
supporting asset management plans is contained within the Council’s (Fit For
the Future) Improvement Plan and associated 10 year long term financial plan.
Revaluations of Councils
assets are completed on a 5 year cycle in accordance with the requirements of
the Local Government Code of Accounting Practice and Financial Reporting
(Guidelines).
The value of
Council’s assets is influenced by the assessed condition of assets, unit rates
for renewal cost, and the estimated useful asset life.
The overall value of
assets will also be affected by the rate of asset acquisition through construction and acquisition by Council
and from assets constructed by land developers and others and donated to Council.
The
depreciated replacement cost will vary over the forecast period depending on
the rates of addition of new assets, disposal of old assets and consumption and
renewal of existing assets. Forecast of the assets depreciated replacement
cost is shown in Figure 16 and 17.
The following graphs
show in comparison that under present funding constraints council will struggle
to maintain the capital value of its infrastructure portfolio over the longer
term. This position is significantly improved under scenario 2 (Figure 17).
Figure 16 Scenario 1 Projected
Depreciated Replacement Cost
Figure 17 Scenario 2 Projected
Depreciated Replacement Cost
This
section details the key assumptions made in presenting the information
contained in this strategic asset
management plan and in
preparing forecasts of required operating and capital expenditure and asset
values, depreciation expense and carrying amount estimates. It is presented to
enable readers to gain an understanding of the levels of confidence in the data
behind the financial forecasts.
Key
assumptions made in this strategic asset management plan and risks that these
may change are shown in Table 13.
Table 13 Key Assumptions made in AM
Plan and Risks of Change
|
|
|
|
Use of the existing
inventory data including average annual asset consumption which is used for
the Long Term sustainability assessments
|
Medium Risk
|
|
Use of existing valuations,
useful lives and remaining lives determined from the condition rating
|
Medium Risk
|
|
Use of current expenditure
information as best as this can be determined
|
Medium Risk
|
The financial
figures presented in this strategic asset management plan are based
on the current available data. This includes information gathered through
revaluation processes and broader routine asset management activities.
Council is building
its asset management capacity and capability through a continuous improvement
process. Actions to increase data quality are included in the Improvement Plan
(Table 15).
The iterations of
asset inspections, assessments and associated plans for renewals, progressively
increase the level of reliability and confidence in the data and financial
conclusions.
The
estimated confidence level for and reliability of data used in this strategic asset management plan is shown in Table 14.
Table 14 Data Confidence Assessment
for Strategic Asset Management Plan
|
Data
|
Confidence Assessment
|
Comment
|
|
Demand drivers
|
Uncertain
|
Estimated, further
substantiation required for next revision of the SAMP
|
|
Growth projections
|
Reliable
|
Estimated, further
substantiation required for next revision of the SAMP
|
|
Operations expenditures
|
Reliable
|
Direct from budget, but breakdown
into operations and maintenance and renewal is estimated and requires
development
|
|
Maintenance expenditures
|
Reliable
|
Direct from budget, but
breakdown into operations and maintenance and renewal is estimated and
requires development
|
|
Projected Renewal
expenditures.
- Asset values
|
Reliable
|
Based on average annual
asset consumption as reported in financial 2013/14 financial statements.
|
|
- Asset useful lives
|
Reliable
|
Ongoing substantiation
required for next revision of the AMP
|
|
- Condition modelling
|
Uncertain
|
Estimated, further
substantiation required for next revision of the SAMP
|
|
- Network renewals
|
Reliable
|
Based on average annual
asset consumption as reported in financial 2013/14 financial statements.
|
|
Upgrade/New expenditures
|
Reliable
|
Direct from budget
|
|
Disposal expenditures
|
Reliable
|
Estimated, but not
considered to be significant
|
13.2
- Attachment 3
The
asset management improvement tasks identified
from the 2015 NSW Local Government Audit Preparedness Assessment (Appendix G)
and the 2013 Maturity Assessment (Appendix H) are shown in Table 16
below. Note the priorities were allocated through the Audit review from Thomas
Noble & Russell (TNR). The’ Component / Activity’ numbers are from the LG
Audit Preparedness. These goals have been further broken down and detailed into
sub tasks to appropriately address.
Table 15 Improvement Goals
|
Priority
|
Component
Activity
|
Goal No.
|
Goal / Task
|
Responsibility
|
Resource Required
|
Timeline
|
Current Status
Comments
|
|
1
|
2.2
Risk
Management
|
2.2.1
|
2.2.1 Develop
a Risk Management Policy
|
2.2.1 TBC
|
Corporate
Governance & Risk Management Officer
|
Mid 2017
|
Pending: With
Director of Infrastructure Services and Director Corporate Services to
resource
|
|
1
|
2.2
Risk
Management
|
2.2.2
|
2.2.2 Develop
Risk Asset Register. Refine Risk Asset Management procedures
(E2014/62240) for prioritized critical assets. Bridge Engineer to complete
Bridge Section. All other road categories have been completed
|
2.2.2 Asset
Sys. Officer/ Asset Engineer/Bridge & Roads Engineer
|
Contractor
S. Pearce for
E2014/62240
|
June 2016
May – Dec 2016
Completed
|
Risk Register
templates developed. Bridge components & condition data loaded into
Asset Register
Add TRIM
procedures & Promapp processes to relevant asset attribute sets
|
|
1
|
2.2
Risk
Management
|
2.2.3
|
2.2.3 Increase investment in asset management to increase the level of confidence in asset based
information
|
2.2.3 Manager
Assets & Major Projects
|
NIL
|
June 2016
Completed
|
Assets
Management Coordinator position to be permanently filled.
|
|
1
|
2.2
Risk
Management
|
2.2.4
|
2.2.4 Business
Continuity Plans was in the Manager Governance work program . DIS Plan
(Disaster Plan) will become the "EM Plan" (Emergency Plan) -
progressing
|
2.2.4
Manager
Governance &
Manager Works
|
Corporate
Governance & Risk Management Officer
|
Mid 2017
|
Pending: With
Director of Infrastructure Services and Director Corporate Services to
resource
|
|
1
|
3.1
Operations/
Maintenance
Management
|
3.1.1
|
3.1.1 Definitions
for maintenance, capital new, capital upgrade, capital disposal to be
included in the Asset Management Plan. Ensure that staff are educated on the
different definitions of “Maintenance” and “Capital” reporting requirements
for LG. Develop Data Dictionary. Budgets to reflect this and link to
Authority Work Orders
|
3.1.1 Asset
Management Coordinator &
GIS Assets
Officer
|
NIL
|
Toolbox talks Jan
2017 then,
Ongoing
|
Action taken:
Request for Work Order Process Mapped to include Definitions. Emails sent
out to all IS staff sporadically. Data diction developed.
|
|
Priority
|
Component
Activity
|
Goal No.
|
Goal / Task
|
Responsibility
|
Resource Required
|
Timeline
|
Current Status
|
|
1
|
3.1
Operations/
Maintenance
Management
|
3.1.2
|
3.1.2 General
Fund Assets - Preventative Maintenance Scheduling. Implement all
critical asset types into Reflect Databases to facilitate Operational Staff
with Programmed Maintenance in Reflect. E.g. Bridges, Causeways, Box
Culverts, Footbridges, Retaining Walls, Roadside Barriers, and Parks.
Develop electronic Forms for condition inspections.
|
3.1.2 Manager
Works
Manager
Utilities
Manager Parks
& Resource Recovery
|
Funds in
budget for vegetation clearance of culverts & causeways
|
Dec 2017
May – Dec 2016
|
Inspections for
Causeways & Culverts underway with Assets Engineer. Provision of data
extracts for condition inspections using Reflect. Audit Reflect data quality. Develop strategies to
promote and enforce ongoing data quality. Review operational procedures and
user training. Review reporting features and develop data analysis
capabilities
|
|
1
|
3.1
Operations/
Maintenance
Management
|
3.1.3
|
3.1.3 Integration
between Reflect and CRM Project
|
3.1.3 IT &
Asset Systems Officer & AMC
|
Contract
Engagement & Management support for integration
|
Dec 2017
|
Pending review
of CRM IT Review due June 2016
|
|
1
|
3.2
Critical
Assets
|
3.2.1
|
3.2.1 Risk
Register (Assets) to be setup as an Attribute Checklist template in
Authority Asset Module (AM). Identification, priority and risk mitigation
measures will be detailed here. A report will be generated from this to
produce a RISK REGISTER on the fly as required. Luis Santos to create.
Individual data custodians to maintain.
|
3.2.1 Asset
Systems Officer
|
NIL
|
Template
Completed April 2016
Ongoing
Maintenance required.
|
Ongoing
develop to consider other risk factors as time permits.
|
|
1
|
3.2
Critical
Assets
|
3.2.2
|
3.2.2 “Asset Risk
Management Procedures” to document the recording procedures and risk
matrix methodologies used. Asset Engineer
|
3.2.2 Asset
Engineer
|
NIL
|
June 2016
Completed
|
Recording procedures
developed via REFLECT forms on the following asset classes: Rural Box Culverts, Rural Causeways,
Retaining Walls, Carparks. Methodologies
will be incorporated into E2014/62240.
|
|
1
|
3.2
Critical
Assets
|
3.2.3
|
3.2.3 Condition
Inspections to include risk assessment rating
|
3.2.3 Asset
Engineer / Roads & Bridge Engineer / Assets Maintenance Officer
|
Internal
identified.
NIL External
|
Ongoing
|
Electronic form
adjusted to include Risk Assessment Rating. Condition Inspections status:
Rural Box Culverts (14% complete, total of 80), Rural Causeways (5%
complete, total of 85), Retaining Walls (2% complete, total of 56)
|
|
Priority
|
Component
Activity
|
Goal No.
|
Goal / Task
|
Responsibility
|
Resource Required
|
Timeline
|
Current Status
Comments
|
|
1
|
3.2
Critical
Assets
|
3.2.4
|
3.2.4 Quality
Management System for General Fund Assets (Water E2015/17758 and,
Wastewater E2015/78848 Completed)
|
3.2.4 To Be
determined
|
To Be
determined
|
To Be
determined
|
To define
quality policy and basic Quality Management System. All critical activity
processes to be documented in ProMapp.
|
|
2
|
1.3
Condition Data
|
1.3.1
|
1.3.1
Condition Inspection of high risk critical assets - Create a "CONDITION
INSPECTION STRATEGY" to document methodologies, cycle inspections
of Causeways, Culverts, Retaining Walls, Footbridges, Roadside Barriers.
|
1.3.1 Asset Engineer
|
NIL
|
2020
|
Completed 5 year
inspection plan developed for: Rural Box Culverts, Rural Causeways, Retaining Walls
|
|
2
|
1.3
Condition Data
|
1.3.2
|
1.3.2 Load
Condition data from other asset classes into register (Buildings, Parks,
Reuse, Sewer & Water)
|
1.3.2 Assets
Sys. Officer / W & S Assets Officer
|
NIL
|
Buildings
& Parks completed
|
Condition data loaded for
Roads, Parks and Stormwater assets
|
|
2
|
1.4
Lifecycle Cost
Data
|
1.4.1A
|
1.4.1 New
Capital Infrastructure Project Scopes to include whole lifecycle costs
for Councillors to consider with the decision making process. All new Assets
MUST have a Project Scope with Whole of Life Costs (Design, Survey, Capital
Construction, Maintenance, Capital Renewal, Disposal costs)
|
1.4.1 T Manager
Works / Manager Water & Sewer
|
Consultancy
services
|
June 2017
|
Assumptions of
80% as per IIMM to be used until Council achieves asset capacity and
capability to accurately cost per asset type.
|
|
2
|
Governance
& Management
|
1.4.1B
|
Implement
this asset management development program to improve Councils asset management maturity,
particularly in the area of measurement and reporting of trends in service
levels and risk that result from the available funding scenarios in the long
term financial plan.
|
Manager of
Assets & Major Projects / Manager of Finance / Manager of Governance
|
NIL
|
Ongoing
|
|
|
2
|
1.4Lifecycle
Cost Data
|
1.4.2
|
1.4.2 Refer to
3.1.1
|
1.4.2 Refer
3.1.1
|
NA
|
NA
|
|
|
2
|
1.4
Lifecycle Cost
Data
|
1.4.3
|
1.4.3 Detailed
Capital Works Long Term Plan 10 years for all critical assets identified
in the AMP.
The 10 year
financial sustainability plan for all Council functions will consider both
the future anticipated income projections and the future expenditure
requirements to sustain services. This plan will consider the expenditures
identified in the Asset Management Plan and will provide input into the
annual Council budget.
|
1.4.3 Asset Management Coordinator/Team Leader
Technical Services/ Manager Assets & Major Projects/ Director IS/
Manager Finance
|
NIL
|
June 2017
|
|
|
Priority
|
Component
Activity
|
Goal No.
|
Goal / Task
|
Responsibility
|
Resource Required
|
Timeline
|
Current Status
Comments
|
|
2
|
2.1
Asset
Management Plans
|
2.1.1
|
2.1.1 Strategic
Asset Management Plans - Transport and Drainage underway AMP for PARKS.
AMP for BUILDINGS. AMP to include Capital Works Long Term Plan with
estimated costs. Key Performance Indicators detailed in AMP's – Pending
|
2.1.1 Asset
Management Coordinator
|
NIL
|
Transport - Mar
2017,
Parks - June 2017,
Buildings -
June 2018
|
Pending
restructure recruitment of Asset Team position
|
|
2
|
2.1
Asset
Management Plans
|
2.1.2
|
2.1.2 LoS
customer detailed after community consultation for TRANSPORT AMP –
Pending
* Asset
Performance measures - Customer requests must all be recorded in CRM using
the appropriate classifications for KPI Reporting. With Customer Service
& Process improvement officer.
* Collate AADT, crash data, into Road Segment layer for Performance analysis
* Conduct Customer Service Level Satisfaction survey to determine
performance of critical assets e.g. Roads, Bridges, Causeways, footpaths,
Buildings
|
2.1.2 Asset
Management Coordinator
|
Consultant for
Survey and or online resource such as Survey Monkey
|
General
Fund Asset Survey Completed Sep 16
|
Roads LoS
Survey Drafted
|
|
2
|
2.1
Asset
Management Plans
|
2.1.3
|
2.1.3 Ensure
that the AM Policy (E2016/19038)
is implemented and
communicated to the key stakeholders.
Annual
review of policy implemented by the Asset Management Working Group and Audit
Committee. Ensure Council is briefed on their roles and governance
responsibilities under the reviewed AM policy.
|
2.1.2 Asset
Management Coordinator
|
NIL
|
Annually
|
E2016/19038 saved in new
Corporate Governance Documents folder – ‘Council’s Current Policies’
|
|
2
|
4.2
Systems
integration
|
4.2.1
|
4.2.1 Implementation
of CVR. Develop Asset Accounting and Capitalisation Policy that assists
in meeting the Fair Value Reporting (AASB116)
|
4.2.1 IT &
Finance Accounts Manager
|
NIL
|
June 2016
Buildings
completed
|
IT Project in build
and data migration stage.
|
|
2
|
4.2
Systems
integration
|
4.2.2
|
4.2.2 TRIM
integration with AM. This project is yet to be scoped and prioritized.
Requires IT sponsorship
|
4.2.2 IT
|
IT Project
Plan
|
Unknown
|
|
|
Priority
|
Component
Activity
|
Goal No.
|
Goal / Task
|
Responsibility
|
Resource Required
|
Timeline
|
Current Status
Comments
|
|
2
|
4.2
Systems
integration
|
4.2.3
|
4.2.3 Integration
with Customer Request Module and AM (Requires Authority upgrade to v6.10
and Customising CRM)
|
4.2.3 IT
|
NIL
|
Phase 3 due
Feb 2017
|
Phase 1
Reconfigure CRM to improve user friendliness categories & workflows
|
|
2
|
4.2
Systems
integration
|
4.2.4
|
4.2.4 Investigate
integration between REFLECT and Authority CRM (Cairns Council have
achieved this. Luis Santos is liaising. Requires IT project involvement)
|
4.2.4 Asset
Systems Officer & IT
|
IT Project
Plan
|
2019
|
Acquired
Cairns Council project scoping documents.
|
|
3
|
1.1
Asset
Classification/ Hierarchy
|
1.1.1
|
1.1.1 Building
asset data from Finance to be imported into Asset Register. Building
Validation of 2013 Revaluation APV with BSC AM register.
|
1.1.1a Finance
Accounts Manager / Assets Systems Officer
|
IT Project
Plan
|
June 2016
|
In progress
|
|
3
|
1.1
Asset Classification/
Hierarchy
|
1.1.2
|
1.1.2Integrate
Waste assets into the Authority Asset Register
|
1.1.2 Team
Leader Resources Recover & Quarry
|
TBC
|
TCB
|
|
|
3
|
1.2
Attributes and
Location
|
1.2.1
|
1.2.1 Review
of AM attribute checklist templates being conducted in conjunction with
each revaluation.
|
1.2.1 Asset
Systems Officer / Asset Management Coordinator
|
Consultancy
Services
|
Ongoing
|
Review of AM attribute
sets for Roads, Parks and part of Stormwater assets in conjunction with each
revaluation
|
|
3
|
4.1
Asset Register
|
4.1.1
|
4.1.1 Integration
with AM and TRIM (Refer to 4.2.2)
|
4.1.1 IT
|
NIL
|
End 2016
|
|
|
3
|
4.1
Asset Register
|
4.1.2
|
4.1.2 Integration
with AM and CRM (Refer to 4.2.3)
|
4.1.2 IT
|
NIL
|
End 2016
|
IT
|
|
Priority
|
Component/Activity
|
Goal number
|
Goal / Task
|
Responsibility
|
Resource Required
|
Timeline
|
Current Status
Comments
|
|
3
|
4.1
Asset Register
|
4.1.3
|
4.1.3 Integration
with AM and Reflect(Refer to 4.2.4)
|
4.1.3 IT /
Asset Systems Officer
|
Consultancy
Services
|
TBC
|
Pending
Funding
|
|
3
|
Annual Reporting
|
5.1.A
|
Develop
Asset Accounting and Capitalisation Policy that assists in meeting the Fair Value Reporting
(AASB116)
|
Finance
Accounts Manager
|
NIL
|
TBC
|
|
|
3
|
Strategic Long
Term Plan
|
5.2.B
|
Use a
knowledge management strategy/system to ensure that appropriate and optimal
decision support information is available to clearly communicate the
cumulative consequences of decisions. E.g. Predicative Modelling Software
|
Asset
Management Coordinator
|
Third party
software vendor.
|
2018
|
Researching
options
|
13.2
- Attachment 3
The Strategic Asset
Management Plan has a life of 4 years (Council election cycle) and is due for complete revision and
updating within one year of
each Council election.
The effectiveness of the strategic
asset management plan can be measured in the following ways:
· Community support for the Scenario 2 and the
associated outcomes in Council’s (Fit For the Future) Improvement Plan.
· Achievement of the benchmark values for the
infrastructure ratios set out in Council’s (Fit For the Future) Improvement
Plan.
· Achievement of the key outcomes associated with the
implementation of Scenario 2 funding including reduced infrastructure renewal
backlog, improved levels of service and reduced levels of risk.
· Continuous improvement in asset management as measured
by internal and external audits.
ISO, 2014, ISO 55000, Asset management – Overview,
principles and terminology, International Organization for Standardization,
Geneva.
ISO, 2014, ISO 55001, Asset management – Management
systems - Requirements, International Organization for Standardization,
Geneva.
ISO, 2014, ISO 55002, Asset management – Management
systems – Guidelines for the application of ISO 55001, International
Organization for Standardization, Geneva.
IPWEA, 2014,
‘NAMS.PLUS3 Asset Management’, Institute of
Public Works Engineering Australia, Sydney, www.ipwea.org/namsplusError! Hyperlink reference not valid..
IPWEA, 2009, ‘Australian
Infrastructure Financial Management Guidelines’, Institute of Public Works
Engineering Australia, Sydney, www.ipwea.org/AIFMG.
IPWEA, 2011, ‘International
Infrastructure Management Manual’, Institute of Public Works Engineering
Australia, Sydney, www.ipwea.org/IIMM
Appendix A Asset
Management Policy (E2016/19038)
Appendix B Long
Term Financial Modelling Figures
Appendix C Adopted Capital Works for
2016/17
Appendix D Projected 10
year Capital Renewal / New / Upgrade Works Program
Appendix E Community Strategic Plan (CSP)
Priority Areas and Organisational Objectives
Appendix F Legislative Requirements
Appendix G 2015 NSW Local Government Audit
Preparedness Assessment Findings (E2016/7284)
Appendix H 2013 Maturity Assessment
(E2016/26245)
Appendix I Byron Shire
Council Financial Statements 30 June 2016 Note 9a
Appendix J Byron Shire
Council Financial Statements 30 June 2016 – Special
Schedule No. 7
Appendix K Methodology Report NSW Special
Schedule 7 Financial Reporting 2015/16
Appendix L Glossary
13.2
- Attachment 3
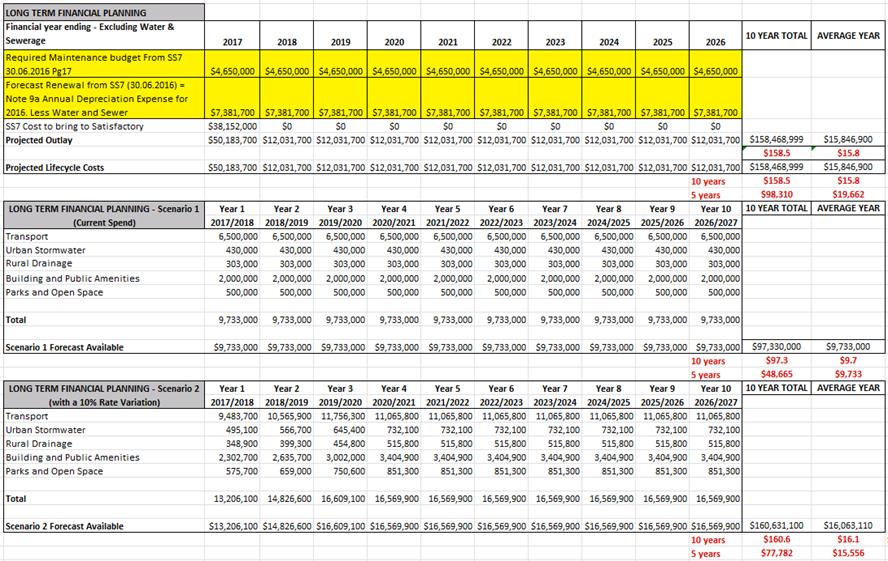
13.2
- Attachment 3
|
Corporate Framework
|
Outcome
|
Strategies
|
|
Corporate Management
|
Effective leadership and
ethical and accountable decision making.
Community
Outcome CM1: Effective governance, business, project and financial management.
Community
Outcome CM2: Informed and engaged community.
Community Outcome CM3: Effective
partnerships with all levels of government.
Community Outcome CM4:
Community compliance with statutory requirements
|
CM1.1 Improve
the transparency, effectiveness and accountability of Council.
CM1.2 Ensure
Council decision making supports fair allocation of resources, services and
facilities.
CM1.3 Improve
organisational sustainability (economic, social, environmental and
governance).
CM1.4 Comply
with NSW State government legislation for local government integrated
planning and reporting.
CM1.5 Provide a
safe, healthy and inclusive working environment.
CM2.1 Use a
range of effective communication tools to engage the community to support
transparent and accountable Council decision making.
CM2.2 Provide
education, engagement and feedback initiatives for meaningful community
participation.
CM3.1 Implement
collaborative partnerships that support efficient use of resources.
CM4.1 Promote community
compliance with Acts, Regulations, Instruments and Council policies and
standards.
|
|
Economy
|
A sustainable and
diverse economy which provides innovative employment and investment
opportunities in harmony with our ecological and social aims.
Community Outcome EC1: A
diverse economic base and support for local businesses.
Community Outcome EC2: A
sustainable tourism industry that respects and promotes our natural
environment and community values.
Community Outcome EC3: The
development of a diverse range of arts and creative industries.
|
EC1.1 Support
the development of a range of sustainable industries in Byron Shire.
EC1.2 Support
and strengthen local businesses and local business networks.
EC1.3 Support
new avenues of research and vocational and tertiary learning.
EC1.4 Support
sporting and cultural events in Byron Shire.
EC1.5 Advocate
for greater local employment opportunities.
EC2.1 Build a
tourism industry that delivers local and regional benefits in harmony with
the community’s values.
EC2.2 Develop
Byron Shire as a leader in responsible and sustainable tourism and
encourage sustainable business
practices
within the tourism industry.
EC2.3 Support
and promote a collaborative shire-wide approach to managing tourism.
EC3.1 Support
cultural and arts-based industries.
EC3.2 Develop
Byron Shire as a leader in arts and creative industries.
EC3.3
Strengthen regional partnerships with peak arts organisations.
|
|
Society and Culture
|
Resilient, creative and
active communities with a strong sense of local identity and place.
Community Outcome SC1:
Support communities to achieve equitable access to an appropriate range and
level of whole of life services such as healthcare, education and housing.
Community Outcome SC2:
Achieve active participation in local and regional community life.
Community Outcome SC3:
Respect and understanding of Aboriginal heritage and wider
cultural diversity.
|
SC1.1 Advocate
and lobby State and Federal Government for the needs of all members of the
Byron Shire community to have access to required
services infrastructure and facilities.
SC1.2 Provide
accessible facilities that support leisure, learning and recreation for
people of all ages.
SC1.3 Research,
analyse, update and distribute information regarding the Byron Shire community’s needs.
SC1.4
Coordinate communication forums between regional and local community service
organisations, the community and business.
SC2.1 Provide a
range of recreational, cultural and community opportunities.
SC2.2 Recognise
the importance of, and promote community safety.
SC2.3
Facilitate positive family and community influences on child development.
SC2.4 Create
vibrant liveable places and spaces within towns and villages for people of
all ages and abilities.
SC3.1 Work in
partnership with the community to facilitate access to a range of cultural
places, spaces, opportunities and activities for all in
the community.
SC3.2
Acknowledge, foster and celebrate Aboriginal culture.
SC3.3 Encourage
and support residents from cultural and linguistically diverse backgrounds to
participate in all aspects of community.
|
|
Environment
|
Our natural and built
environment is improved for each generation.
Community Outcome EN1:
Protect and enhance the natural environment.
Community Outcome EN2:
Sustainable towns, villages and rural settlements that:
a) respect our natural
environment
b) create an inclusive
social environment and
c) integrate harmoniously
with the character of local areas.
Community Outcome EN3: A a
low carbon community that integrates:
a) food security
b) renewable energy
c) climate change
d) non-renewable resource
constraints, including peak oil and
e) economic and social
prosperity and resilience.
|
EN1.1 Protect,
restore and maintain the biodiversity values, ecosystems and ecological
processes of the Byron Shire.
EN1.2
Sustainably manage significant urban and peri-urban bushland areas.
EN1.3 Manage
coastal processes, hazards and development so that the diversity, amenity and
accessibility of the Shire’s coastline is maintained
EN1.4 Protect
and enhance the health of the Shire’s catchments, waterways and estuaries.
EN2.1 Implement innovative
and sustainable urban design to:
a) Enhance the distinctive
qualities of towns and villages.
b) Reduce urban development
impacts on the environment.
c) Encourage developments
with reduced reliance on cars.
d) Provide for
sustainability outcomes in the development of private lands.
EN3.1 Implement initiatives
that address climate change.
EN3.2 Promote water and
waste minimisation – avoid, reduce and reuse waste.
EN3.3 Encourage low
consumption lifestyles and environmentally aware practices.
EN3.4 Implement initiatives
to prepare Council assets for climate change and peak oil impacts.
EN3.5 Promote reduced
energy consumption, increased energy efficiency and the local provision of
renewable energy.
EN3.6 Support initiatives
that enhance socio-economic prosperity and resilience at the local level.
|
|
Community Infrastructure
|
Services and
infrastructure that sustains, connects and integrates our
communities and
environment.
Community Outcome CI1: Planning
for the future.
Community Outcome CI2:
Provision of essential services.
Community Outcome CI 3:
Renew and maintain existing infrastructure.
Objective CI4: Develop new
infrastructure
|
CI1.1 Provide a network of
accessible cycleways and walkways that link with public transport.
CI1.2 Encourage sustainable
and accessible transport solutions between towns and villages.
CI1.3 Plan for the
provision of community facilities.
CI1.4 Plan for future
traffic demands.
CI1.5 Provide water,
sewerage and stormwater infrastructure and capacity for future generations.
CI1.6 Plan for the future
of waste and recycling management.
CI1.7 Infrastructure and
land use planning are integrated.
CI2.1 Maintain continuous
water and sewerage services within the Shire.
CI2.2 Provide waste removal
and recycling services within the Shire.
CI2.3 Provide roads and
drainage infrastructure within the Shire.
CI2.4 Have effective
processes and systems to respond to natural disasters for the protection of
life and the management of property and infrastructure.
CI2.5 Pursue strategic
regional resource sharing initiatives.
CI3.1 Maintain roads and
drainage in a safe and operational condition.
CI3.2 Maintain water and
sewerage infrastructure in accordance with operating licences and regulatory
standards.
CI3.3 Maintain waste and
recycling facilities in according with operating licences.
CI3.4 Ensure all public
parks and open spaces are accessible, maintained and managed to meet the
recreational needs of current and future residents.
CI3.5 Improve stormwater
management through stormwater levy funding.
CI3.6 Maintain safe and
legislative compliant community buildings and swimming pools.
CI4.1 Determine and
construct future infrastructure needs to serve the community.
CI4.2 Incorporate proposed
new infrastructure works in the long term financial plans of Council.
|
13.2
- Attachment 3
|
Legislation
|
Requirement
|
|
Local Government Act 1993
|
Sets out role, purpose,
responsibilities and powers of local governments.
The purposes of this Act
are as follows:
(a) to provide the legal
framework for an effective, efficient, environmentally responsible and open
system of local government in New South Wales,
(b) to regulate the
relationships between the people and bodies comprising the system of local
government in New South Wales,
(c) to encourage and assist
the effective participation of local communities in the affairs of local
government,
(d) to give councils:
• the ability to provide
goods, services and facilities, and to carry out activities, appropriate to
the current and future needs of local communities and of the wider public
• the responsibility for
administering some regulatory systems under this Act
• a role in the management,
improvement and development of the resources of their areas,
(e) to require councils,
councillors and council employees to have regard to the principles of
ecologically sustainable development in carrying out their responsibilities.
The land management
provisions of the Act require that Council prepare plans of management for
all community land. The plan of management identifies the management outcome
for the land category, performance indicators and performance measures to
meet the outcome identified.
|
|
Local Government Amendment
(Planning and Reporting) Act 2009
|
Local Government Amendment
(Planning and Reporting) Act 2009 includes the preparation of a long term
financial plan supported by asset management plans for sustainable service
delivery.
|
|
Disability Discriminations
Act, 1992
|
The Federal Disability
Discrimination Act 1992 (D.D.A.) provides protection for everyone in
Australia against discrimination based on disability. It encourages everyone
to be involved in implementing the Act and to share in the overall benefits
to the community and the economy that flow from participation by the widest
range of people.
(a) to eliminate, as far as
possible, discrimination against persons on the ground of disability in the areas of:
(i) work, accommodation, education, access to premises, clubs and sport; and
(ii) the provision of goods,
facilities, services and land; and
(iii) existing laws; and
(iv) the administration of Commonwealth
laws and programs; and
(b) to ensure, as far as
practicable, that persons with disabilities have the same rights to equality
before the law as the rest of the community; and
to promote recognition and
acceptance within the community of the principle that persons with
disabilities have the same fundamental rights as the rest of the community.
|
|
Work Health & Safety
Act 2011
|
Sets out roles and
responsibilities to secure the health, safety and welfare of persons at work
and covering injury management, emphasising rehabilitation of workers
particularly for return to work. Council is to provide a safe working
environment and supply equipment to ensure safety.
|
|
Environmental Planning and
Assessment Act 1979
|
An Act to institute a
system of environmental planning and assessment for the State of New South
Wales. Among other requirements the Act outlines the requirement for the
preparation of Local Environmental Plans (LEP), Development Control Plans
(DCP), Environmental Impact Assessments (EIA) and Environmental Impact
Statements.
|
|
Plant Protection Act 1989
|
This act sets out
requirements in respect to Flora Protection
|
|
Environmental Protection
Act 1994
|
This act sets out
requirements in respect to environmental protection
|
|
Threatened Species
Conservation Act, 1995
|
An Act to conserve
threatened species, populations and ecological communities of animals and plants.
Under the terms of this Act
Council is required to ensure the long term survival of the species
identified.
|
|
Rivers and Foreshores
Improvements Act, 1948
|
An Act to provide for the
carrying out of works for the removal of obstructions from and the improvement
of rivers and foreshores and the prevention of erosion of lands by tidal and
non-tidal waters
|
|
Protection of the
Environment Operations Act 1997
|
Council is required to
exercise due diligence to avoid environmental impact and among others are required
to develop operations emergency plans and due diligence plans to ensure that
procedures are in place to prevent or minimise pollution.
|
|
National Parks and Wildlife
Act (1974)
|
An Act relating to the
establishment, preservation and management of national parks, historic sites
and certain other areas and the protection of certain fauna, native plants
and Aboriginal objects
|
|
Native Vegetation Act 2003
|
This Act regulates the
clearing of native vegetation on all land in NSW, except for excluded land
listed in Schedule 1 of the Act. The Act outlines what landowners can and
cannot do in clearing native vegetation.
|
|
Public Works Act 1912
|
Sets out the role of
Council in the planning and construction of new assets.
|
|
Road Transport (General)
Act 2005
|
Provides for the
administration and enforcement of road transport legislation. It provides for
the review of decisions made under road transport legislation. It makes
provision for the use of vehicles on roads and road related areas and also
with respect to written off and wrecked vehicles.
|
|
Road Transport (Safety and
Traffic Management) Act 1999
|
Facilitates the adoption of
nationally consistent road rules in NSW, the Australian Road Rules. It also
makes provision for safety and traffic management on roads and road related
areas including alcohol and other drug use, speeding and other dangerous
driving, traffic control devices and vehicle safety accidents.
|
|
Roads Act 1993
|
Sets out rights of members
of the public to pass along public roads, establishes procedures for opening
and closing a public road, and provides for the classification of roads. It
also provides for declaration of the RTA and other public authorities as
roads authorities for both classified and unclassified roads, and confers
certain functions (in particular, the function of carrying out roadwork) on
the RTA and other roads authorities. Finally it provides for distribution of
functions conferred by this Act between the RTA and other roads authorities,
and regulates the carrying out of various activities on public roads.
|
|
Local Government (Highways)
Act 1982
|
An Act to consolidate with
amendments certain enactments concerning the functions of the corporations of
municipalities with respect to highways and certain other ways and places
open to the public.
|
|
NSW Road Rules 2008
|
A provision of road rules
that are based on the Australian Road Rules so as to ensure that the road
rules applicable in this State are substantially uniform with road rules
applicable elsewhere in Australia.
|
|
Valuation of Land Act 1916
|
This act sets out
requirements in respect Land Valuation
|
|
Crown Lands Act, 1989
|
An Act to provide for the
administration and management of Crown land in the Eastern and Central Division of the State of
NSW
Council has large holdings
of Crown land under it care, control and management.
|
|
Heritage Act, 1977
|
An Act to conserve the
environmental heritage of the State.
Several properties are
listed under the terms of the Act and attract a high level of maintenance
cost, approval and monitoring.
|
|
Building Code of Australia
|
The goal of the BCA is to
enable the achievement of nationally consistent, minimum necessary standards
of relevant, health, safety (including structural safety and safety from
fire), amenity and sustainability outcome efficiently.
|
|
Building Fire and Safety
Regulation 1991
|
This Act sets out the
regulations for things such as means of escape, Limitation of people in
buildings, Fire and evacuation plans and testing of special fire services and
installations.
|
|
Electrical Safety Act 2002
|
This act sets out the
installation, reporting and safe use with electricity
|
|
Building Regulation 2003
|
This act sets out
requirements in respect to Building Requirements
|
|
Plumbing and Drainage Act
2002
|
This act sets out
requirements in respect to Plumbing Requirements
|
|
Rural Fires Act, 1997
|
An Act to establish the NSW
Rural Fire Service and define its functions; to make provision for the
prevention, mitigation and suppression of rural fires.
Under the terms of this Act
Council is required to mitigate any fire that emanate from bushland.
|
|
Dangerous Goods Safety
Management Act 2001
|
This act sets out the safe
use, storage and disposal of dangerous goods
|
|
Fire and Rescue Service Act
1990
|
This act sets out
requirements in respect to Emergency Services for Fire and Rescue
|
|
Public Records Act 2002
|
This act sets out
requirements in respect maintaining Public Records
|
|
Surveillance Devices Act
|
This act sets out requirements
in respect use of Surveillance Devices
|
|
Civil Liability Act, 2002
|
An Act to make provision in
relation to the recovery of damages for death or personal
injury caused by the fault of a
person
|
|
Companion Animals Act, 1998
|
An Act to provide for the
identification and registration of companion
animals and for the duties and
responsibilities of their owners.
Under the terms of the Act
Council is required to provide and maintain at least one off leash area. It
currently has eleven areas identified as off leash.
|
|
Rural Fires Act, 1997
|
An Act to establish the NSW
Rural Fire Service and define its functions; to make provision for the
prevention, mitigation and suppression of rural fires.
Under the terms of this Act
Council is required to mitigate any fire that emanate from bushland.
|
13.2
- Attachment 3
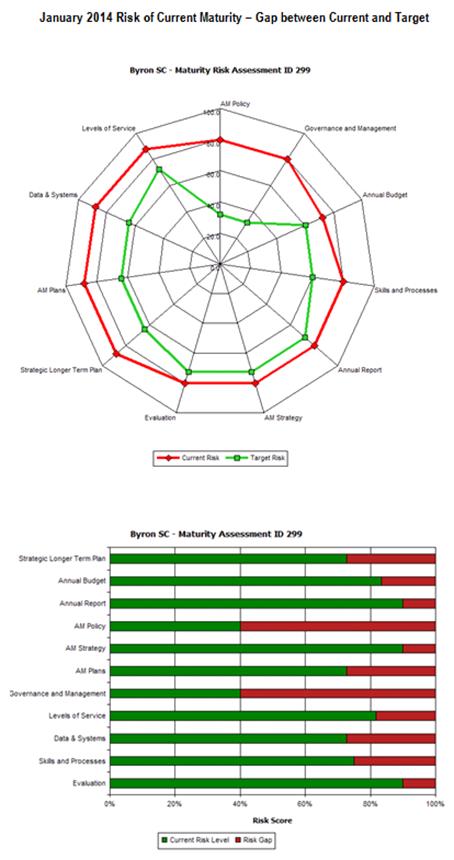
13.2
- Attachment 3
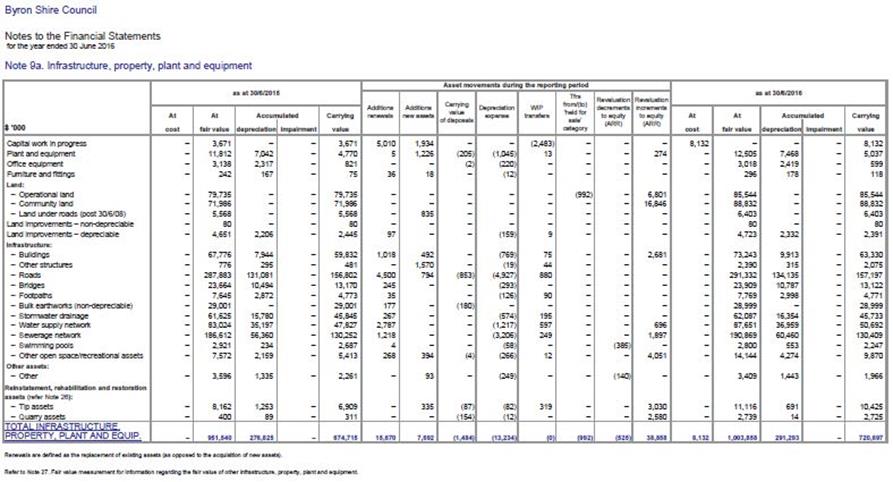
13.2
- Attachment 3
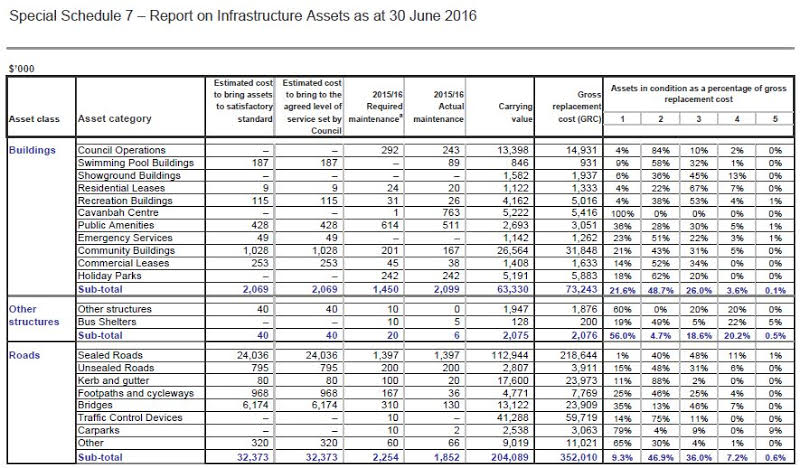
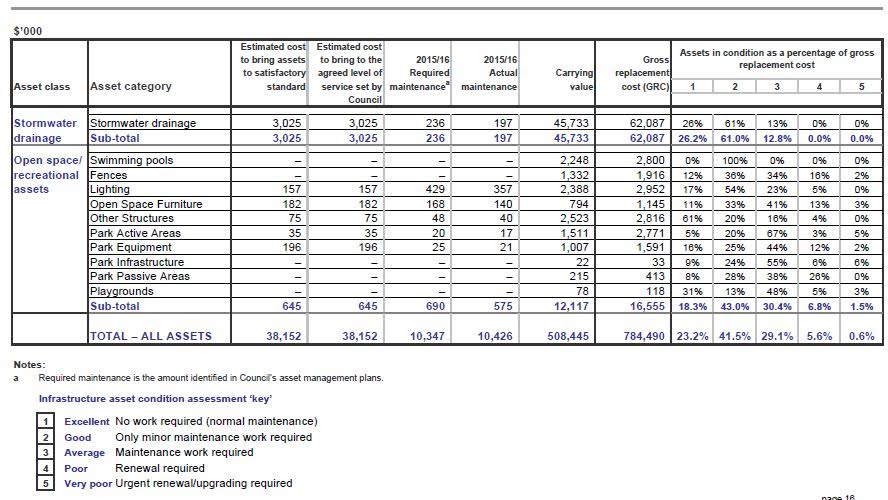
13.2
- Attachment 3
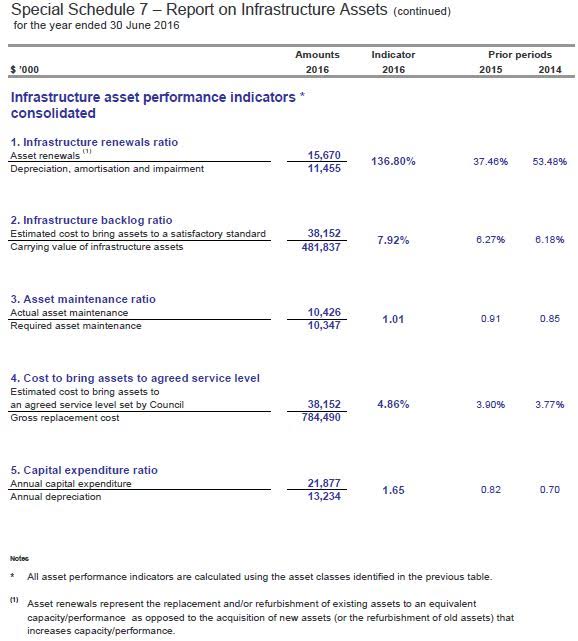
13.2
- Attachment 3
Executive
Summary
1.1 Introduction
This report summarises the methodology along with the
recommendations for the Special Schedule No.7 Report for Byron Shire Council
(BSC) for General Fund asset categories.
Infrastructure backlog needs to be defined to ensure
auditable and evidence based approach to measurement and reporting of the
backlog for the purposes of Special Schedule No. 7. Appropriately defining the
backlog will avoid theoretical and aspirational goals that the community cannot
afford. The International Infrastructure Management Manual (IIMM) does not
focus on “backlog”. It concentrates on minimising asset lifecycle cost for
service levels essential to strategic objectives while managing risk. The NSW
Integrated Planning and Reporting Manual (IPR) also focuses on managing
infrastructure services and risk does not mention “backlog”.
Engagement with communities on appropriate and affordable
service levels while managing risk is also a foundational principle of IPR,
encouraging councils to “engage the community in identifying the acceptable
level of service for each asset type in their Asset Management Plans.” Asset
Management Plans balanced to Long Term Financial Plans, annually reviewed in
accordance with the IPR manual are the key instrument to enable organisations
to provide sustainable services. At this point Council has not had the
opportunity to engage with the community on defined levels of service for each
asset category (or Asset Sub-Type). The calculations for Bring to Agreed levels
of Service and Bring Assets to a Satisfactory Standard are the same. In
September 2016, Council conducted an Asset Management Survey (E2016/85779) to
determine the communities’ priorities for management of Council’s assets. The
priorities are set out below and align well with the current technical levels
of service resource focus with available funds:
1. Urban
sealed roads 92%
2. Public
toilets 82%
3. Rural
sealed roads 77%
4. Footpaths
and cycleways 73%
5. Playgrounds
and parks 71%
6. Urban
Stormwater 61%
7. Rural
drainage (causeways and culverts) 60%
8. Bridges
and footbridges 56%
9. Rural
roads unsealed 41%
10. Bus
shelters 33%
For the purpose of this report “infrastructure
backlog” will be defined as “unfunded high residual risk associated
with assets essential to achieving Council’s Community Strategic Plan (CSP).
High risk assets not essential to Councils CSP should be disposed, closed or
reclassified and do not represent a financial sustainability risk.” This is
shown in table 1 and ensures backlog is aligned with Council’s asset management
plan in accordance with Australian Accounting Standards Board Code Update 24
and IPR manual.
For all the asset classes, except Buildings the asset
condition comes from the Authority Asset Register. Buildings condition data was
compiled from a desktop audit of the 97 community buildings with the Buildings
Maintenance Coordinator to determine average condition scores. Council did not
have sufficient resources to work with the 2015/16 APV revaluation ‘Remaining
Useful Life’ data to calculate and convert to condition scores 1 to 5.
Key Concepts
The key concepts for NSW Special Schedule 7 are:
1. The
report on the condition of public works (Special Schedule 7) should flow
directly from the Asset Register.
2. The
determination of satisfactory target service levels involves an informed
trade-off using the Long Term Financial Plan and Strategic Asset Management
Plan 10 year scenarios for revenues, risks and service levels. This approach is
consistently identified in the IPR Manual and expanded in complementary
resources such the IPWEA Level of Service and Community Engagement Practice
Note 8.
3. Cost
to bring assets to satisfactory should be determined by asset and risk
management plans. This guide recommends that the cost to bring to satisfactory
should be the total unfunded cost to renew all high residual risk assets in the
current risk register.
4. Special
Schedule 7 is auditable by checking for alignment between SS7 and asset and
risk management plans. The risk register establishes a consistent and evidence
based cost to bring to satisfactory and connects to good governance practice of
transparent reporting of risk through appropriate governance processes such as
an audit committee.
5. Asset
Risks include operational, technical, financial, legal, social and
environmental risks using the ISO 31000 framework. Supporting resources are
available and this methodology is consistently applied internationally. (Note
1)
Notes:
Note 1 – IPWEA NAMSPLUS – Asset and Risk Management Plan
Templates
Special
Schedule No. 7 Analysis Summary
3.1 Cost to Bring to Satisfactory
Previous reporting had set Council’s backlog at $29.4
million and this has been recalculated to $39,084 million for all
infrastructure categories to align with community expectation for affordable
levels of service. Previous backlog reporting included assets that didn’t need
renewal yet as well as upgrade items. This has been re aligned to reflect
actual current renewal need and high risk assets.
The change in reporting infrastructure backlog is due to the
revaluation of Parks and Other Structures, Swimming Pools and Buildings. For
more information refer to the individual Reporting Mythology Reports.
Additionally, Council has invested in the MyPredictor modelling software which
has identified backlog in Unsealed Roads which was not identified in the
2014/15 Transport Revaluations.
Table 1 shows the summary of the backlog results. Each
asset class has been reviewed with respect to asset condition and risk to
determine backlog in accordance with the methodology set out in this report.
The backlog represents the unfunded renewal cost of high risk assets in poor
condition.
Table 1 Cost to Bring to Satisfactory 2015/2016
|
Category
|
Sub Category
|
Description
|
BTS
$’000
|
|
Buildings
|
All Buildings
|
Maintenance and risk
remediation works is reactive. High risk items are funded when found -
additional funding for inspection and maintenance to move to more proactive
maintenance strategies
|
$2,069
|
|
Structures
|
Retaining Walls
|
Renew condition 4,5 or high
risk condition 3
|
$170
|
|
Structures
|
Fences
|
Renew condition 4 and 5
high risk fences
|
$338
|
|
Roads
|
Sealed Roads - Structure
|
Patch or renewal all
condition 4 and 5 road pavements derived from condition data and MyPredictor
Asset Modelling Software.
|
$24,036
|
|
Roads
|
Unsealed
|
Grading and re-sheeting
with gravel all condition 4 and 5 road pavements derived from condition data
and MyPredictor Asset Modelling Software.
|
$795
|
|
Roads
|
Bridges
|
Total Rectification Cost
based on Level 2 bridge inspection or equivalent of all condition 4 and
MyPredictor Asset Modelling Software.
|
$6,174
|
|
Roads
|
Bus Shelters
|
Comprehensive asset
condition assessment. Replace condition 4 and 5.
|
$270
|
|
Roads
|
Footpaths and Cycleways
|
High Risk Path Defect
Rectification. Replace high risk path concrete bays and grind where possible
|
$968
|
|
Roads
|
Kerb and Gutter
|
OCEAN SHORES renew high
risk sections
|
$80
|
|
Roads
|
Barriers
|
Full list of upgrade =
3,546,866. Complete safety audit and allocate $100,000 as the renewal
component for high criticality items. No claims no service requests.
Review next year.
|
$150
|
|
Stormwater Drainage
|
Causeways & Box
Culverts
|
Renew or repair all
causeways and culverts in condition 4 and 5
|
$3,025
|
|
Stormwater Drainage
|
Stormwater
|
No high risk pipes and pits
- high risk items included in box culverts
|
$0
|
|
Parks
|
Recreation Facilities
|
Complete asset condition
inspection in 2016. Renew condition 4 and 5 park assets that are considered
high risk.
|
$223
|
|
Parks
|
Play Equipment
|
Complete asset condition
inspection in 2016. Renew condition 4 and 5 park assets that are considered
high risk.
|
$196
|
|
Parks
|
Park Furniture
|
Complete asset condition
inspection in 2016. Renew condition 4 and 5 park assets that are considered
high risk.
|
$182
|
|
Parks
|
Park Shelters
|
Complete asset condition
inspection in 2016. Renew condition 4 and 5 park assets that are considered
high risk.
|
$63
|
|
Parks
|
Hard Scape
|
Complete asset condition
inspection in 2016. Renew condition 4 and 5 park assets that are considered
high risk.
|
$101
|
|
Parks
|
Park & Sports Field
Lighting
|
Complete asset condition
inspection in 2016. Renew condition 4 and 5 park assets that are considered
high risk.
|
$157
|
|
Parks
|
Grandstands
|
Complete asset condition
inspection in 2016. Renew condition 4 and 5 park assets that are considered
high risk.
|
$12
|
|
Parks
|
Sports Equipment
|
Complete asset condition
inspection in 2016. Renew condition 4 and 5 park assets that are considered
high risk.
|
$35
|
|
|
|
|
$39,084
|
3.2 Actual Annual Maintenance
The total Actual Annual Maintenance is $5,142 million.
The calculation of the actual Annual Maintenance has been undertaken using the
Work Orders module from Council’s Authority system for the following asset
categories:
· Swimming Pool Buildings & Pools
· Showground Buildings
· Residential Leases
· Recreation Buildings & Recreation Leases
· Public Amenities
· Emergency Services
· Council Operations
· Community Buildings & Community Leases
· Commercial Leases
· Fences and Screens
· Other Structures
· Sealed Road Surface
· Unsealed Roads
· Kerb and gutter
· Footpaths and cycleways
· Bus Shelters
· Footbridges
· Bridges
· Traffic Control Devices
· Retaining Walls
· Open Carparks
· Roadside Barriers
· Recreation Facilities
· Play equipment
· Park Furniture
· Park Shelters
· Hardscape
· Park & Sportsfield Lighting
· Grandstands
· Sports Equipment
· Rural Drainage
· Urban Stormwater
The calculation of the Actual Annual Maintenance for the
Cavanbah Centre was calculated out of the General Ledger as it does not reside
in Work Orders module at this point in time.
3.3 Cost to Maintain at Satisfactory
The total cost to maintain Council’s assets at satisfactory
condition is $5,248 million. The cost to maintain at satisfactory
has been assessed from the documented cost to provide the additional
maintenance on critical risk assets where renewal is being deferred.
The defined maintenance intervention levels are document in
Council’s Infrastructure Services Risk Management Procedures for Transport.
Through the use of Council’s Inspections and Defects software ‘Reflect’ Council
is not achieving defined response times and performance targets with available
maintenance funds for the transport network.
The cost to maintain satisfactory are aligned with the
additional maintenance requirements for critical assets in the Risk Register
and are summarised below.
The calculations of for the building asset category were
used from the draft Building Asset Management plan which has predicted trend
line maintenance with 10 year forward projections. This equates to a 20%
increase for the 2015/16 posting year.
Based off the high percentage of poor condition data a 20%
increase has been applied to the Actual Annual Maintenance for the following
categories:
· Kerb and Gutter
· Footpaths/Cycleways
· Fences
· Bus Shelters
· Footbridges
· Traffic Control Devices
· Retaining Walls
· Open Car Parks
· Roadside Barriers
· Recreation Facilities
· Play Equipment
· Park Furniture
· Park Shelters
· Hardscape
· Park & Sports Field Lights
· Sports Equipment
· Urban Stormwater
· Rural Drainage
Council has implemented MyPredictor asset modelling
software. It has applied modelling strategies to calculate the cost to maintain
satisfactory on the following asset categories:
· Sealed Roads
· Unsealed Roads
· Bridges
The calculation of the maintenance required for sealed roads
manages the road surface and road structure as one asset category. Council has
laser condition data parameters for rutting, roughness and texture in 2010 and
2015. By using these parameters, treatment types and unit rates the software
calculates the maintenance and capital budget required to achieve a holding OCI
(overall condition index) score of 3 over 10 years.
13.2
- Attachment 3
Annual service cost (ASC)
1) Reporting actual cost
The annual (accrual) cost of providing a
service including operations, maintenance, depreciation, finance/opportunity
and disposal costs less revenue.
2) For investment analysis and budgeting
An estimate of the cost that would be
tendered, per annum, if tenders were called for the supply of a service to a
performance specification for a fixed term. The Annual Service Cost includes
operations, maintenance, depreciation, finance/ opportunity and disposal costs,
less revenue.
Asset
A resource controlled by an
entity as a result of past events and from which future economic benefits are
expected to flow to the entity. Infrastructure assets are a sub-class of
property, plant and equipment which are non-current assets with a life greater
than 12 months and enable services to be provided.
Asset category
Sub-group of assets within a
class hierarchy for financial reporting and management purposes.
Asset class
A group of assets having a similar
nature or function in the operations of an entity, and which, for purposes of
disclosure, is shown as a single item without supplementary disclosure.
Asset condition assessment
The process of continuous or
periodic inspection, assessment, measurement and interpretation of the
resultant data to indicate the condition of a specific asset so as to determine
the need for some preventative or remedial action.
Asset hierarchy
A framework for segmenting an
asset base into appropriate classifications. The asset hierarchy can be based
on asset function or asset type or a combination of the two.
Asset management (AM)
The combination of
management, financial, economic, engineering and other practices applied to
physical assets with the objective of providing the required level of service
in the most cost effective manner.
Asset renewal funding
ratio
The ratio of the
net present value of asset renewal funding accommodated over a 10 year period
in a long term financial plan relative to the net present value of projected
capital renewal expenditures identified in an asset management plan for the
same period [AIFMG Financial Sustainability Indicator No 8].
Average annual asset
consumption (AAAC)*
The amount of an
organisation’s asset base consumed during a reporting period (generally a
year). This may be calculated by dividing the depreciable amount by the useful
life (or total future economic benefits/service potential) and totalled for
each and every asset OR by dividing the carrying amount (depreciated replacement
cost) by the remaining useful life (or remaining future economic
benefits/service potential) and totalled for each and every asset in an asset
category or class.
Borrowings
A borrowing or loan is a
contractual obligation of the borrowing entity to deliver cash or another
financial asset to the lending entity over a specified period of time or at a
specified point in time, to cover both the initial capital provided and the
cost of the interest incurred for providing this capital. A borrowing or loan
provides the means for the borrowing entity to finance outlays (typically
physical assets) when it has insufficient funds of its own to do so, and for
the lending entity to make a financial return, normally in the form of interest
revenue, on the funding provided.
Capital expenditure
Relatively large (material)
expenditure, which has benefits, expected to last for more than 12 months.
Capital expenditure includes renewal, expansion and upgrade. Where capital
projects involve a combination of renewal, expansion and/or upgrade
expenditures, the total project cost needs to be allocated accordingly.
Capital expenditure -
expansion
Expenditure that extends the
capacity of an existing asset to provide benefits, at the same standard as is
currently enjoyed by existing beneficiaries, to a new group of users. It is
discretionary expenditure, which increases future operations and maintenance
costs, because it increases the organisation’s asset base, but may be
associated with additional revenue from the new user group, eg. extending a
drainage or road network, the provision of an oval or park in a new suburb for
new residents.
Capital expenditure - new
Expenditure which creates a
new asset providing a new service/output that did not exist beforehand. As it
increases service potential it may impact revenue and will increase future
operations and maintenance expenditure.
Capital expenditure -
renewal
Expenditure on an existing
asset or on replacing an existing asset, which returns the service capability
of the asset up to that which it had originally. It is periodically required
expenditure, relatively large (material) in value compared with the value of
the components or sub-components of the asset being renewed. As it reinstates
existing service potential, it generally has no impact on revenue, but may
reduce future operations and maintenance expenditure if completed at the
optimum time, eg. resurfacing or resheeting a material part of a road network,
replacing a material section of a drainage network with pipes of the same capacity,
resurfacing an oval.
Capital expenditure -
upgrade
Expenditure, which enhances
an existing asset to provide a higher level of service or expenditure that will
increase the life of the asset beyond that which it had originally. Upgrade
expenditure is discretionary and often does not result in additional revenue
unless direct user charges apply. It will increase operations and maintenance
expenditure in the future because of the increase in the organisation’s asset
base, eg. widening the sealed area of an existing road, replacing drainage
pipes with pipes of a greater capacity, enlarging a grandstand at a sporting
facility.
Capital funding
Funding to pay for capital
expenditure.
Capital grants
Monies received generally
tied to the specific projects for which they are granted, which are often
upgrade and/or expansion or new investment proposals.
Capital investment
expenditure
See capital expenditure
definition
Capitalisation threshold
The value of expenditure on
non-current assets above which the expenditure is recognised as capital
expenditure and below which the expenditure is charged as an expense in the
year of acquisition.
Carrying amount
The amount at which an asset
is recognised after deducting any accumulated depreciation / amortisation and
accumulated impairment losses thereon.
Class of assets
See asset class definition
Component
Specific parts of an asset
having independent physical or functional identity and having specific
attributes such as different life expectancy, maintenance regimes, risk or
criticality.
Core asset management
Asset management which relies
primarily on the use of an asset register, maintenance management systems, job
resource management, inventory control, condition assessment, simple risk
assessment and defined levels of service, in order to establish alternative
treatment options and long-term cashflow predictions. Priorities are usually
established on the basis of financial return gained by carrying out the work
(rather than detailed risk analysis and optimised decision- making).
Cost of an asset
The amount of cash or cash
equivalents paid or the fair value of the consideration given to acquire an
asset at the time of its acquisition or construction, including any costs
necessary to place the asset into service. This includes one-off design and
project management costs.
Critical assets
Assets for which the
financial, business or service level consequences of failure are sufficiently
severe to justify proactive inspection and rehabilitation. Critical assets have
a lower threshold for action than noncritical assets.
Current replacement cost
(CRC)
The cost the entity would
incur to acquire the asset on the reporting date. The cost is measured by
reference to the lowest cost at which the gross future economic benefits could
be obtained in the normal course of business or the minimum it would cost, to
replace the existing asset with a technologically modern equivalent new asset
(not a second hand one) with the same economic benefits (gross service
potential) allowing for any differences in the quantity and quality of output
and in operating costs.
Deferred maintenance
The shortfall in
rehabilitation work undertaken relative to that required to maintain the
service potential of an asset.
Depreciable amount
The cost of an asset, or
other amount substituted for its cost, less its residual value.
Depreciated replacement
cost (DRC)
The current replacement cost
(CRC) of an asset less, where applicable, accumulated depreciation calculated
on the basis of such cost to reflect the already consumed or expired future
economic benefits of the asset.
Depreciation /
amortisation
The systematic allocation of
the depreciable amount (service potential) of an asset over its useful life.
Economic life
See useful life definition.
Expenditure
The spending of money on
goods and services. Expenditure includes recurrent and capital outlays.
Expenses
Decreases in economic benefits during the accounting period in the
form of outflows or depletions of assets or increases in liabilities that
result in decreases in equity, other than those relating to distributions to
equity participants.
Fair value
The amount for which an asset
could be exchanged, or a liability settled, between knowledgeable, willing
parties, in an arms length transaction.
Financing gap
A financing gap exists
whenever an entity has insufficient capacity to finance asset renewal and other
expenditure necessary to be able to appropriately maintain the range and level
of services its existing asset stock was originally designed and intended to
deliver. The service capability of the existing asset stock should be
determined assuming no additional operating revenue, productivity improvements,
or net financial liabilities above levels currently planned or projected. A
current financing gap means service levels have already or are currently
falling. A projected financing gap if not addressed will result in a future
diminution of existing service levels.
Heritage asset
An asset with historic,
artistic, scientific, technological, geographical or environmental qualities
that is held and maintained principally for its contribution to knowledge and
culture and this purpose is central to the objectives of the entity holding it.
Impairment Loss
The amount by which the
carrying amount of an asset exceeds its recoverable amount.
Infrastructure assets
Physical assets that contribute
to meeting the needs of organisations or the need for access to major economic
and social facilities and services, eg. roads, drainage, footpaths and
cycleways. These are typically large, interconnected networks or portfolios of
composite assets. The components of these assets may be separately maintained,
renewed or replaced individually so that the required level and standard of
service from the network of assets is continuously sustained. Generally the
components and hence the assets have long lives. They are fixed in place and
are often have no separate market value.
Investment property
Property held to earn rentals
or for capital appreciation or both, rather than for:
(a) use in the production or supply of goods or
services or for administrative purposes; or
(b) sale in the ordinary
course of business.
Key performance indicator
A qualitative or quantitative
measure of a service or activity used to compare actual performance against a
standard or other target. Performance indicators commonly relate to statutory
limits, safety, responsiveness, cost, comfort, asset performance, reliability,
efficiency, environmental protection and customer satisfaction.
Level of service
The defined service quality
for a particular service/activity against which service performance may be
measured. Service levels usually relate to quality, quantity, reliability,
responsiveness, environmental impact, acceptability and cost.
Life Cycle Cost *
1. Total LCC The total cost of
an asset throughout its life including planning, design, construction,
acquisition, operation, maintenance, rehabilitation and disposal costs.
2. Average LCC The life cycle
cost (LCC) is average cost to provide the service over the longest asset life cycle. It comprises average operations, maintenance expenditure
plus asset consumption expense, represented by depreciation expense projected
over 10 years. The Life Cycle Cost does not indicate the funds required to
provide the service in a particular year.
Life Cycle Expenditure
The Life Cycle Expenditure (LCE) is the average
operations, maintenance and capital renewal expenditure accommodated in the
long term financial plan over 10 years. Life Cycle Expenditure may be compared
to average Life Cycle Cost to give an initial indicator of affordability of
projected service levels when considered with asset age profiles.
Loans / borrowings
See borrowings.
Maintenance
All actions necessary for
retaining an asset as near as practicable to an appropriate service condition,
including regular ongoing day-to-day work necessary to keep assets operating,
eg road patching but excluding rehabilitation or renewal. It is operating
expenditure required to ensure that the asset reaches its expected useful life.
• Planned maintenance
Repair
work that is identified and managed through a maintenance management system
(MMS). MMS activities include inspection, assessing the condition against
failure/breakdown criteria/experience, prioritising scheduling, actioning the
work and reporting what was done to develop a maintenance history and improve
maintenance and service delivery performance.
• Reactive maintenance
Unplanned
repair work that is carried out in response to service requests and management/
supervisory directions.
• Specific maintenance
Maintenance
work to repair components or replace sub-components that needs to be identified
as a specific maintenance item in the maintenance budget.
• Unplanned maintenance
Corrective
work required in the short-term to restore an asset to working condition so it
can continue to deliver the required service or to maintain its level of
security and integrity.
Maintenance expenditure *
Recurrent expenditure, which
is periodically or regularly required as part of the anticipated schedule of
works required to ensure that the asset achieves its useful life and provides
the required level of service. It is expenditure, which was anticipated in
determining the asset’s useful life.
Materiality
The notion of materiality
guides the margin of error acceptable, the degree of precision required and the
extent of the disclosure required when preparing general purpose financial
reports. Information is material if its omission, misstatement or
non-disclosure has the potential, individually or collectively, to influence
the economic decisions of users taken on the basis of the financial report or
affect the discharge of accountability by the management or governing body of
the entity.
Modern equivalent asset
Assets that
replicate what is in existence with the most cost-effective asset performing
the same level of service. It is the most cost efficient, currently available
asset which will provide the same stream of services as the existing asset is
capable of producing. It allows for technology changes and, improvements and
efficiencies in production and installation techniques
Net present value (NPV)
The value to the organisation
of the cash flows associated with an asset, liability, activity or event
calculated using a discount rate to reflect the time value of money. It is the
net amount of discounted total cash inflows after deducting the value of the
discounted total cash outflows arising from eg the continued use and subsequent
disposal of the asset after deducting the value of the discounted total cash
outflows.
Non-revenue generating
investments
Investments for the provision
of goods and services to sustain or improve services to the community that are
not expected to generate any savings or revenue to the Council, eg. parks and
playgrounds, footpaths, roads and bridges, libraries, etc.
Operations
Regular activities to provide
services such as public health, safety and amenity, eg street sweeping, grass
mowing and street lighting.
Operating expenditure
Recurrent expenditure, which
is continuously required to provide a service. In common use the term typically
includes, eg power, fuel, staff, plant equipment, on-costs and overheads but
excludes maintenance and depreciation. Maintenance and depreciation is on the
other hand included in operating expenses.
Operating expense
The gross outflow of economic
benefits, being cash and non cash items, during the period arising in the
course of ordinary activities of an entity when those outflows result in
decreases in equity, other than decreases relating to distributions to equity
participants.
Operating expenses
Recurrent expenses
continuously required to provide a service, including power, fuel, staff, plant
equipment, maintenance, depreciation, on-costs and overheads.
Operations, maintenance
and renewal financing ratio
Ratio of estimated budget to
projected expenditure for operations, maintenance and renewal of assets over a
defined time (eg 5, 10 and 15 years).
Operations, maintenance
and renewal gap
Difference between budgeted
expenditures in a long term financial plan (or estimated future budgets in
absence of a long term financial plan) and projected expenditures for
operations, maintenance and renewal of assets to achieve/maintain specified
service levels, totalled over a defined time (e.g. 5, 10 and 15 years).
Pavement management system
(PMS)
A systematic process for
measuring and predicting the condition of road pavements and wearing surfaces
over time and recommending corrective actions.
PMS Score
A measure of condition of a
road segment determined from a Pavement Management System.
Rate of annual asset
consumption *
The ratio of annual asset
consumption relative to the depreciable amount of the assets. It measures the
amount of the consumable parts of assets that are consumed in a period
(depreciation) expressed as a percentage of the depreciable amount.
Rate of annual asset
renewal *
The ratio of asset renewal
and replacement expenditure relative to depreciable amount for a period. It
measures whether assets are being replaced at the rate they are wearing out
with capital renewal expenditure expressed as a percentage of depreciable amount
(capital renewal expenditure/DA).
Rate of annual asset
upgrade/new *
A measure of the rate at
which assets are being upgraded and expanded per annum with capital upgrade/new
expenditure expressed as a percentage of depreciable amount (capital upgrade/expansion
expenditure/DA).
Recoverable amount
The higher of an asset's fair
value, less costs to sell and its value in use.
Recurrent expenditure
Relatively small (immaterial)
expenditure or that which has benefits expected to last less than 12 months.
Recurrent expenditure includes operations and maintenance expenditure.
Recurrent funding
Funding to pay for recurrent
expenditure.
Rehabilitation
See capital renewal
expenditure definition above.
Remaining useful life
The time remaining until an
asset ceases to provide the required service level or economic usefulness. Age
plus remaining useful life is useful life.
Renewal
See capital renewal
expenditure definition above.
Residual value
The estimated amount that an
entity would currently obtain from disposal of the asset, after deducting the
estimated costs of disposal, if the asset were already of the age and in the
condition expected at the end of its useful life.
Revenue generating
investments
Investments for the provision
of goods and services to sustain or improve services to the community that are
expected to generate some savings or revenue to offset operating costs, eg
public halls and theatres, childcare centres, sporting and recreation
facilities, tourist information centres, etc.
Risk management
The application of a formal
process to the range of possible values relating to key factors associated with
a risk in order to determine the resultant ranges of outcomes and their
probability of occurrence.
Section or segment
A self-contained part or
piece of an infrastructure asset.
Service potential
The total future service
capacity of an asset. It is normally determined by reference to the operating
capacity and economic life of an asset. A measure of service potential is used
in the not-for-profit sector/public sector to value assets, particularly those
not producing a cash flow.
Service potential
remaining
A measure of the future
economic benefits remaining in assets. It may be expressed in dollar values
(Fair Value) or as a percentage of total anticipated future economic benefits.
It is also a measure of the percentage of the asset’s potential to provide
services that is still available for use in providing services (Depreciated
Replacement Cost/Depreciable Amount).
Specific Maintenance
Replacement of higher value
components/sub-components of assets that is undertaken on a regular cycle
including repainting, replacement of air conditioning equipment, etc. This
work generally falls below the capital/ maintenance threshold and needs to be
identified in a specific maintenance budget allocation.
Strategic Longer-Term Plan
A plan covering the term of
office of councillors (4 years minimum) reflecting the needs of the community
for the foreseeable future. It brings together the detailed requirements in the
Council’s longer-term plans such as the asset management plan and the long-term
financial plan. The plan is prepared in consultation with the community and
details where the Council is at that point in time, where it wants to go, how
it is going to get there, mechanisms for monitoring the achievement of the
outcomes and how the plan will be resourced.
Sub-component
Smaller individual parts that
make up a component part.
Useful life
Either:
(a) the period over which an asset is expected to be
available for use by an entity, or
(b) the number of production or similar units expected
to be obtained from the asset by the entity.
It is estimated or expected
time between placing the asset into service and removing it from service, or
the estimated period of time over which the future economic benefits embodied
in a depreciable asset, are expected to be consumed by the Council.
Value in Use
The present value of future
cash flows expected to be derived from an asset or cash generating unit. It is
deemed to be depreciated replacement cost (DRC) for those assets whose future
economic benefits are not primarily dependent on the asset's ability to
generate net cash inflows, where the entity would, if deprived of the asset,
replace its remaining future economic benefits.
Source: IPWEA, 2009,
Glossary