Public ATTACHMENTS
EXCLUDED FROM THE
Extraordinary
Meeting
AGENDA
OF 29 June 2016
4. Staff Reports
Corporate and Community Services
4.1 2016/17
Operational Plan
Attachment
2... FINAL 2016-2017 Operational Plan (for adoption 29 June 2016)............. 2
Attachment
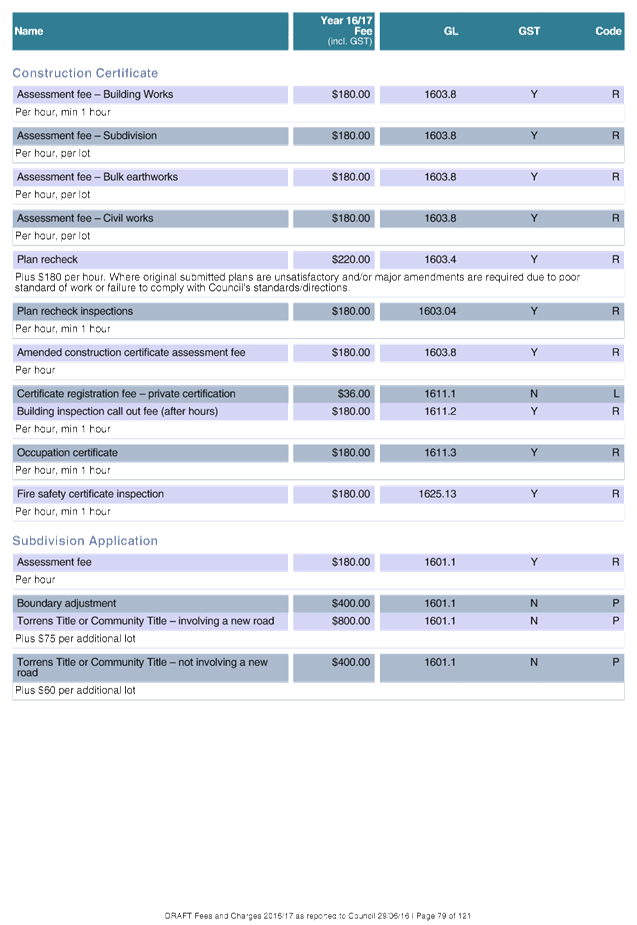
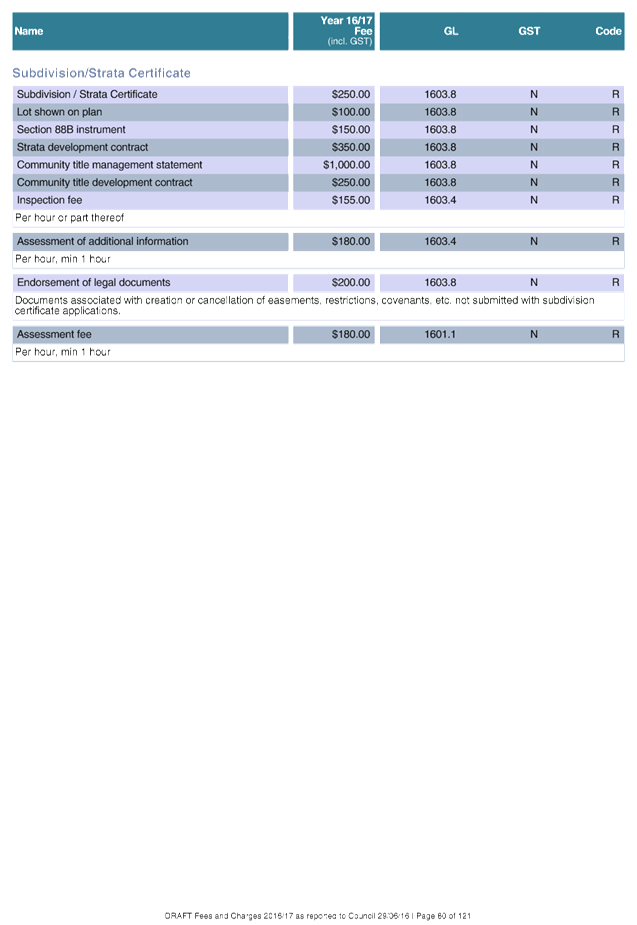
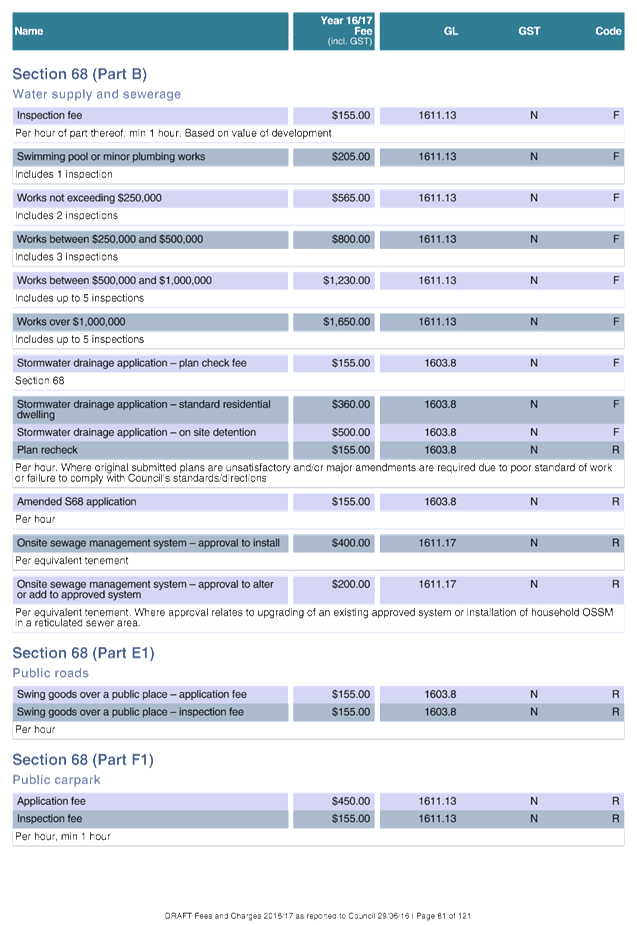
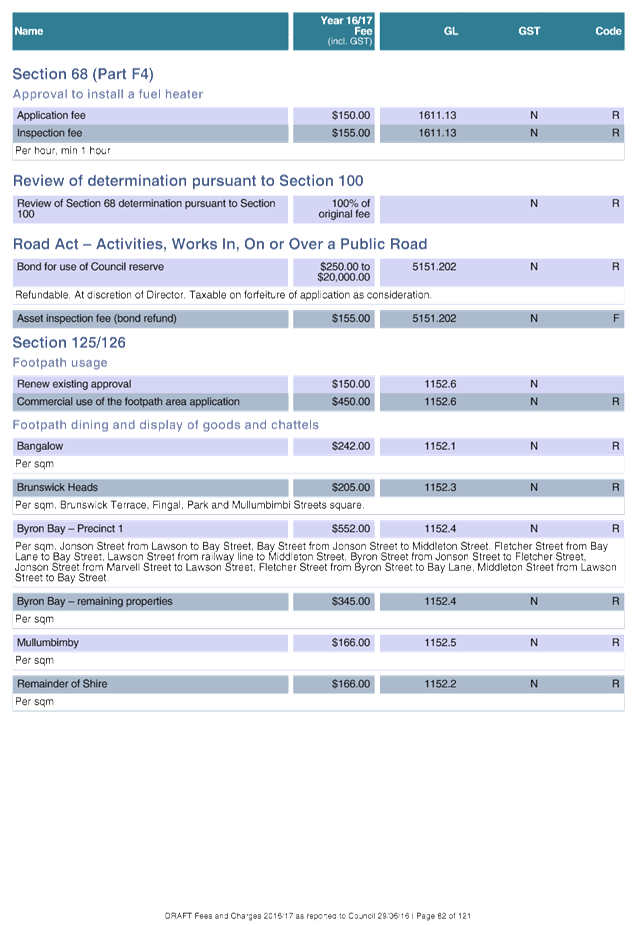
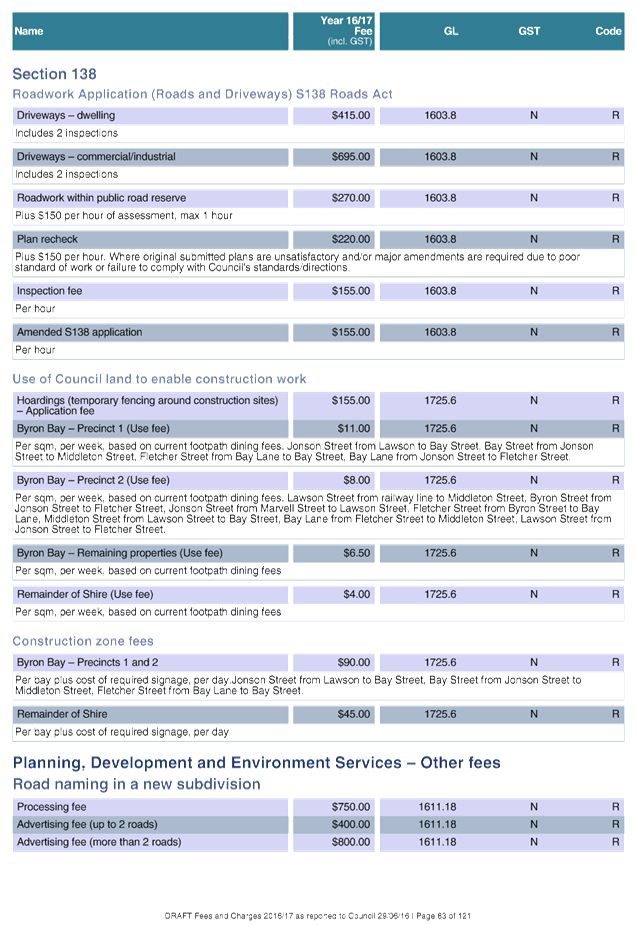
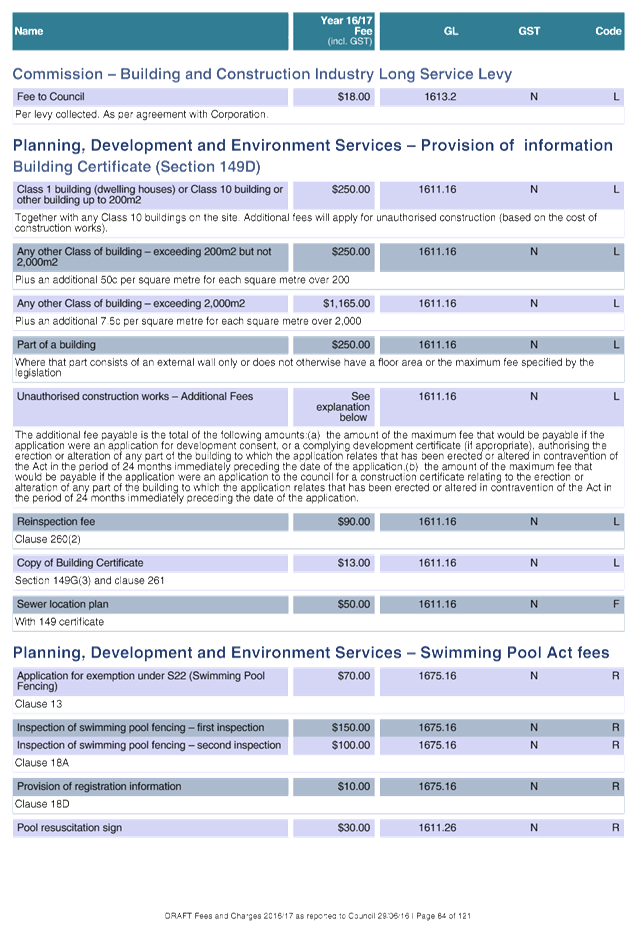
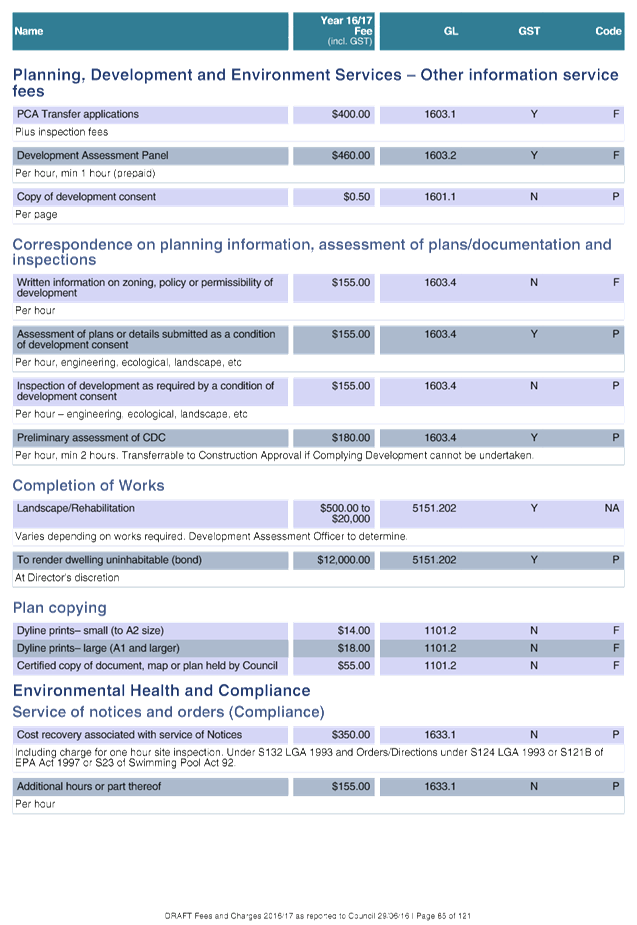
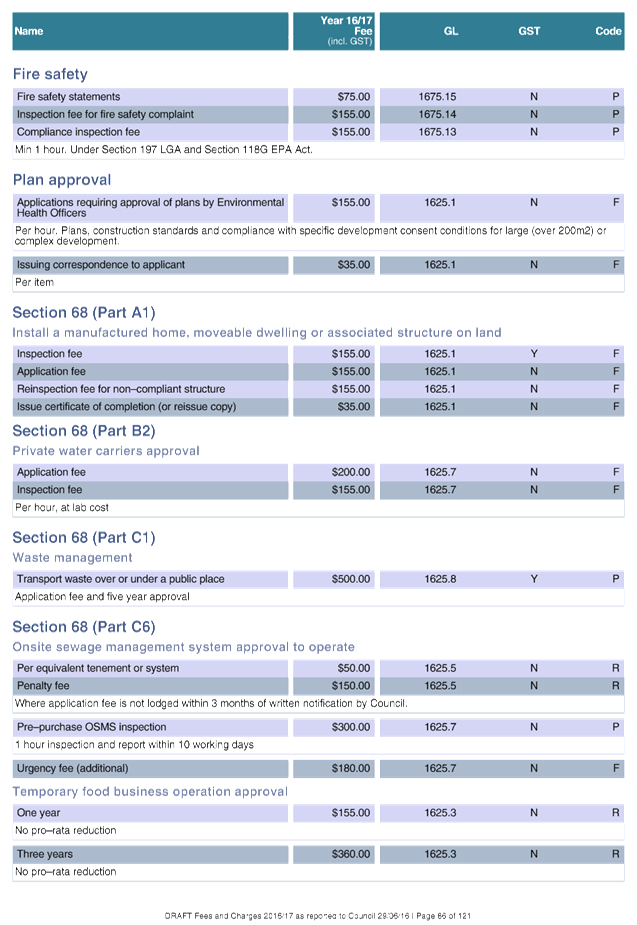
3... Draft 2016/17 Fees and Charges presented to Council 29 June 2016... 58
Sustainable Environment and Economy
4.3 Draft
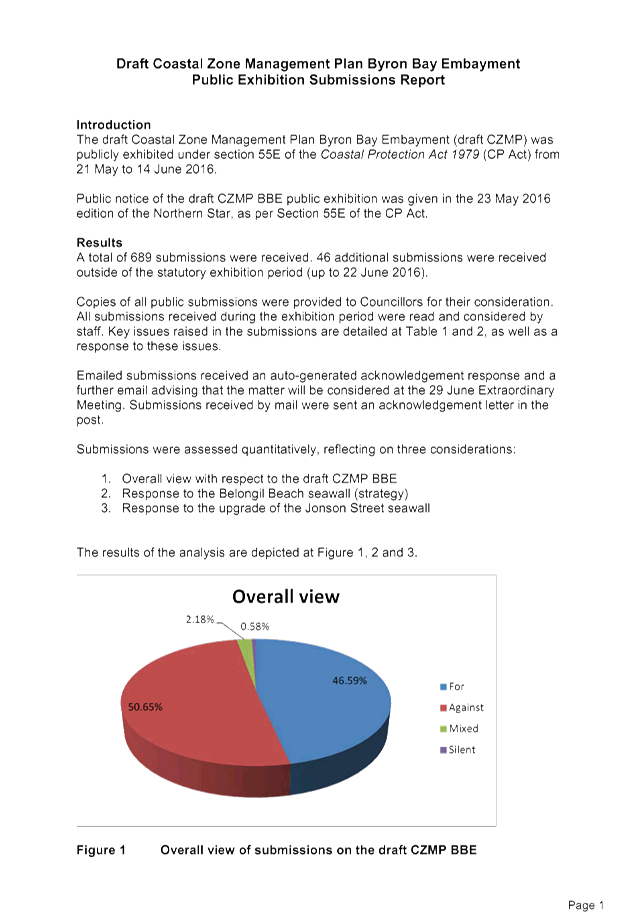
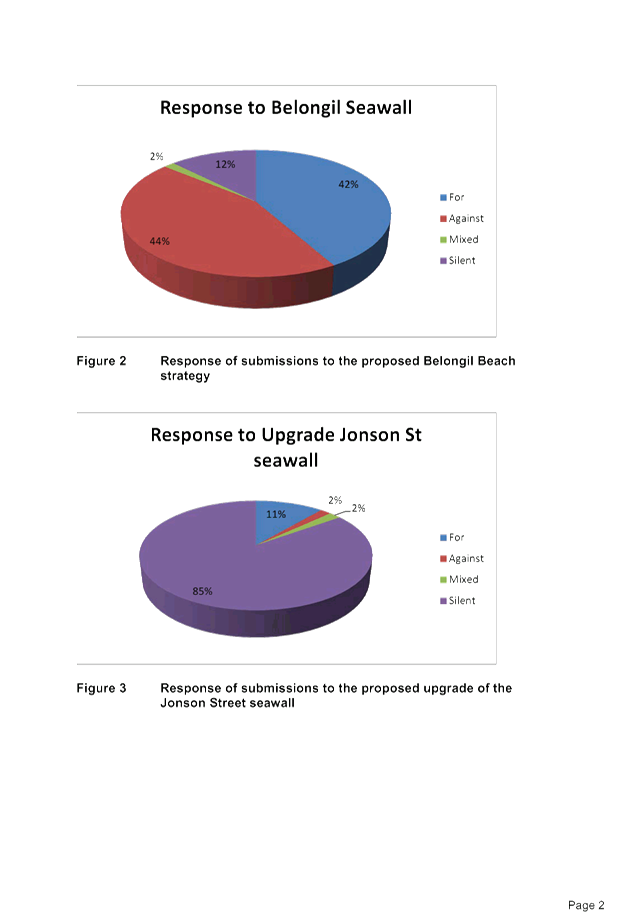
Coastal Zone Management Plan Byron Bay Embayment - Public Exhibition
Attachment
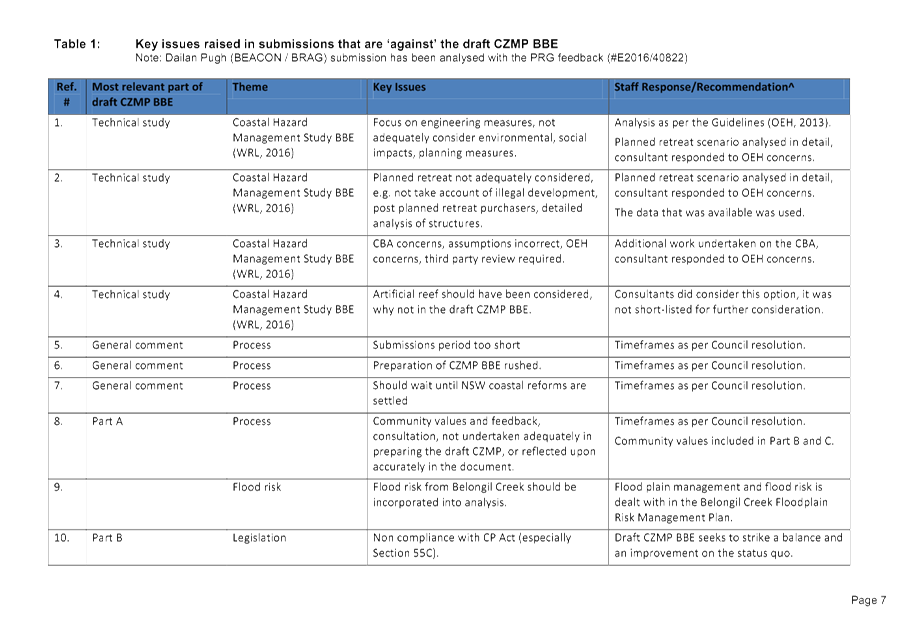
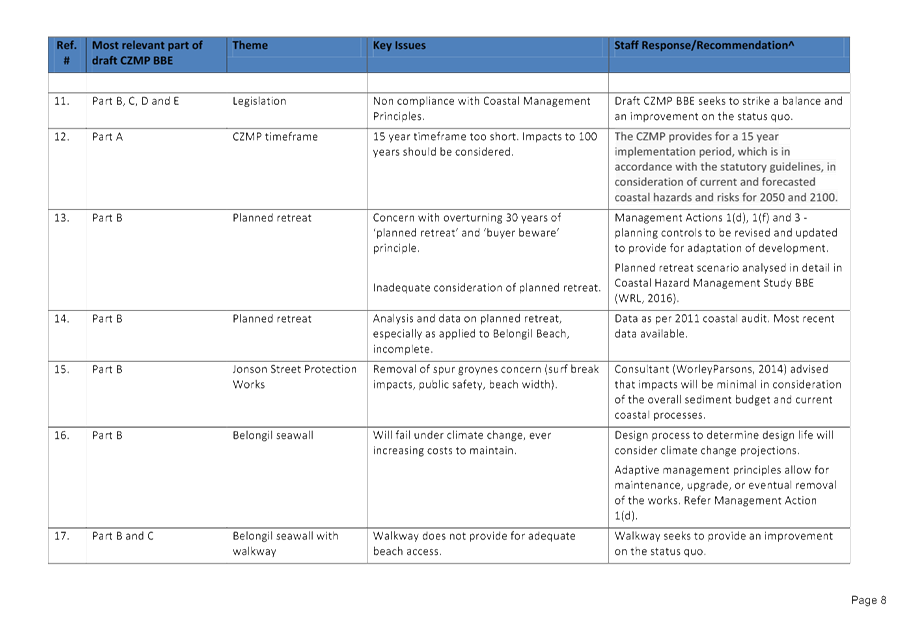
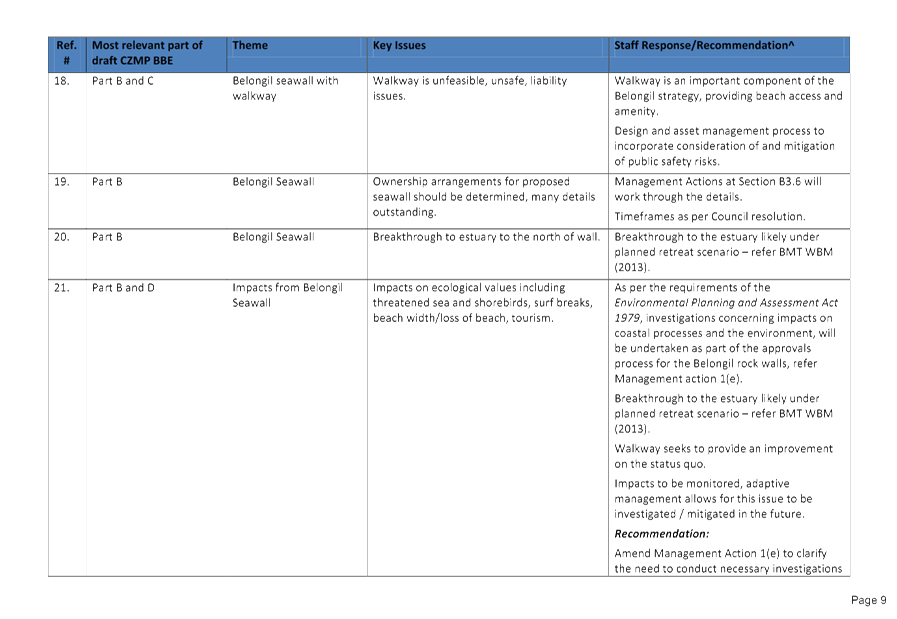
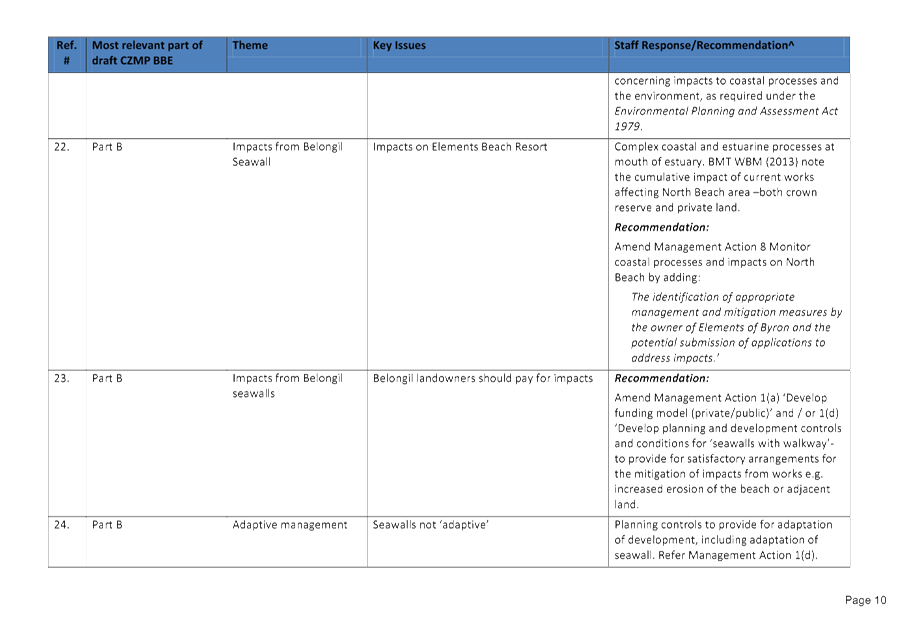
1... Exhibition Submissions Report - Draft CZMP BBE.............................. 179
Attachment
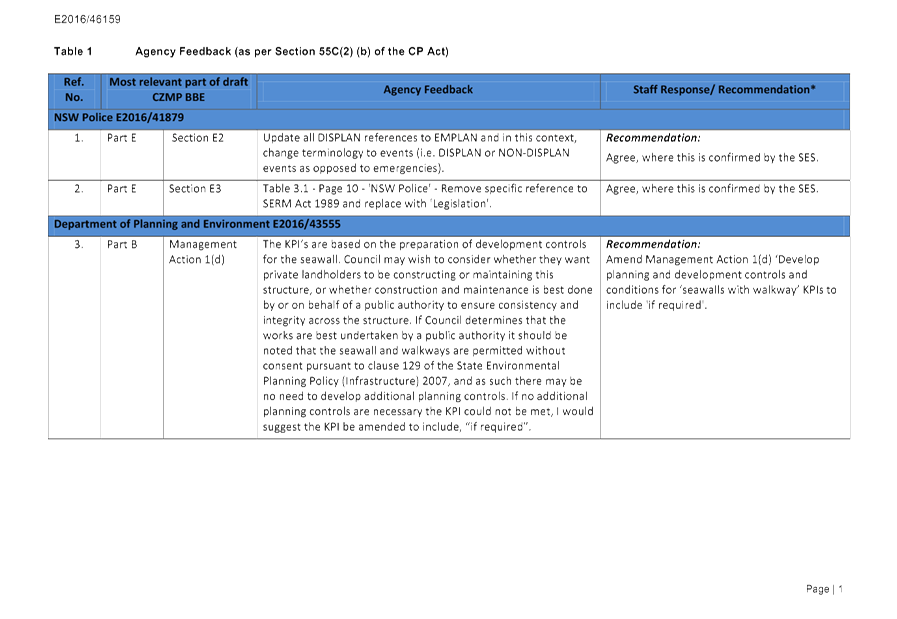
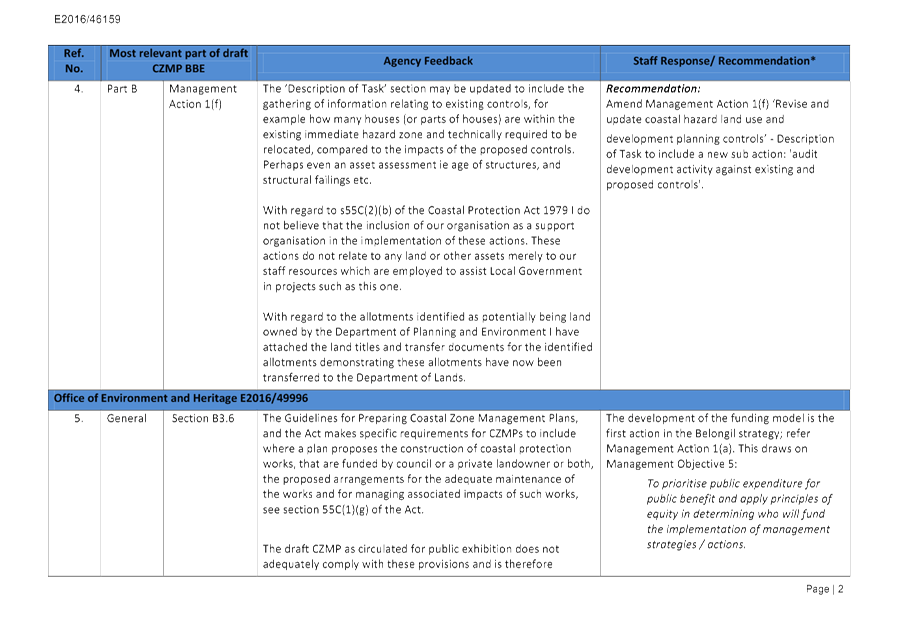
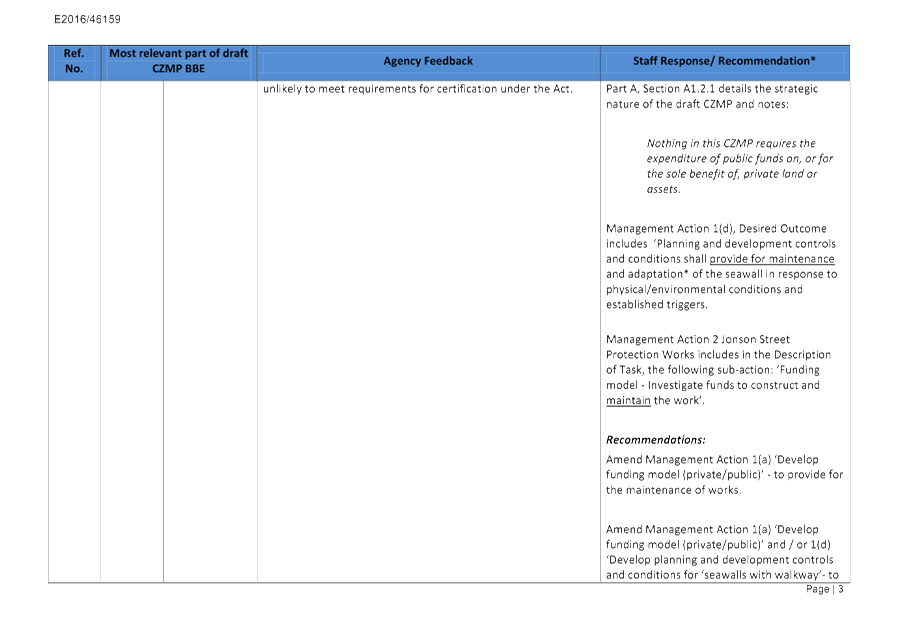
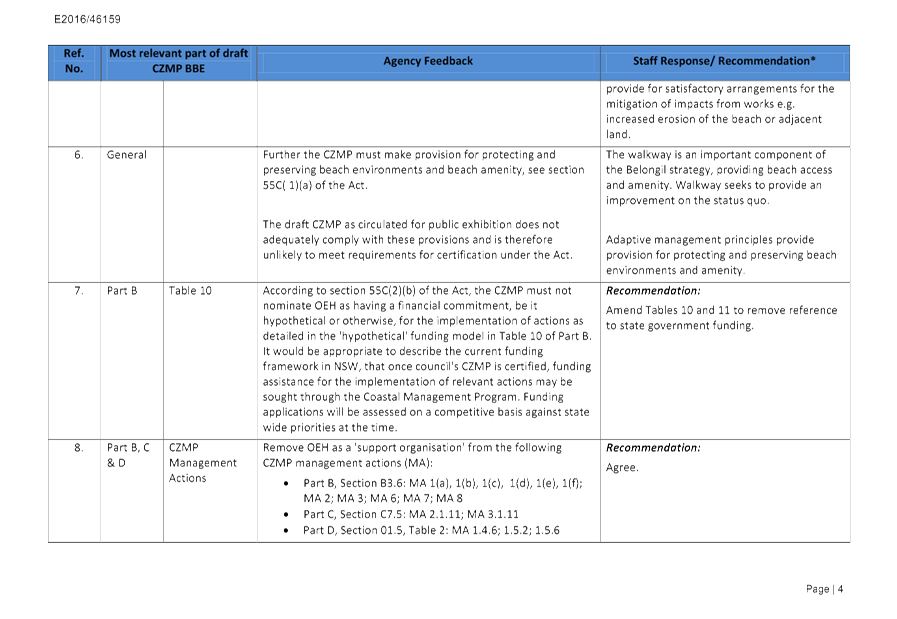
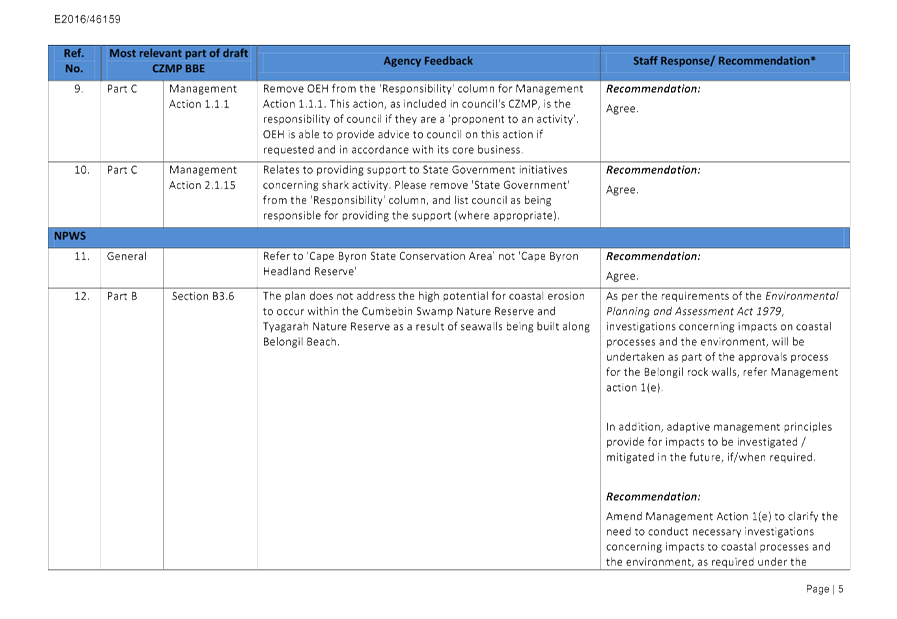
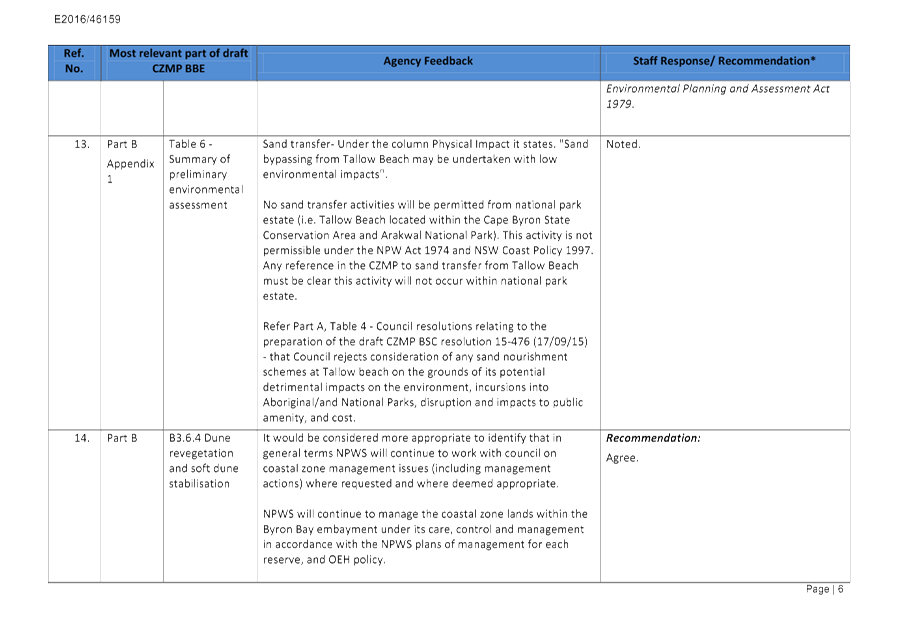
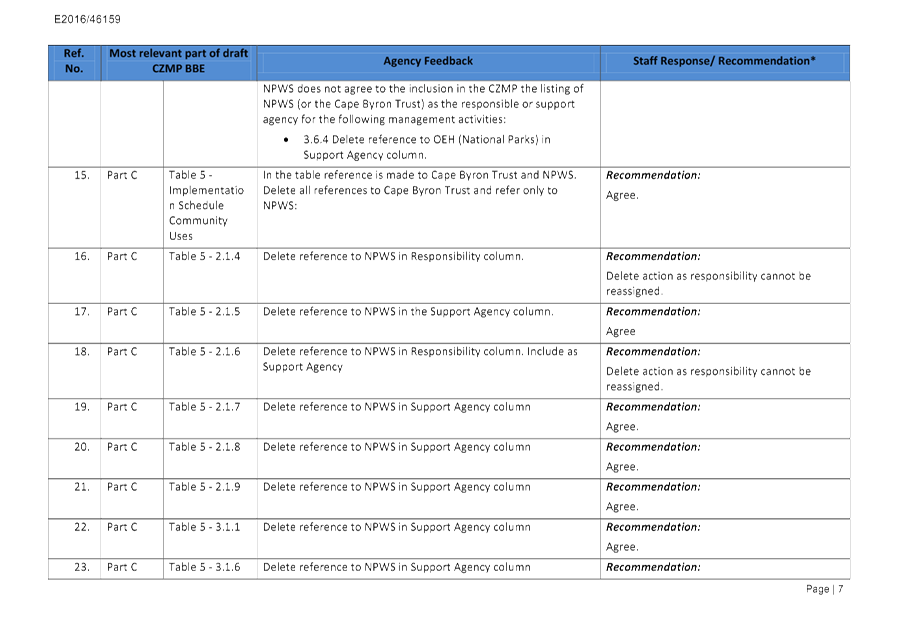
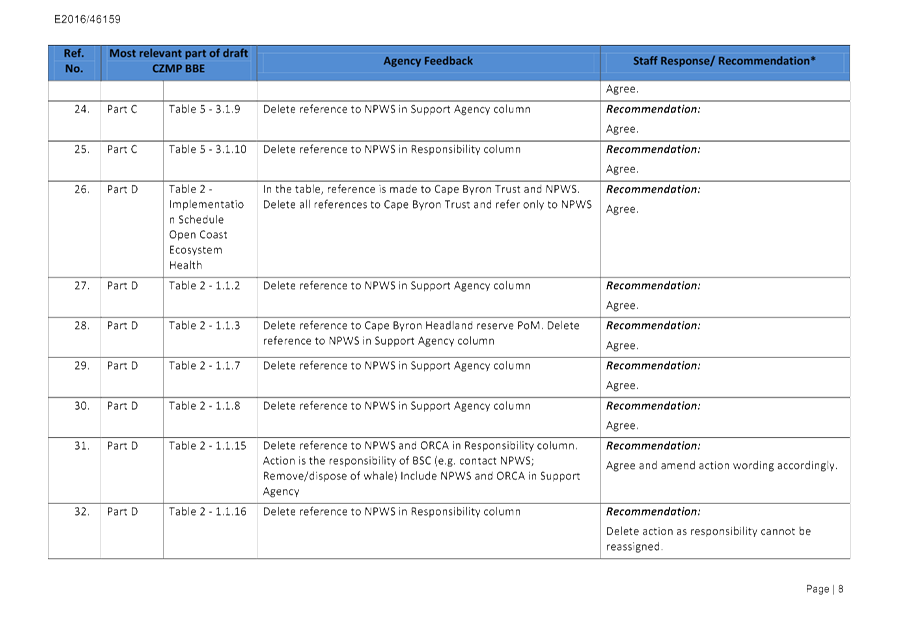
2... Agency Feedback on draft CZMP BBE (55C(2) (b) CP Act)............... 194
Attachment
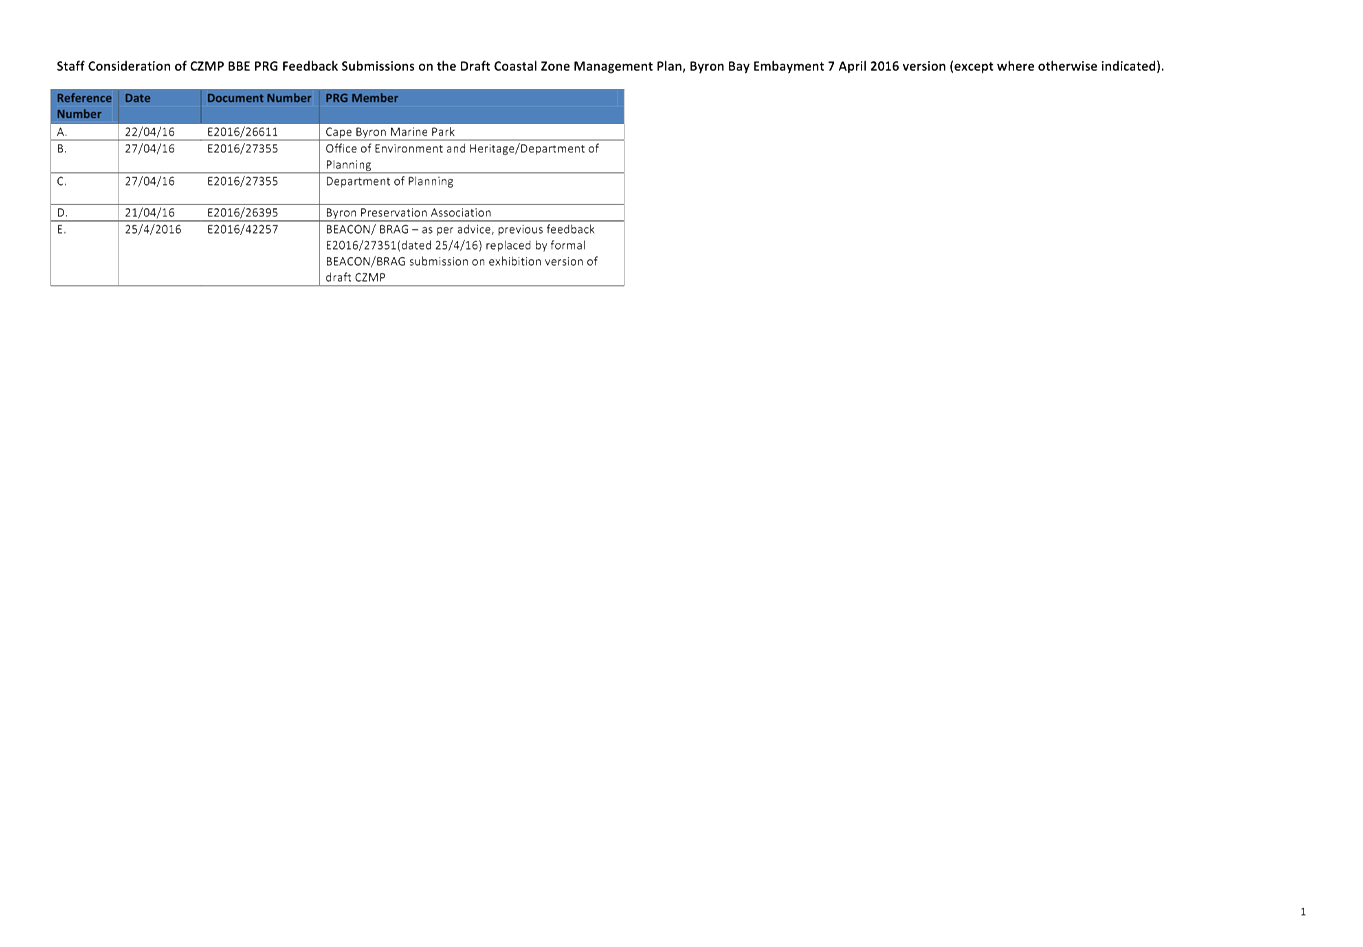
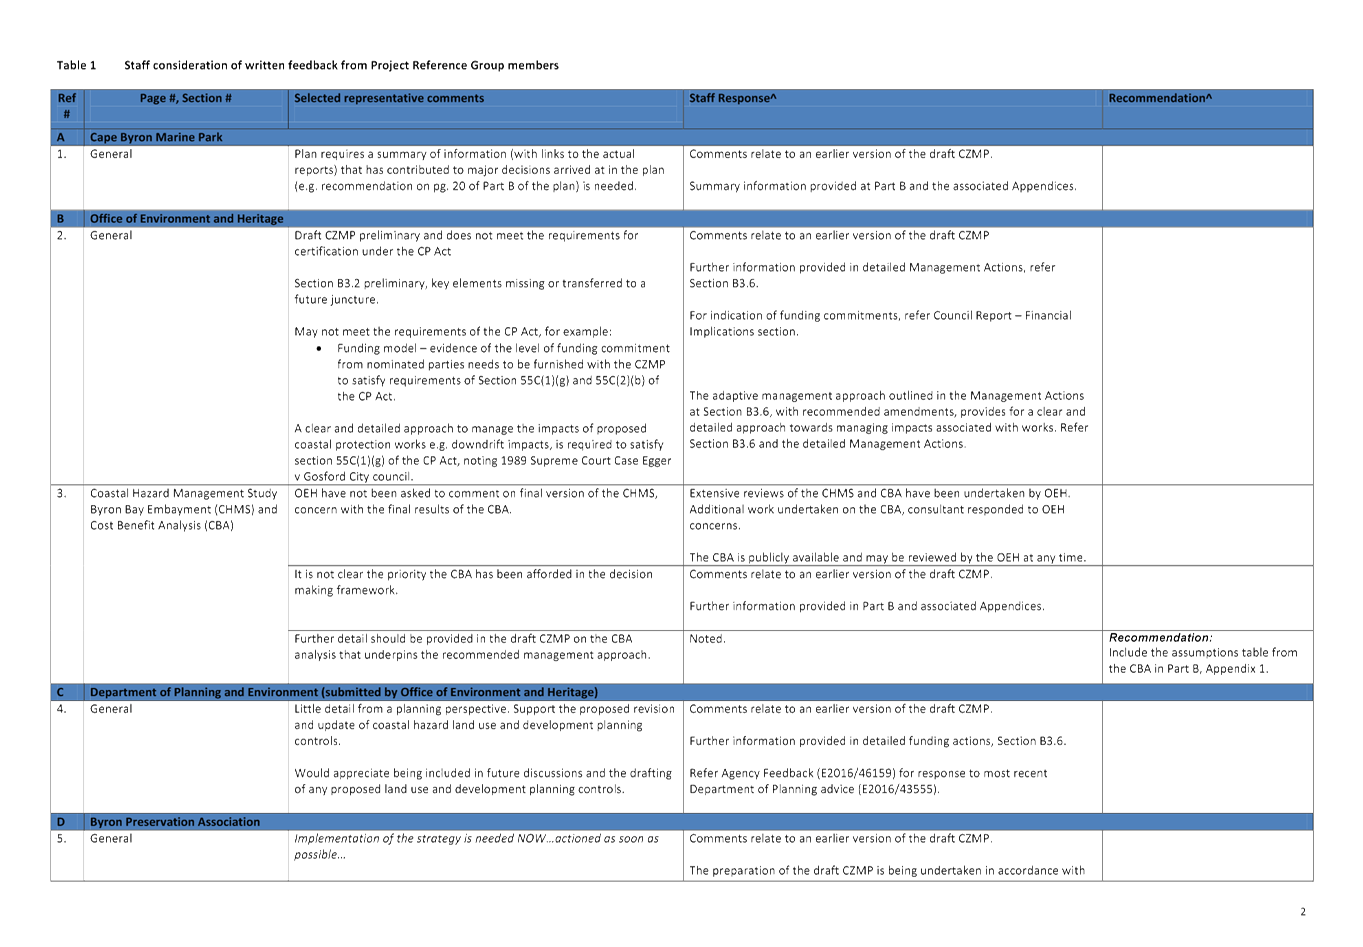
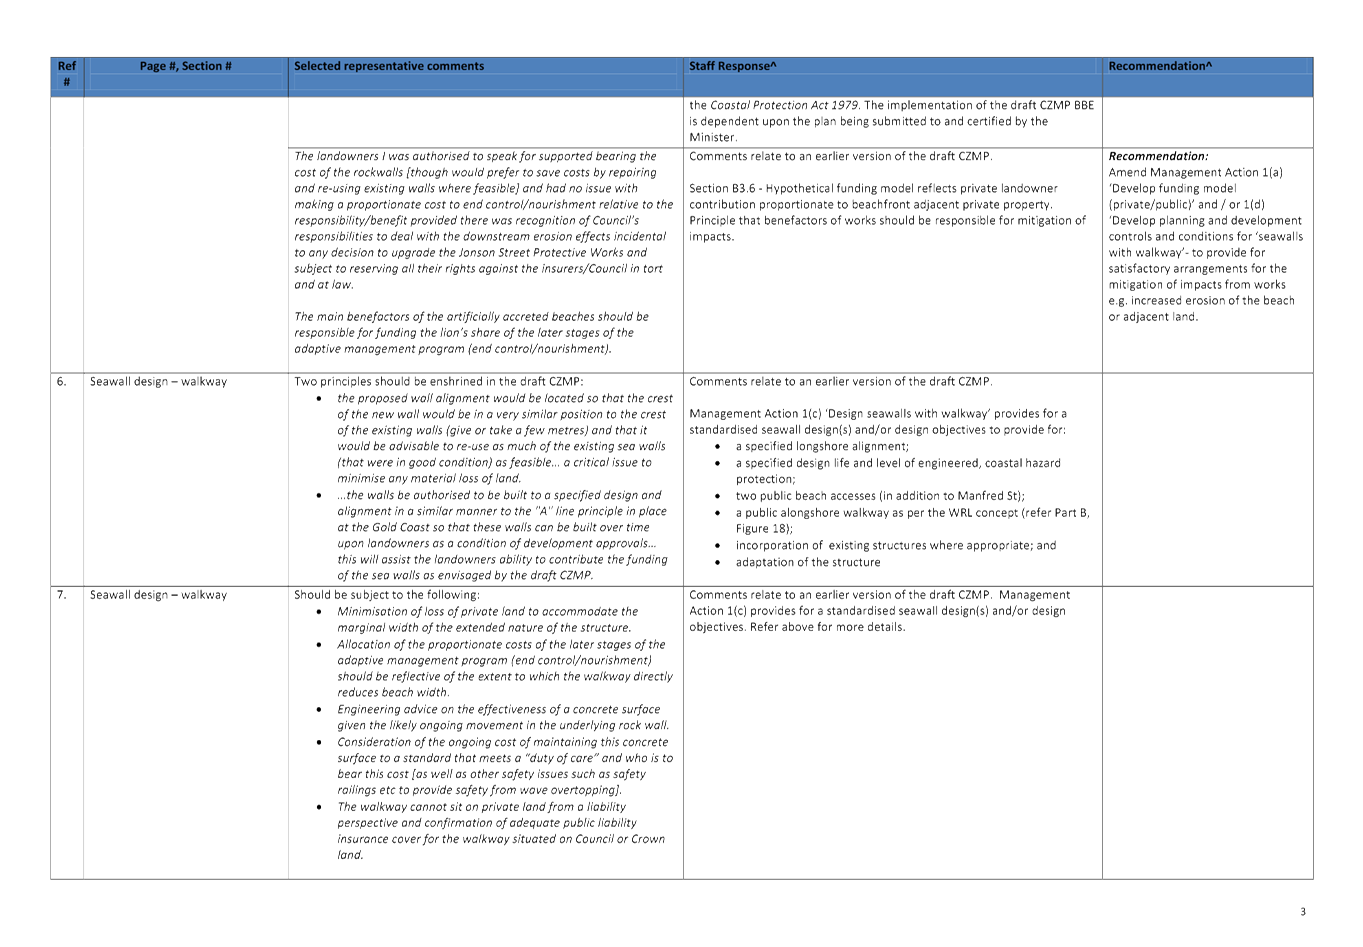
3... PRG Feedback on draft CZMP BBE.................................................... 215
Attachment
4... PRG feedback on draft Exhibition Submissions Report....................... 227
4.4 PLANNING
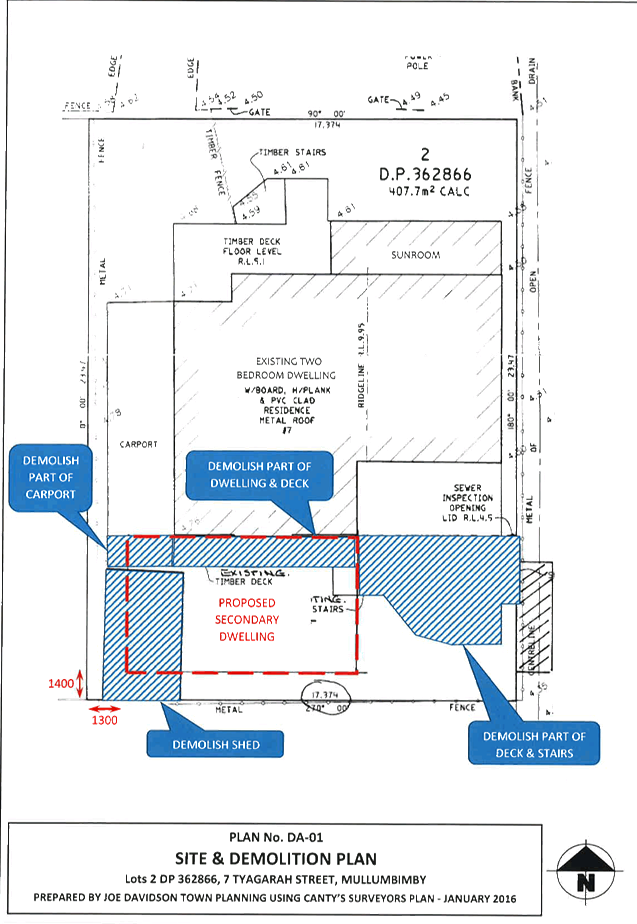
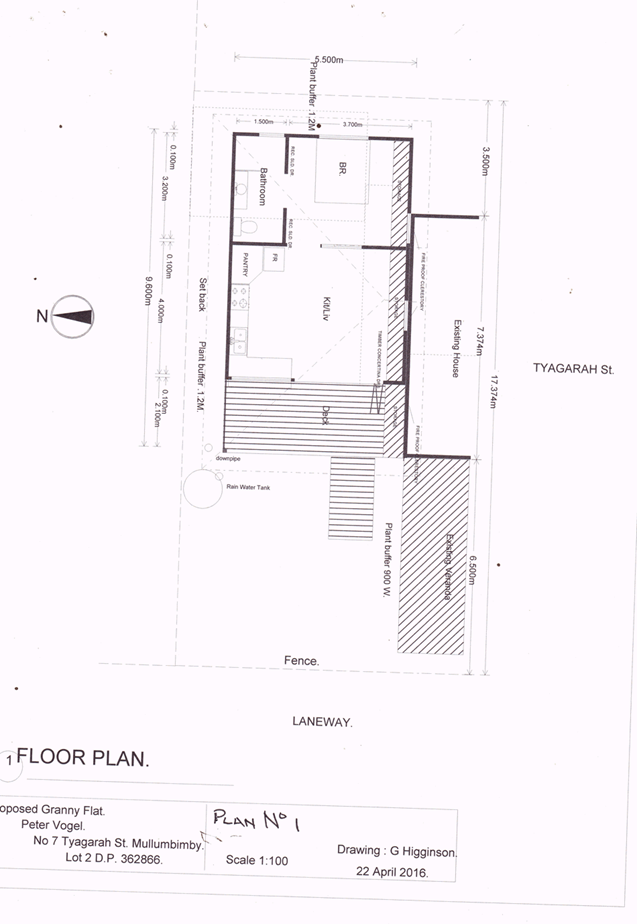
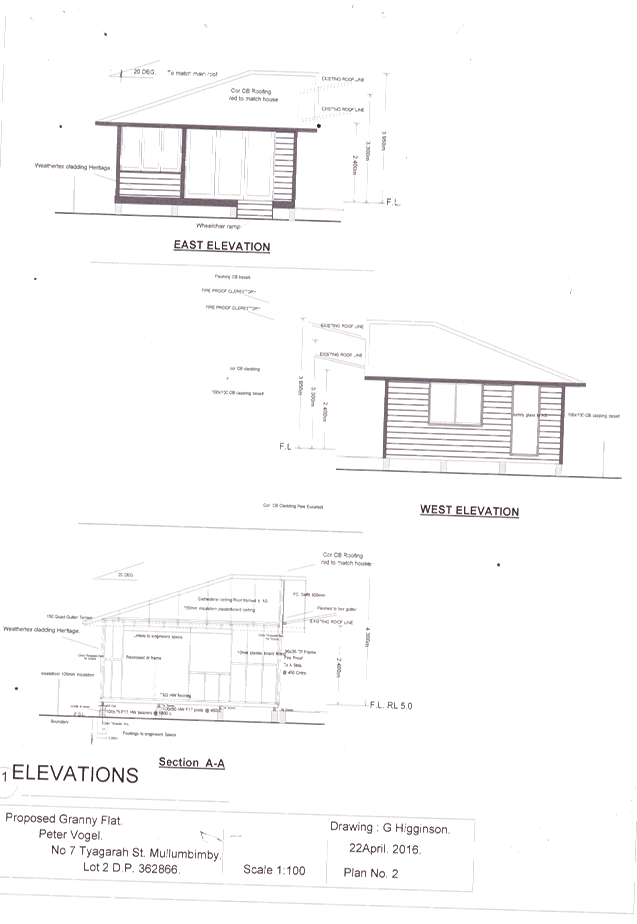
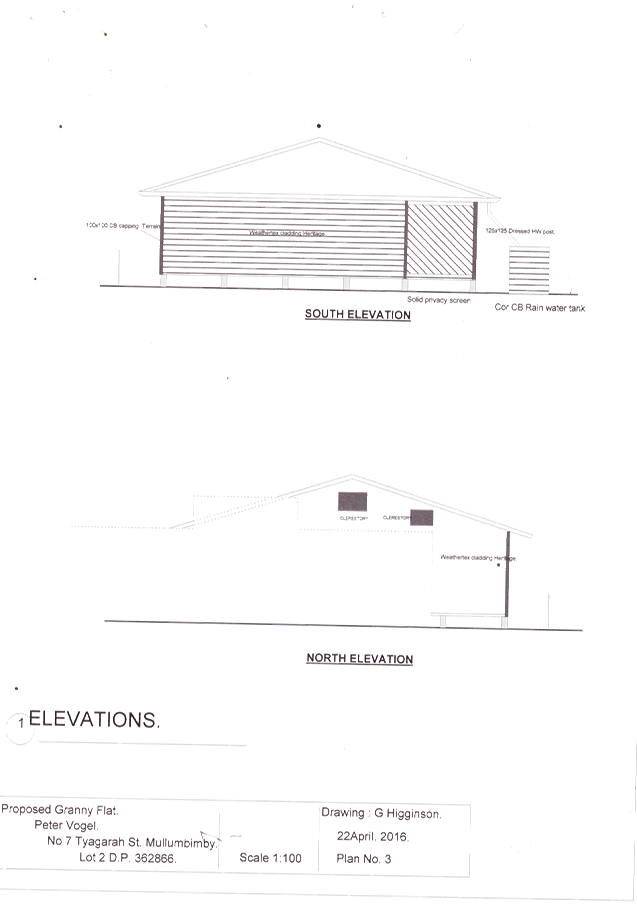
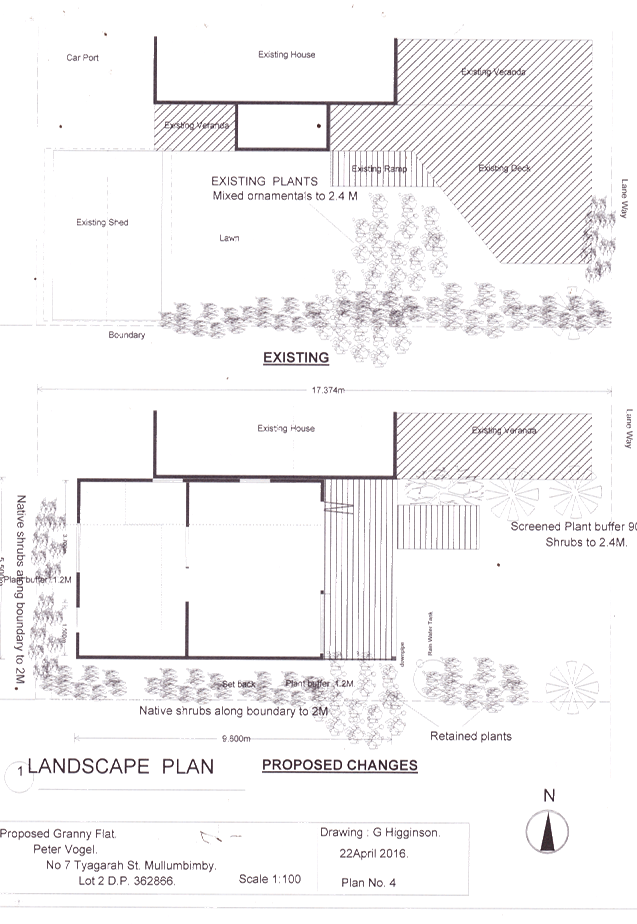
- 10.2016.34.1 Secondary Dwelling at 7 Tyagarah Street Mullumbimby
Attachment
1... Proposed Plans 10.2016.34.1................................................................ 230
Attachment
2... Conditions of consent 10.2016.34.1...................................................... 235
4.5 PLANNING
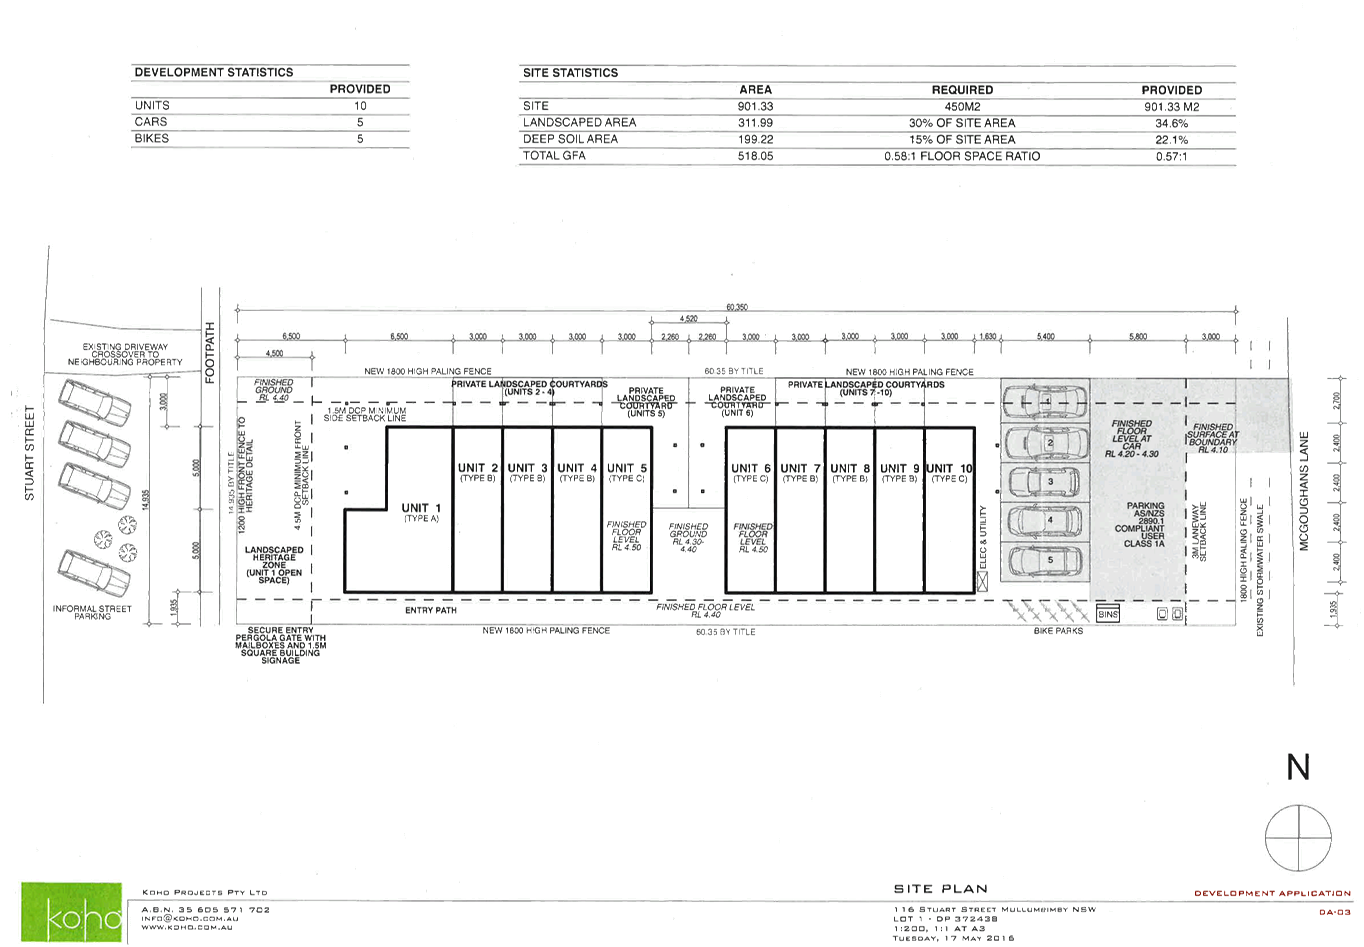
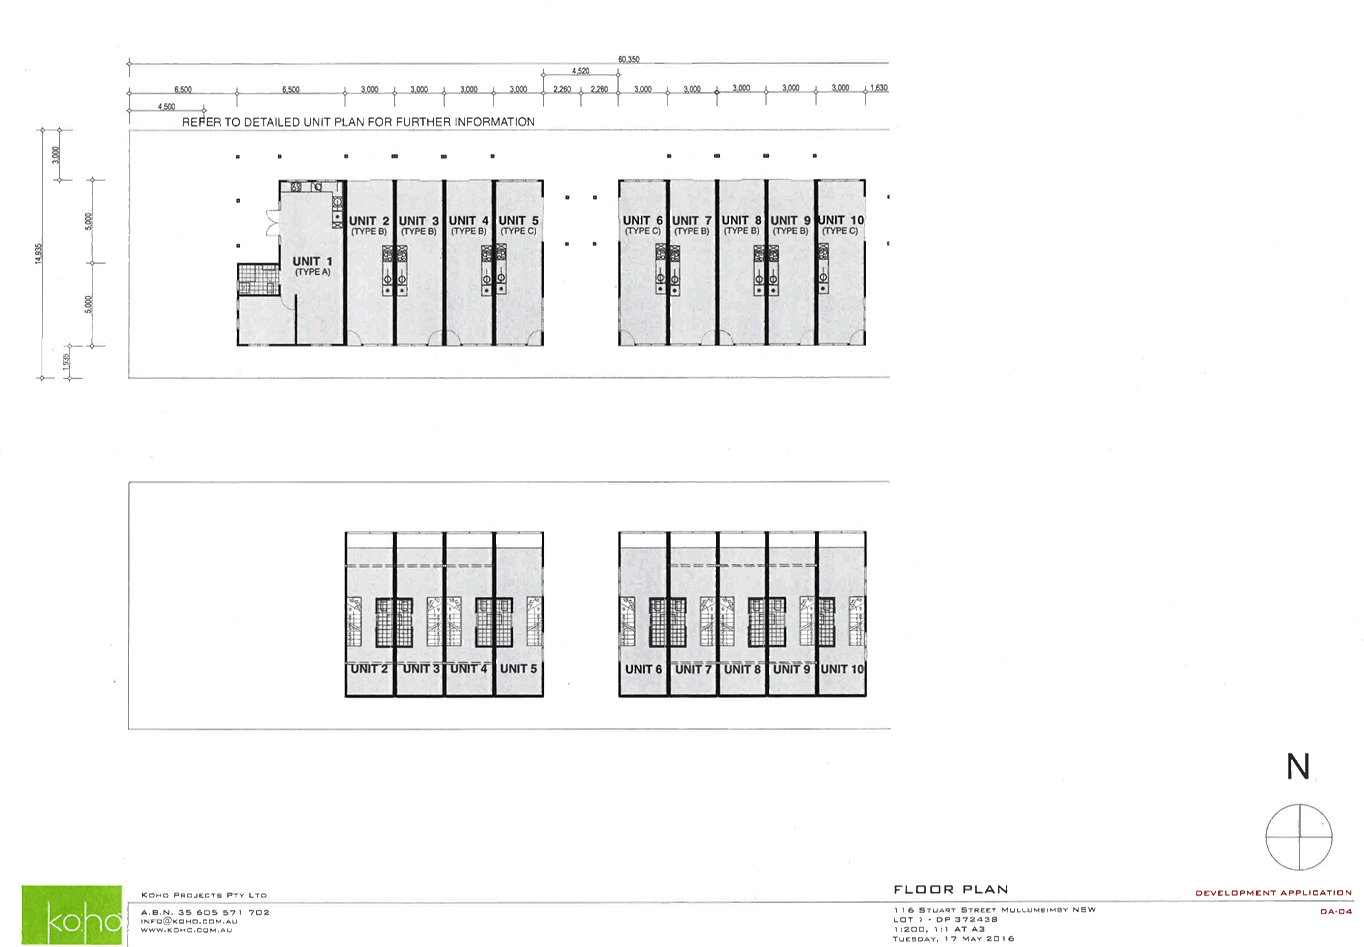
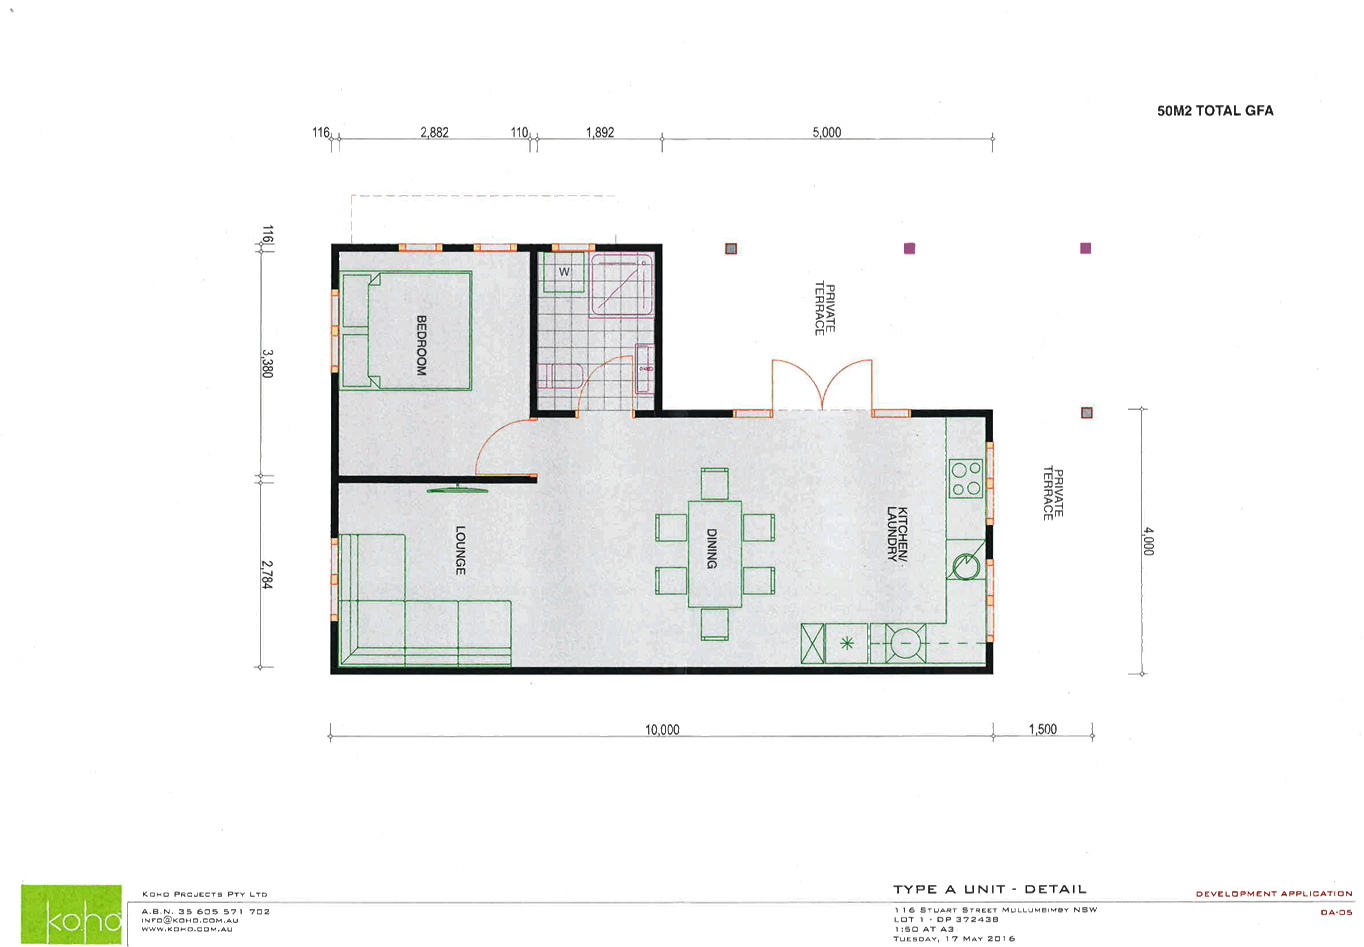
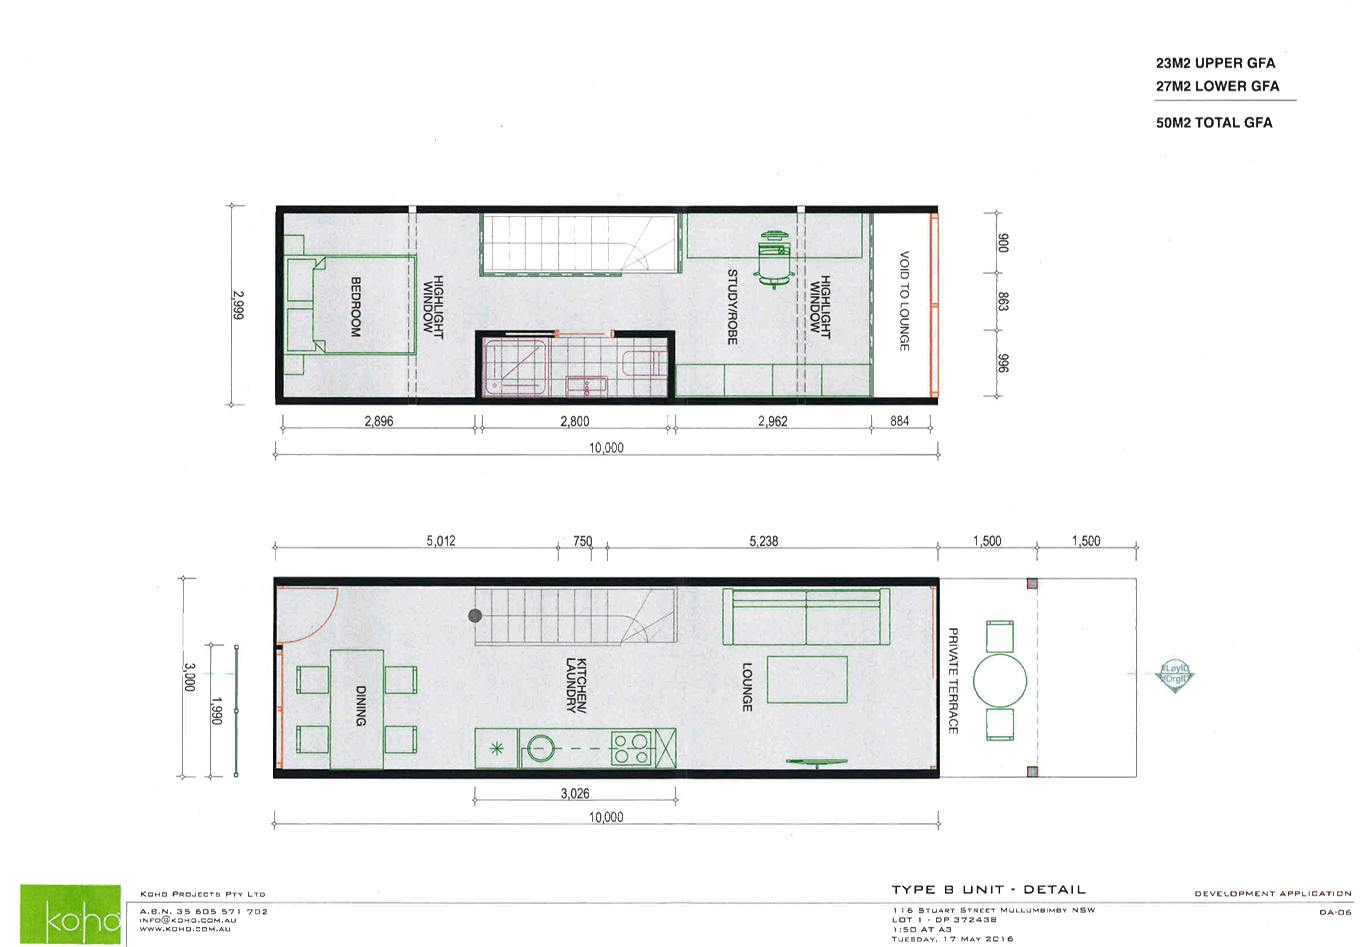
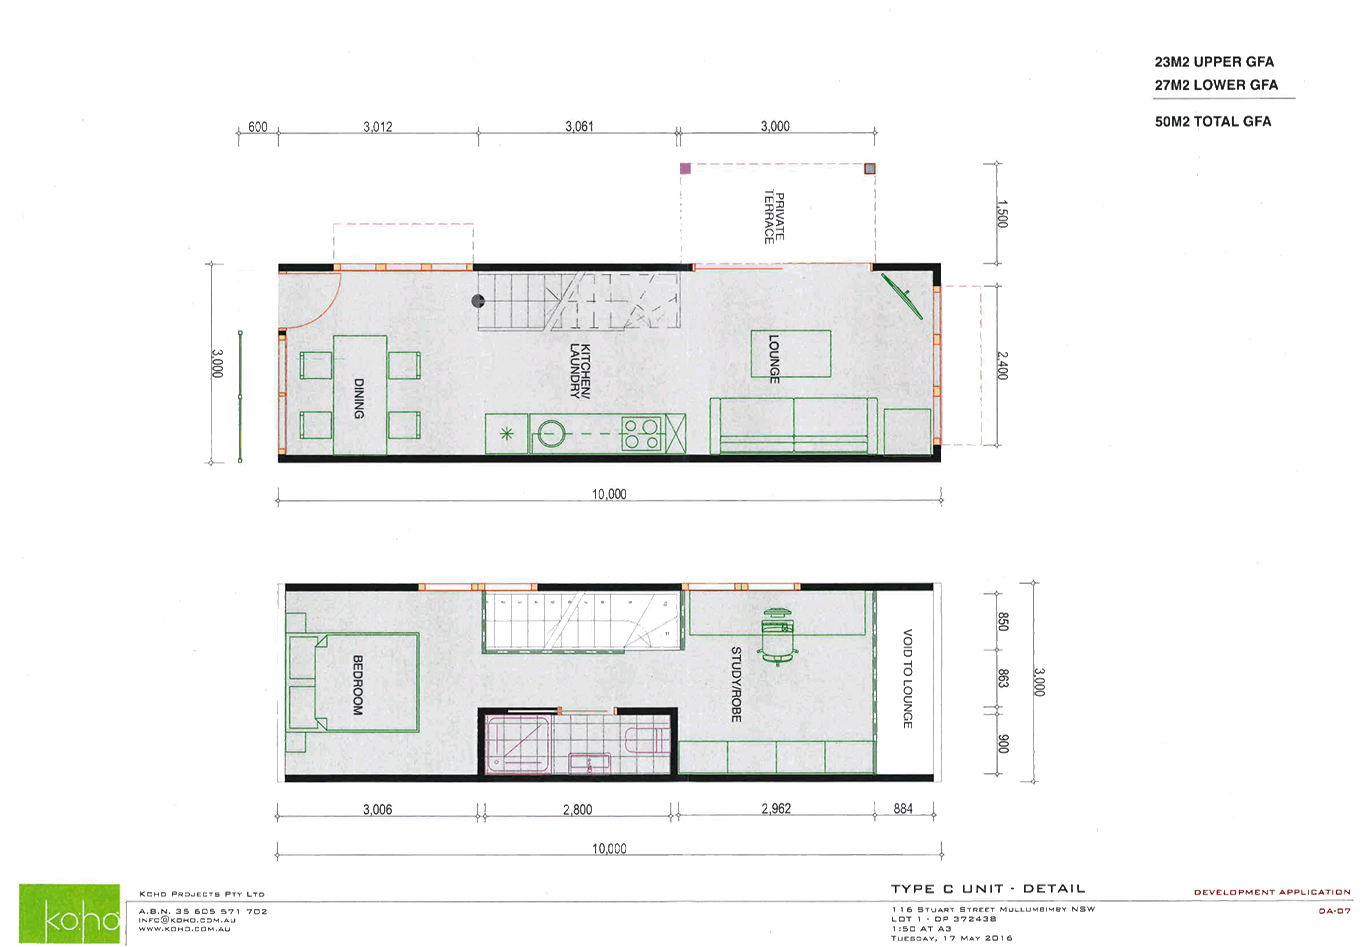
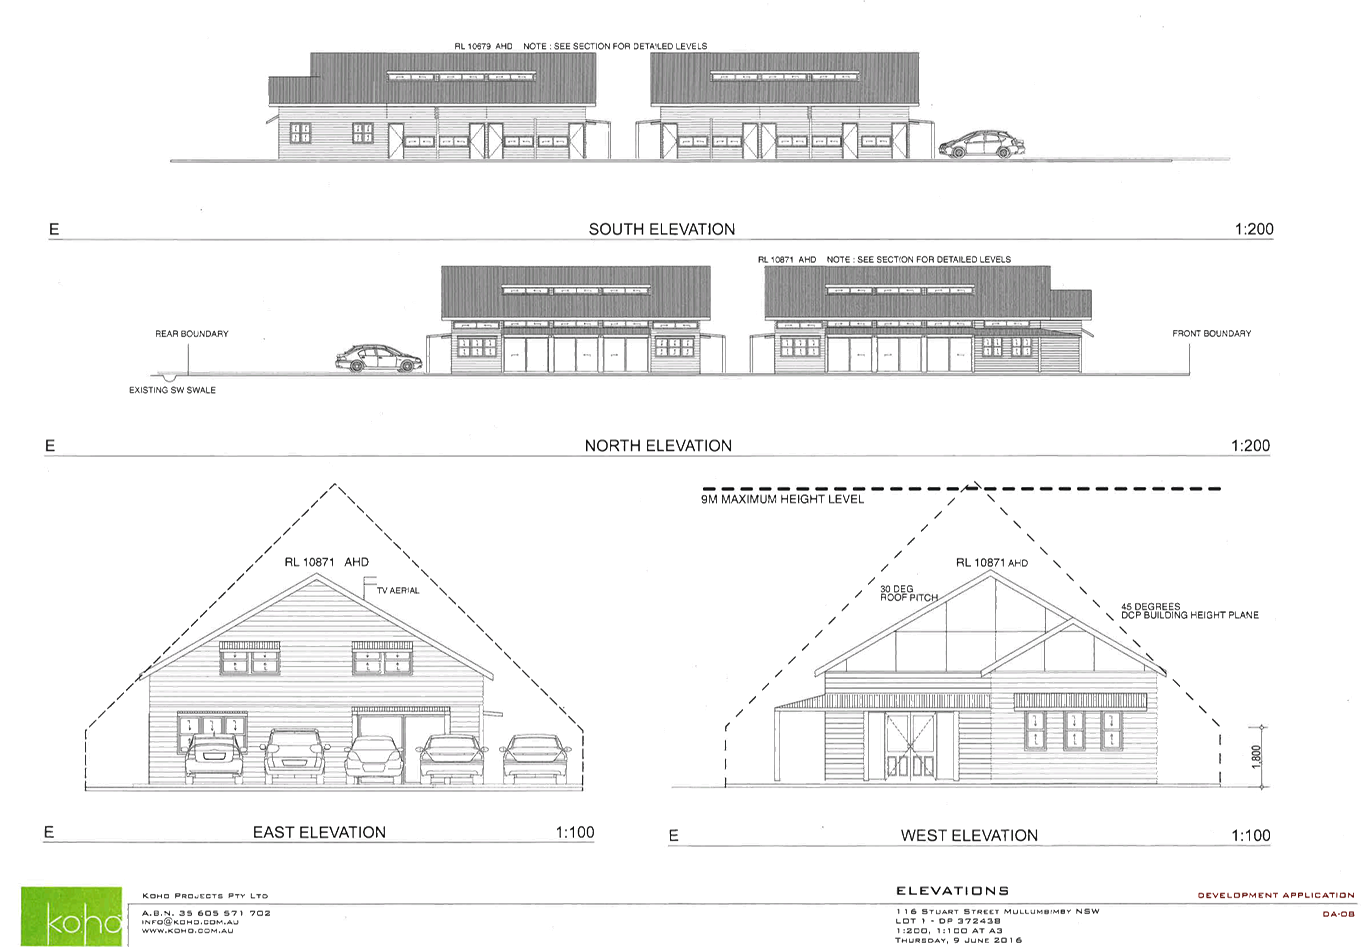
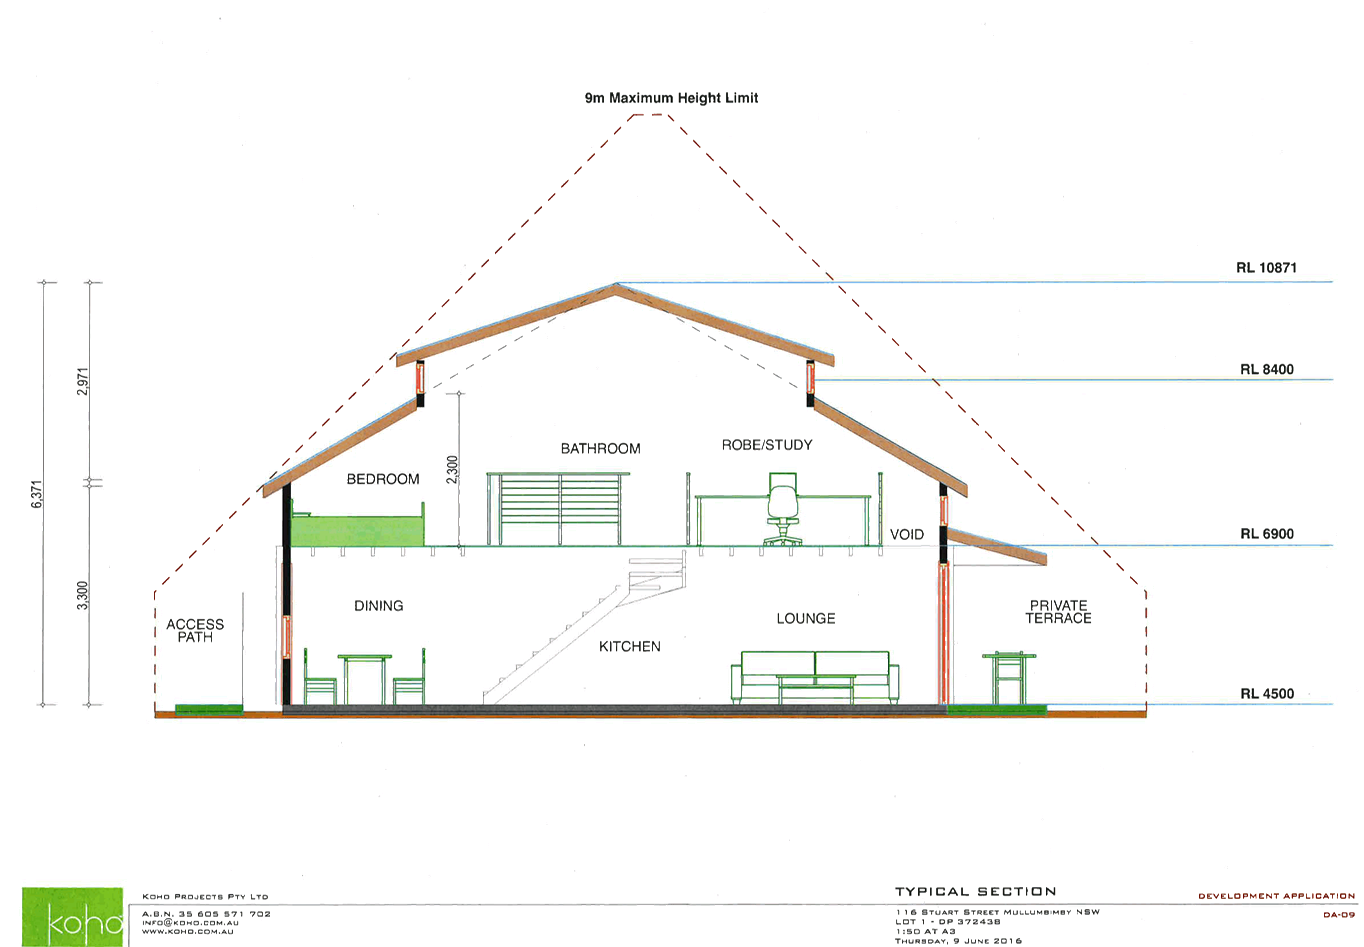
- Development Application 10.2016.189.1 - Multi Dwelling Housing (including 10
single bedroom dwellings, parking for 5 vehicles) and Demolition of existing
structures - 116 Stuart Street, Mullumbimby
Attachment
1... Plans prepared by Koho 10.2016.189.1................................................ 242
Attachment
2... Proposed conditions of consent 10.2016189.1...................................... 250
1. Late Reports
Late Reports
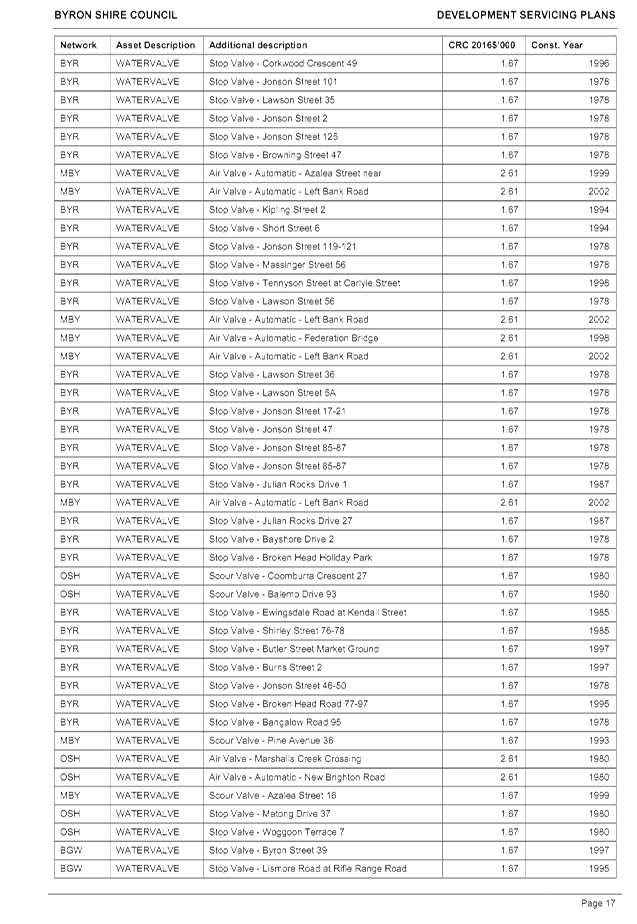
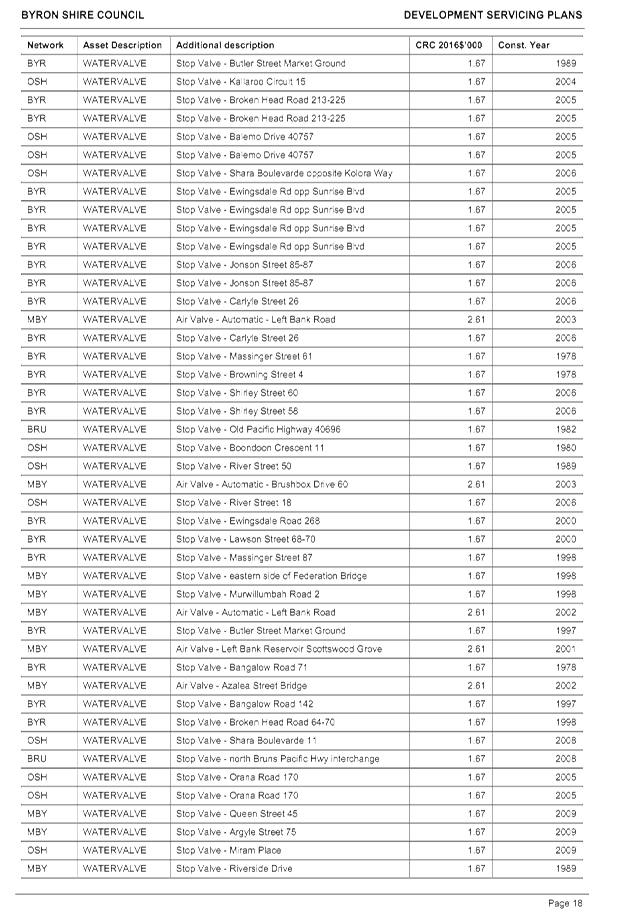
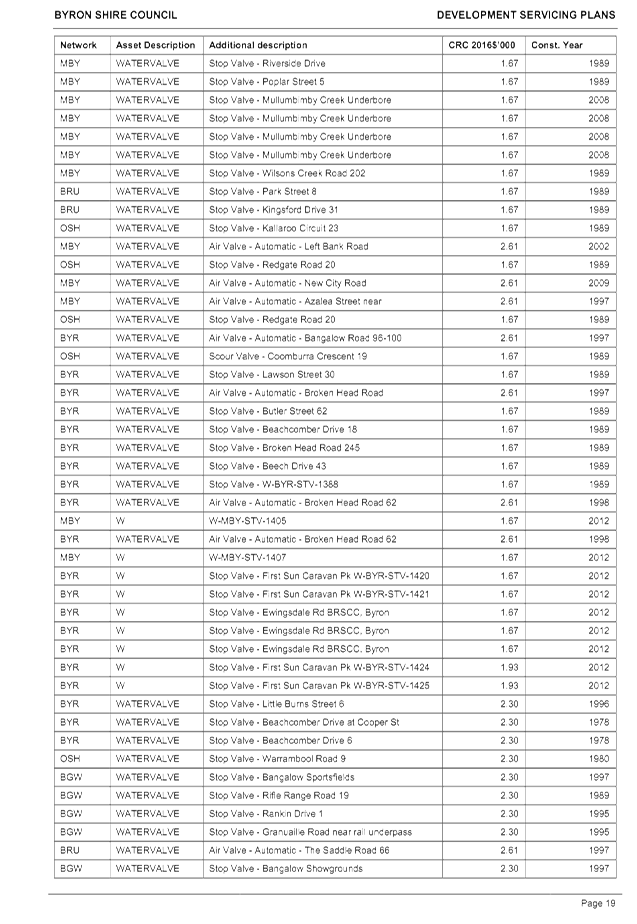
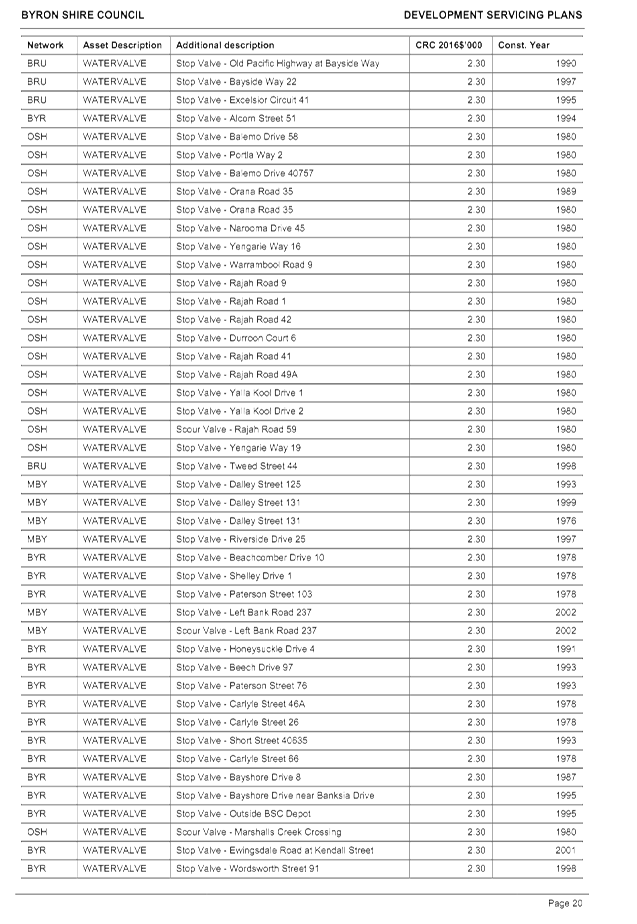
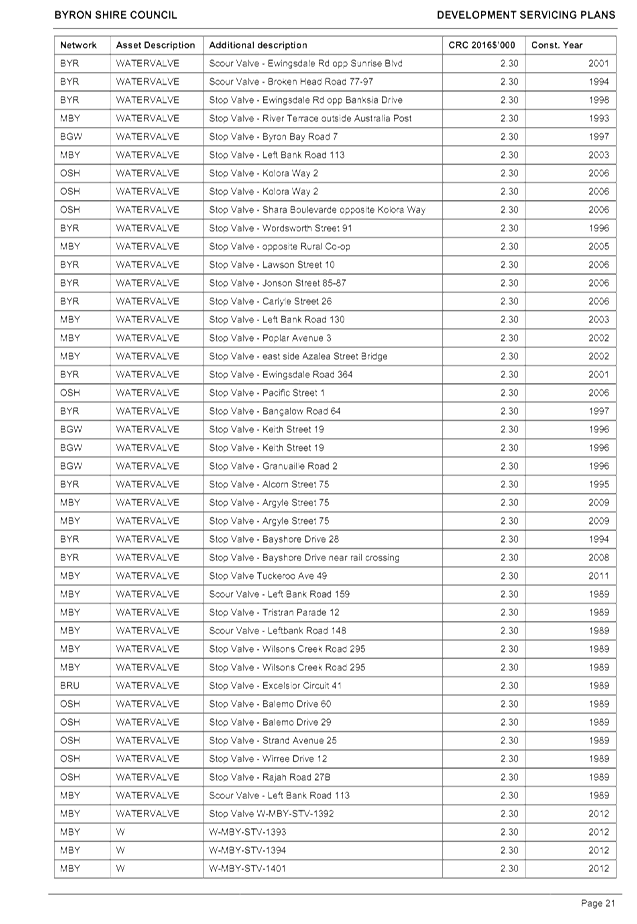
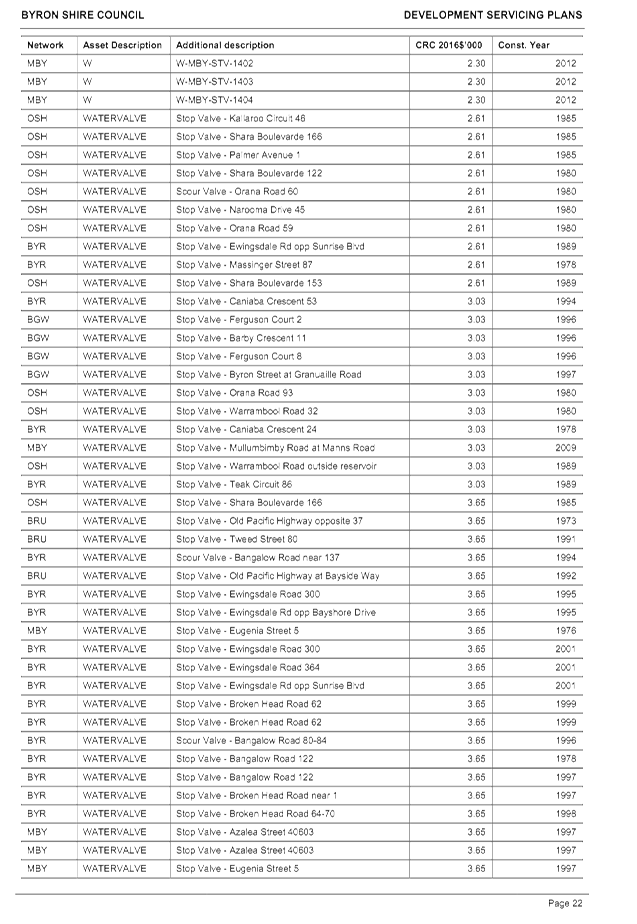
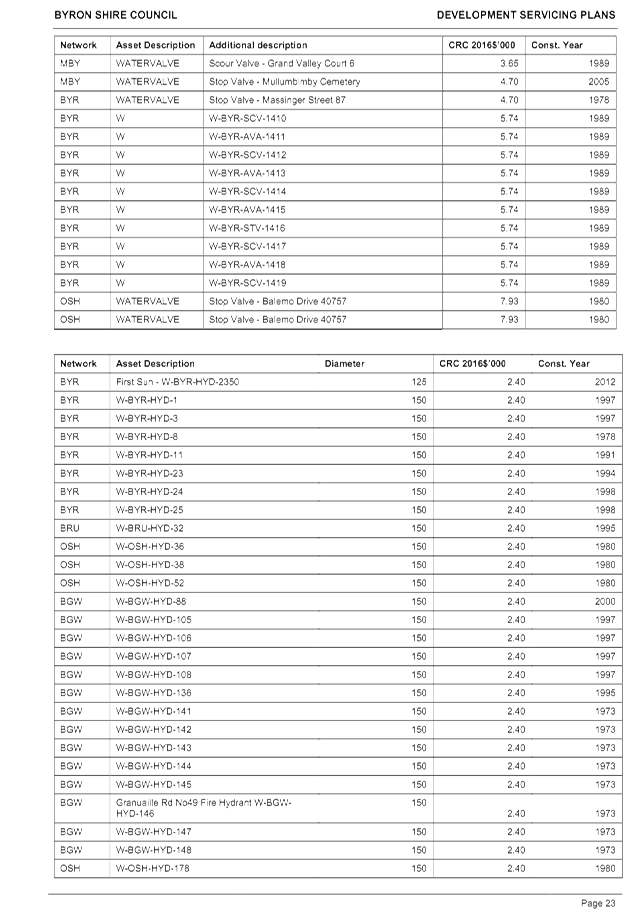
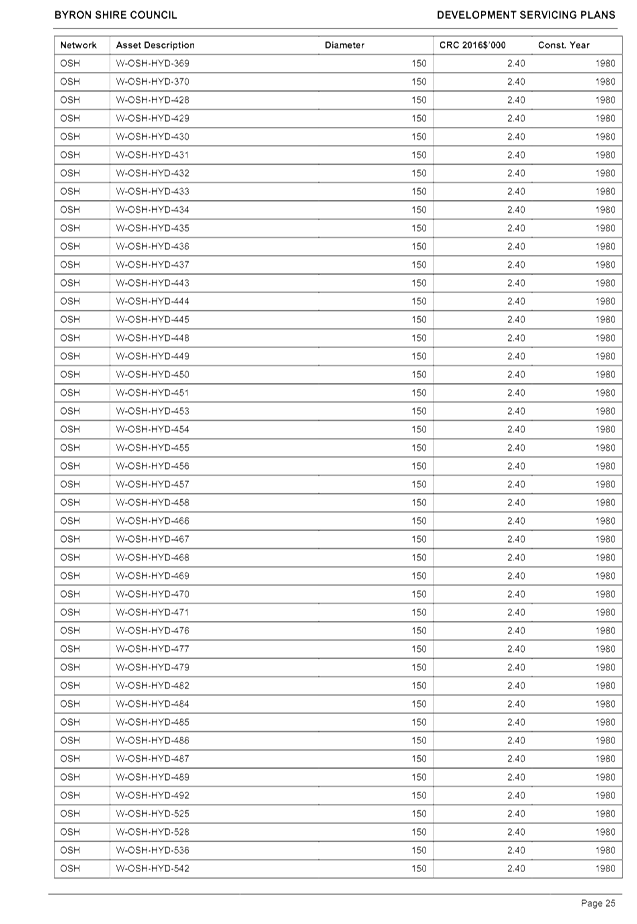
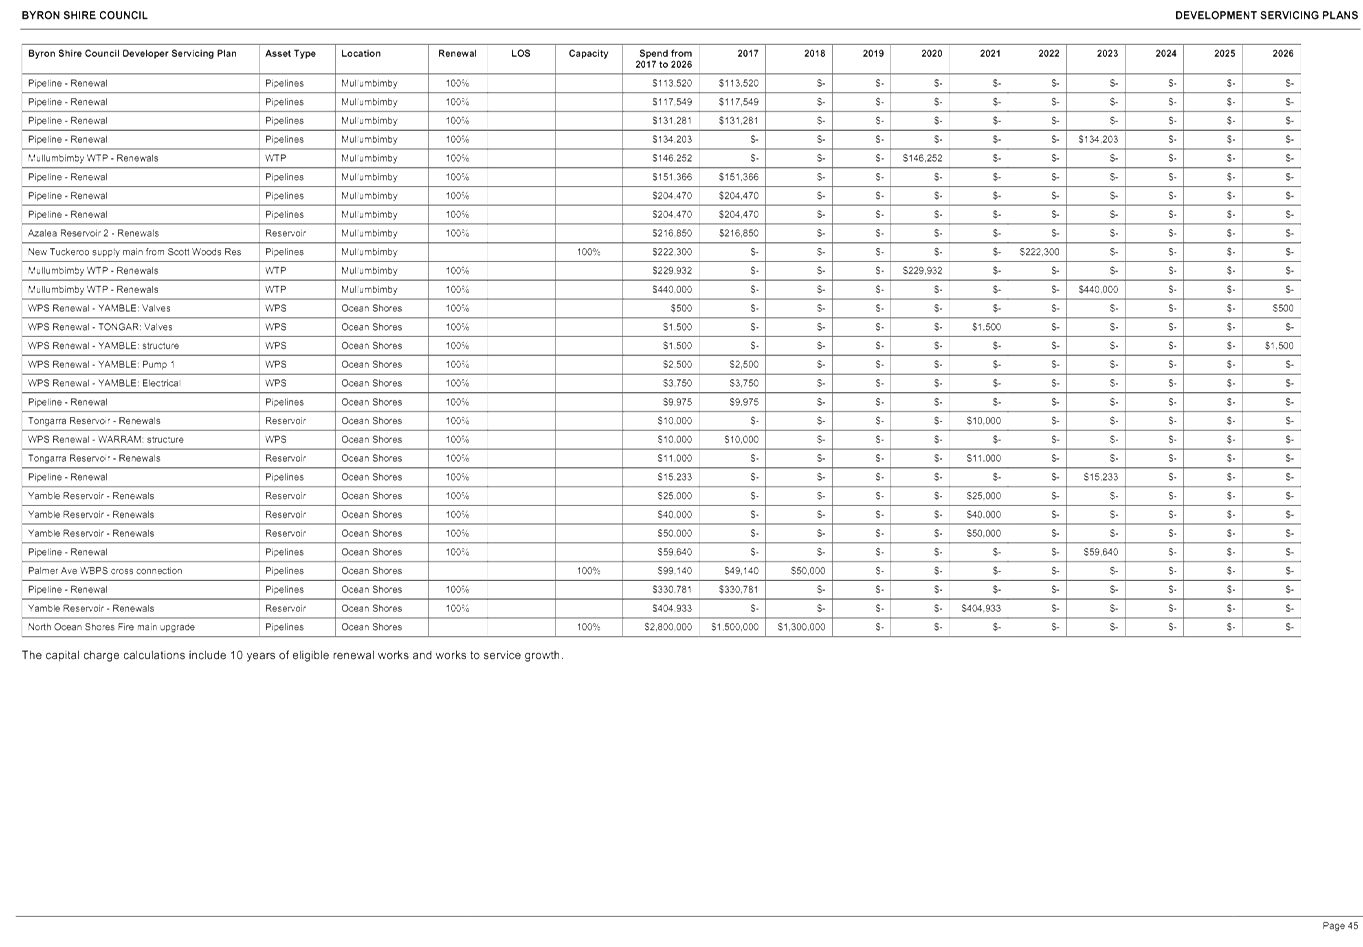
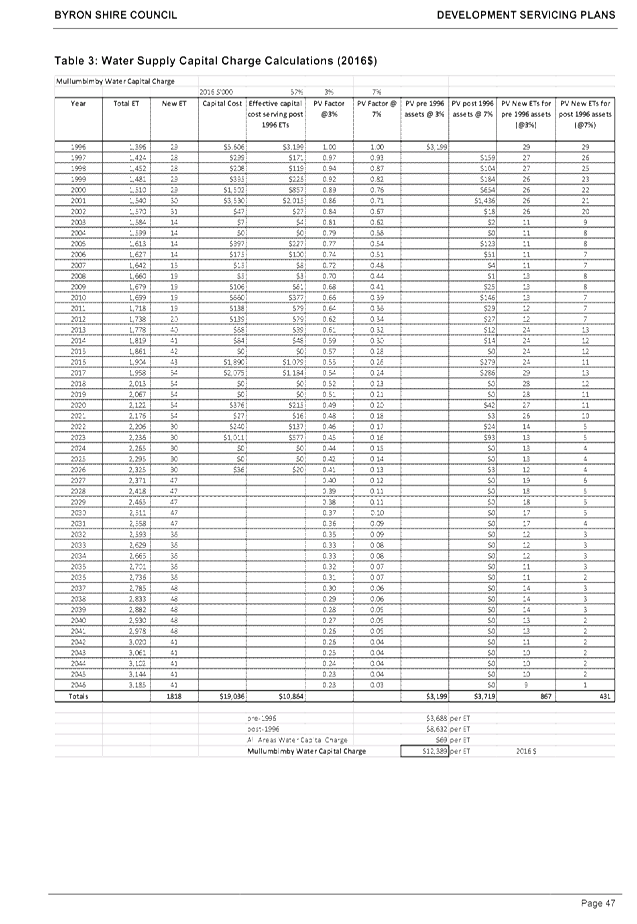
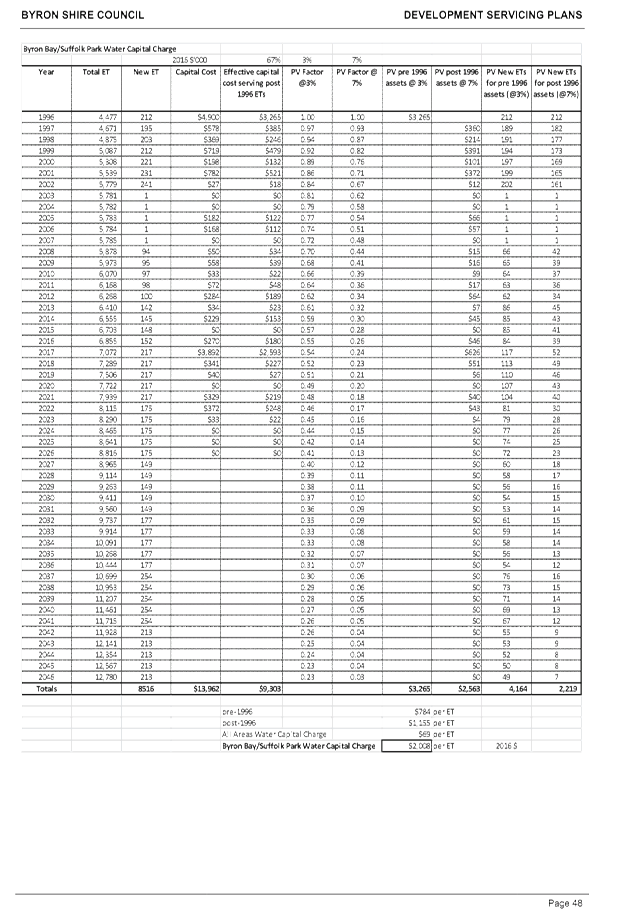
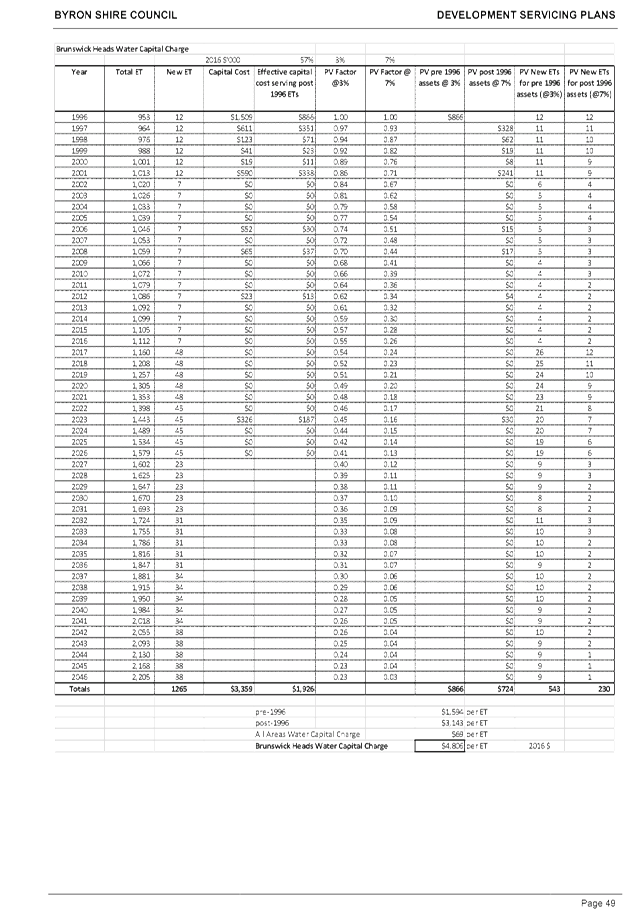
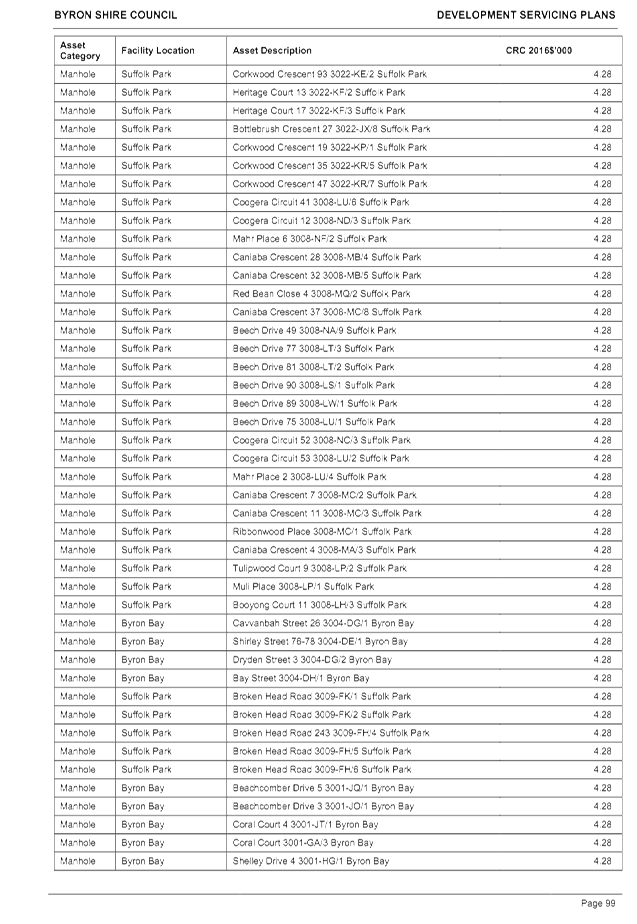
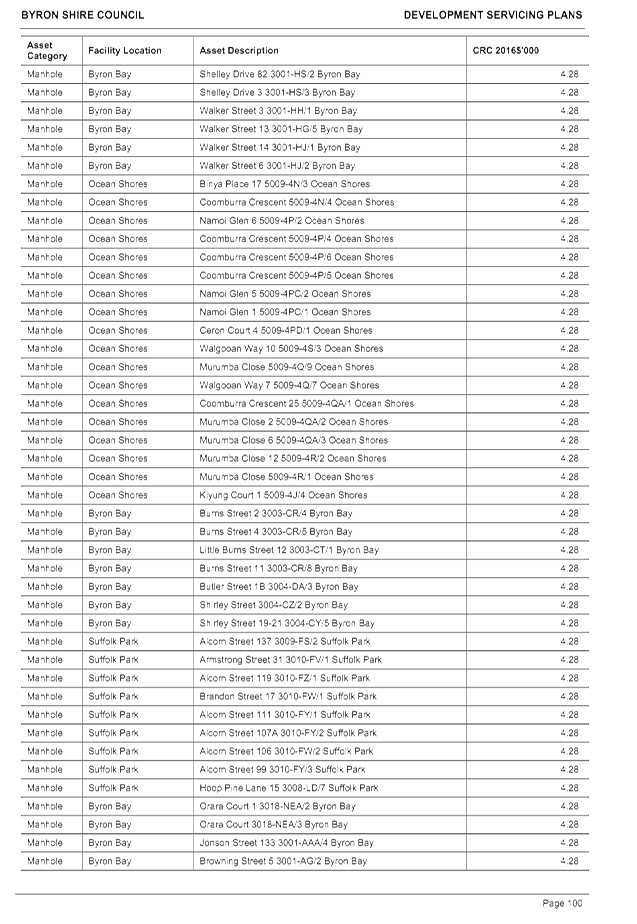
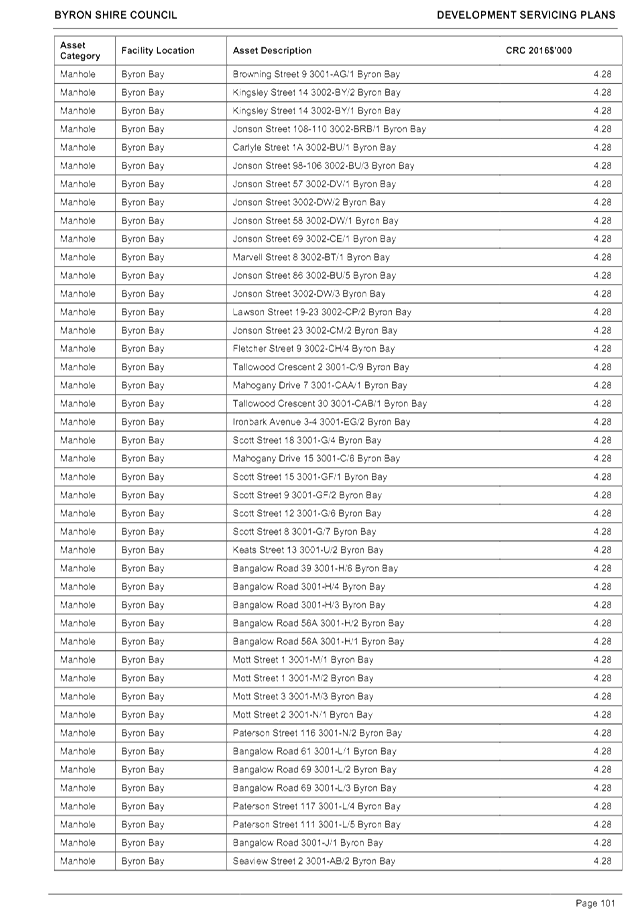
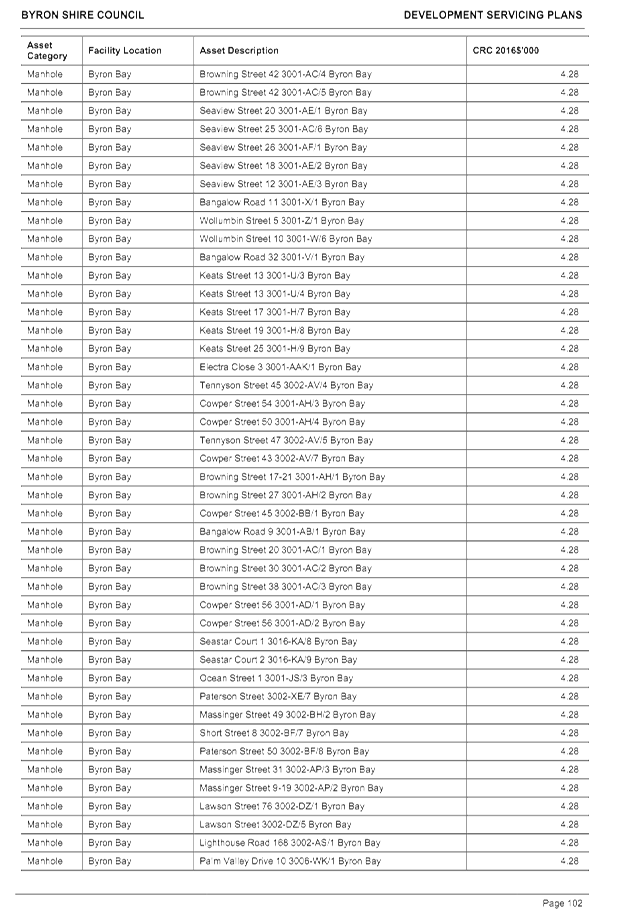
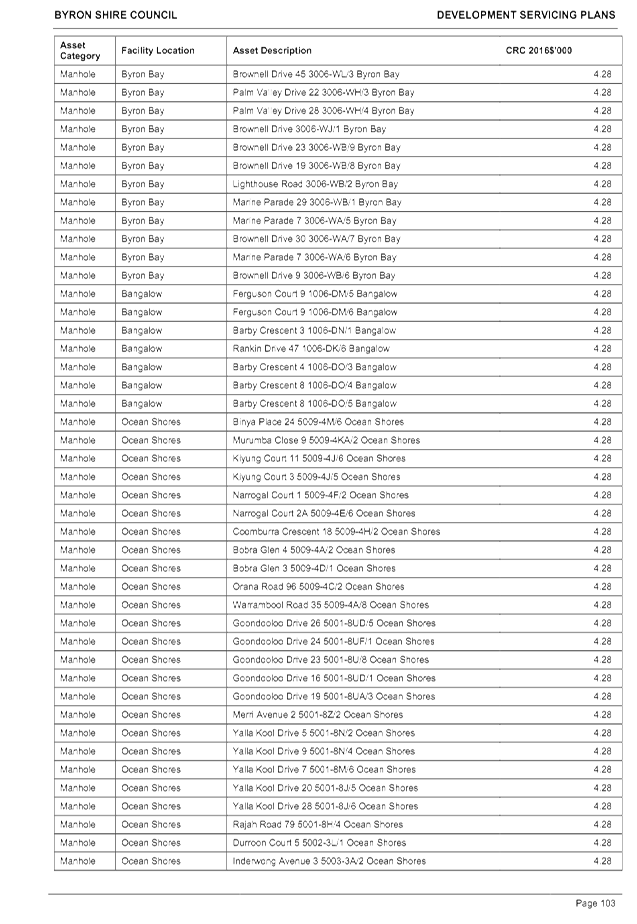
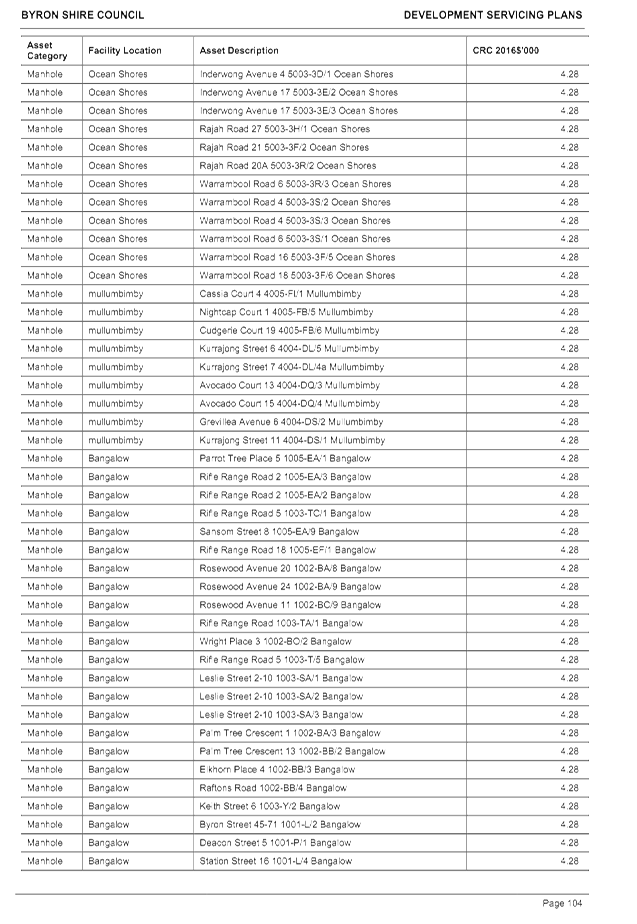
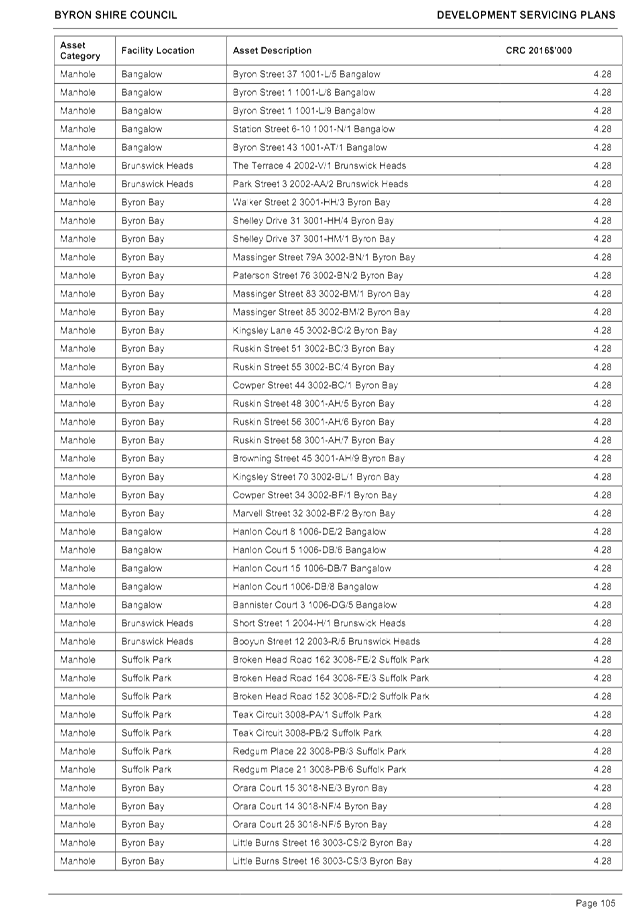
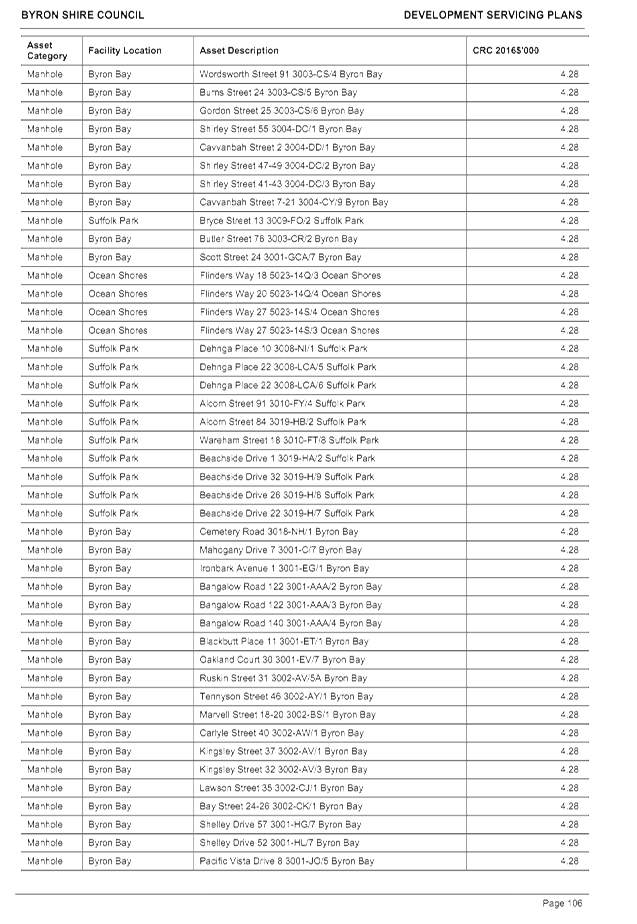
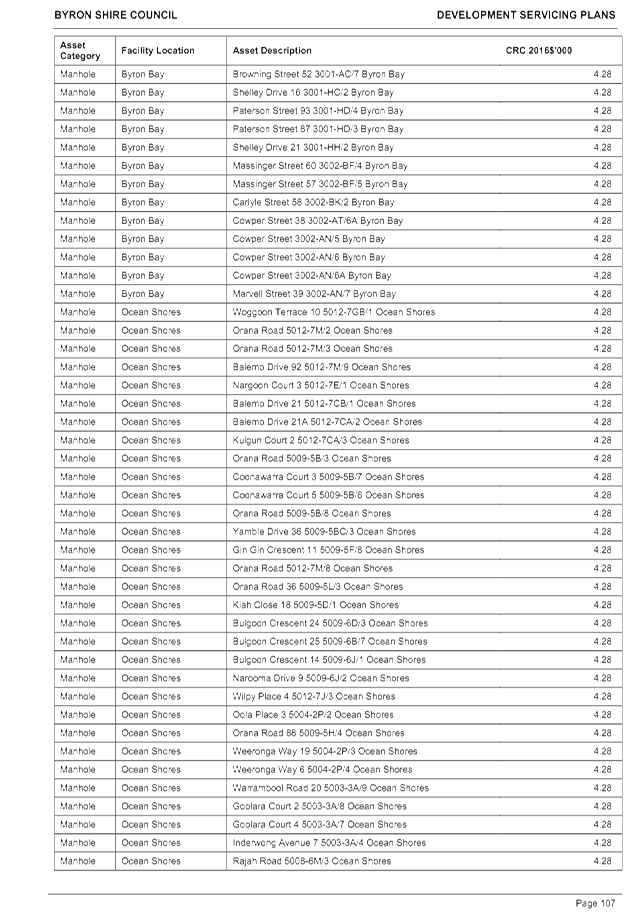
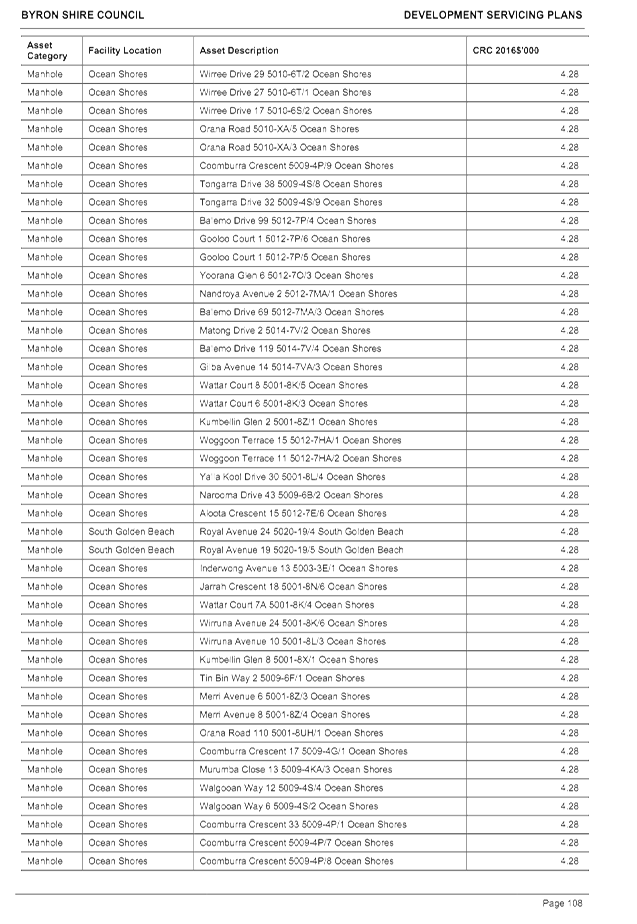
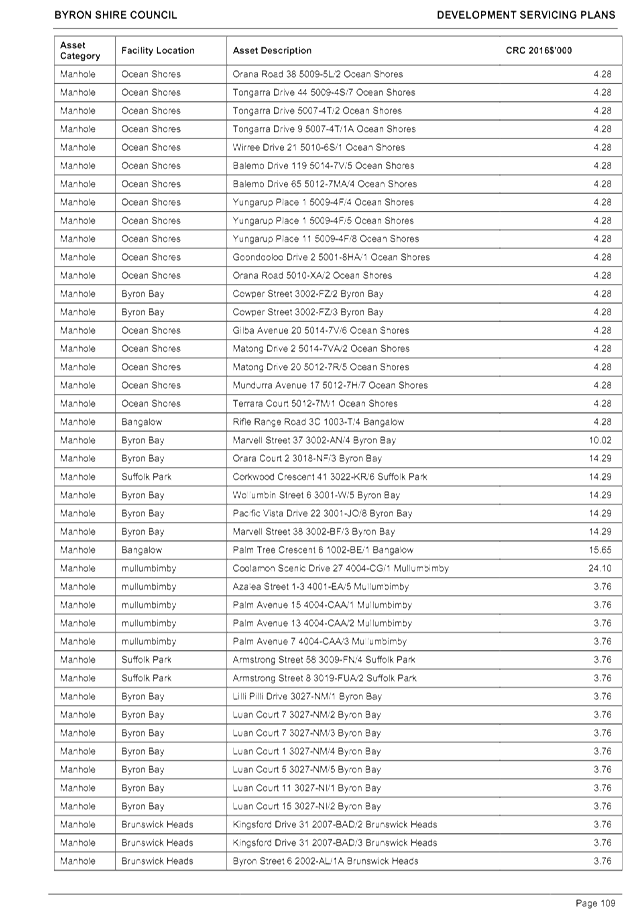
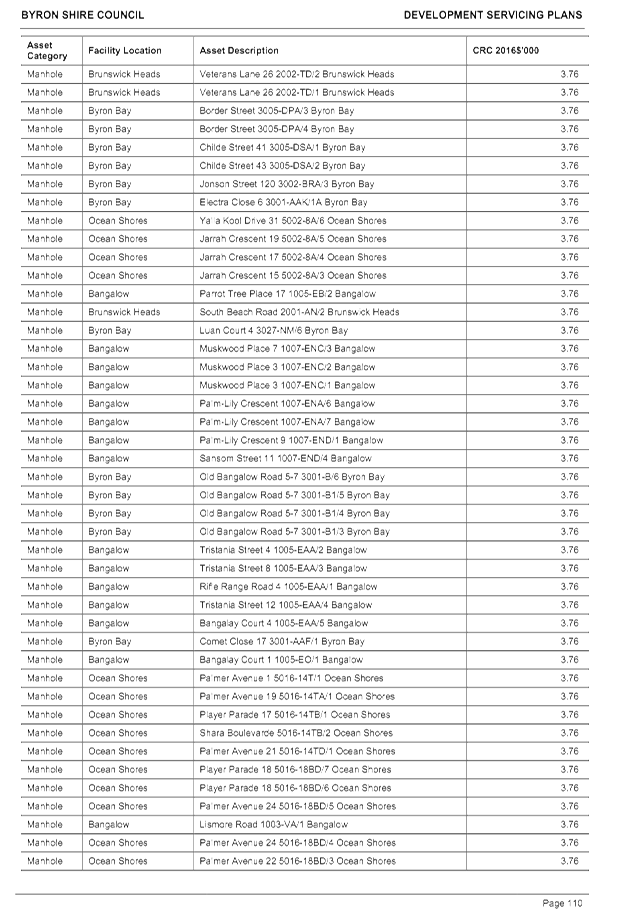
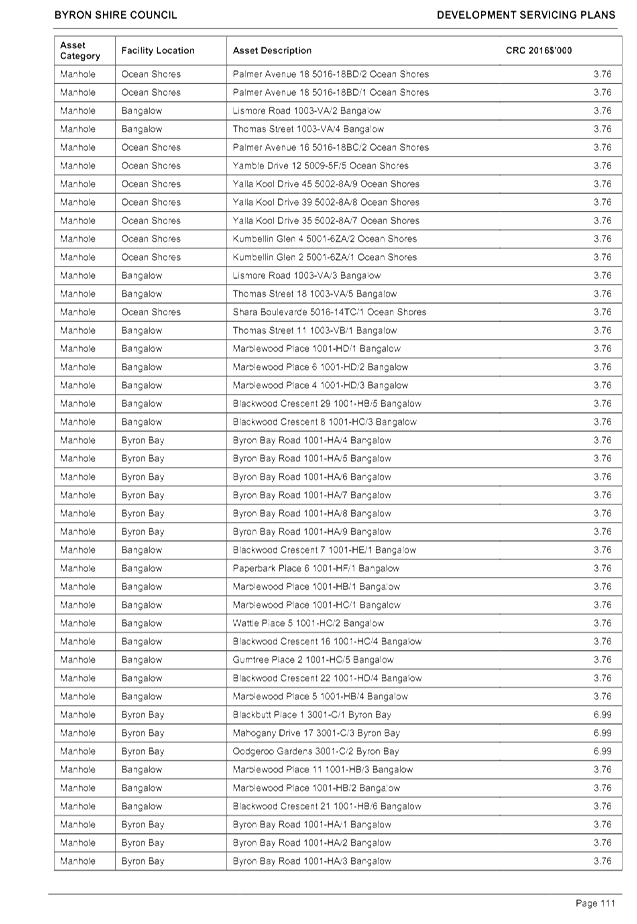
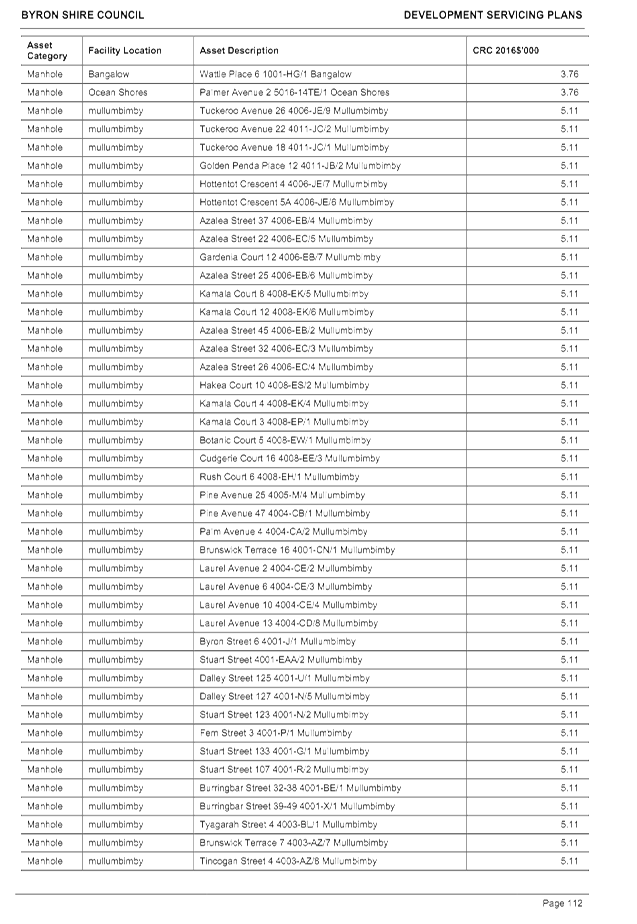
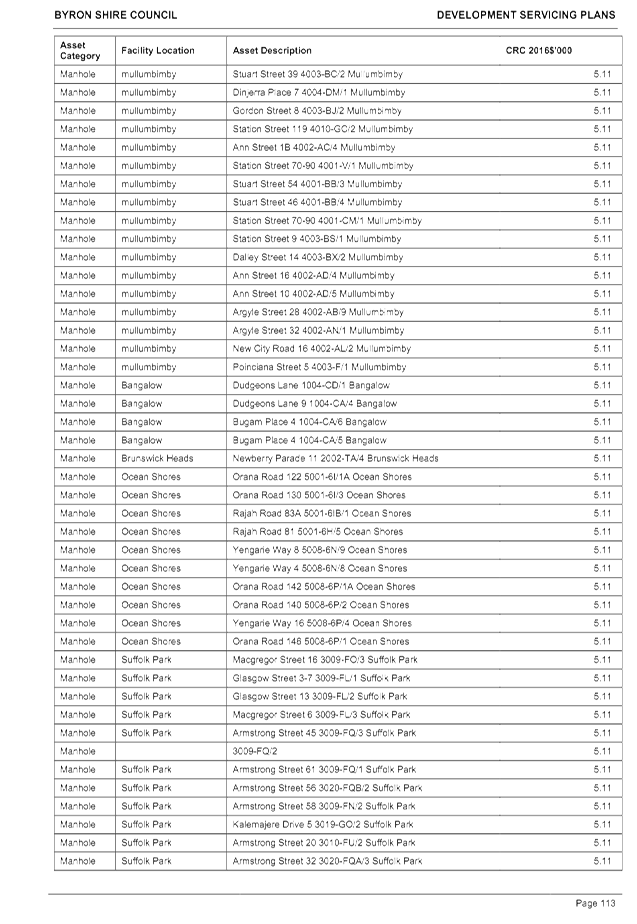
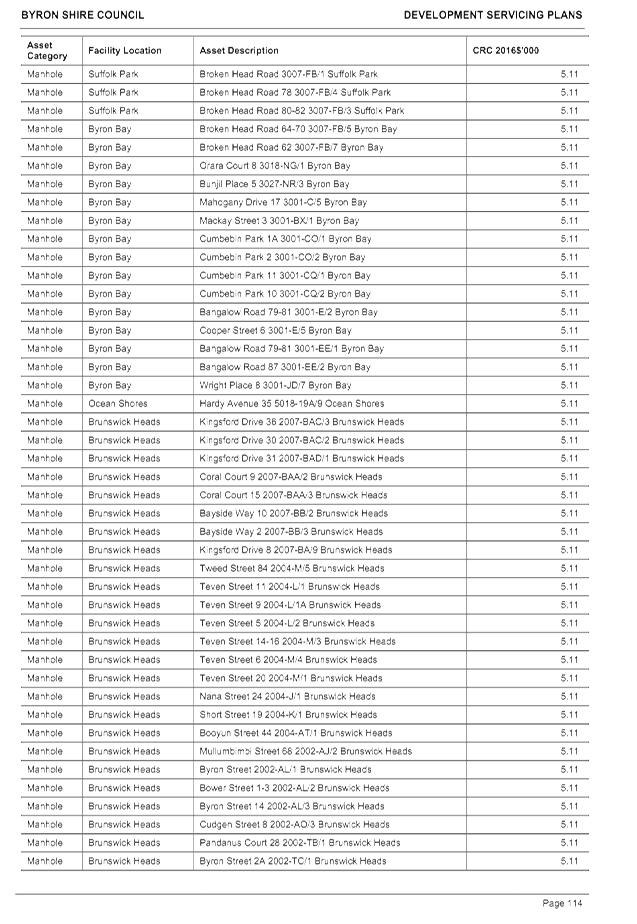
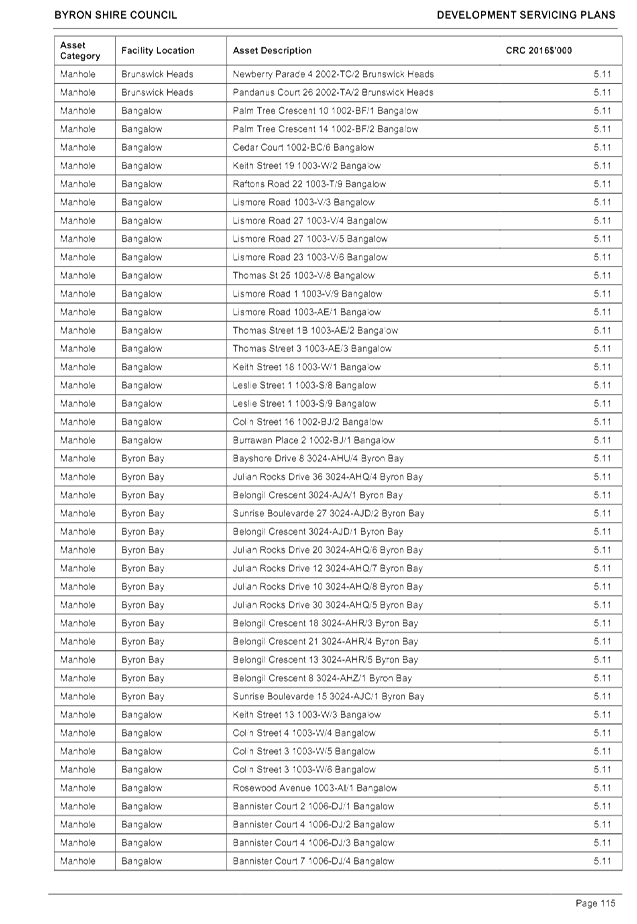
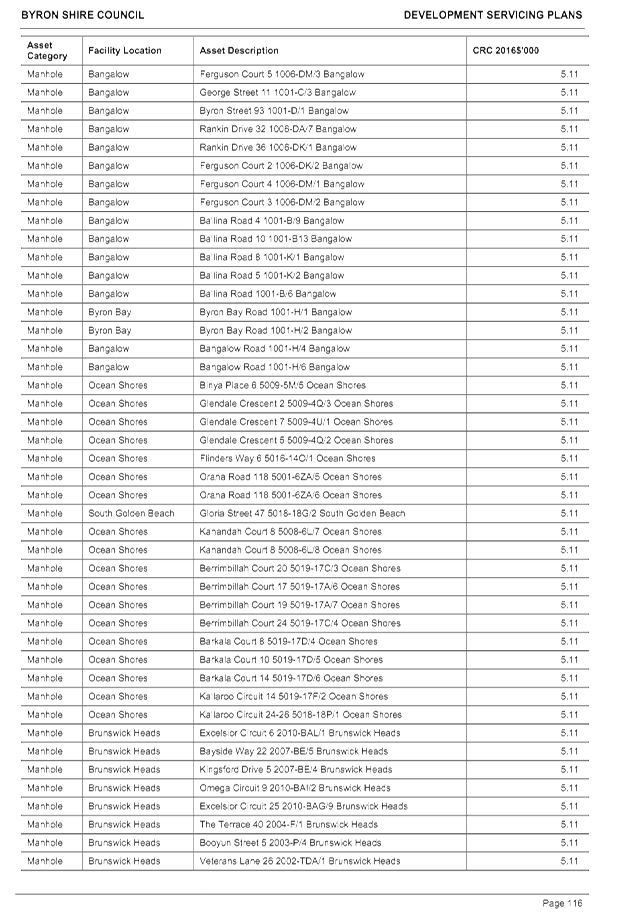
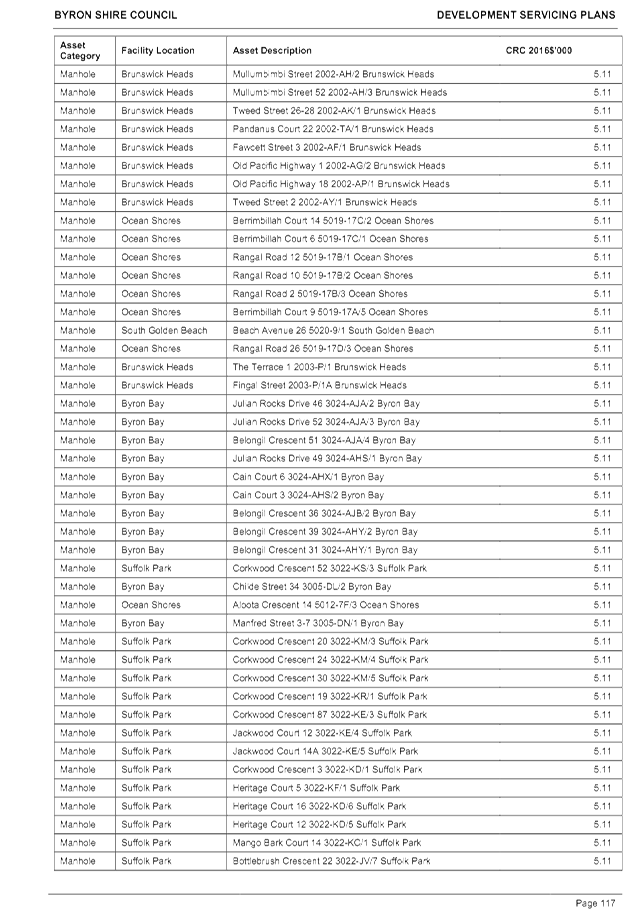
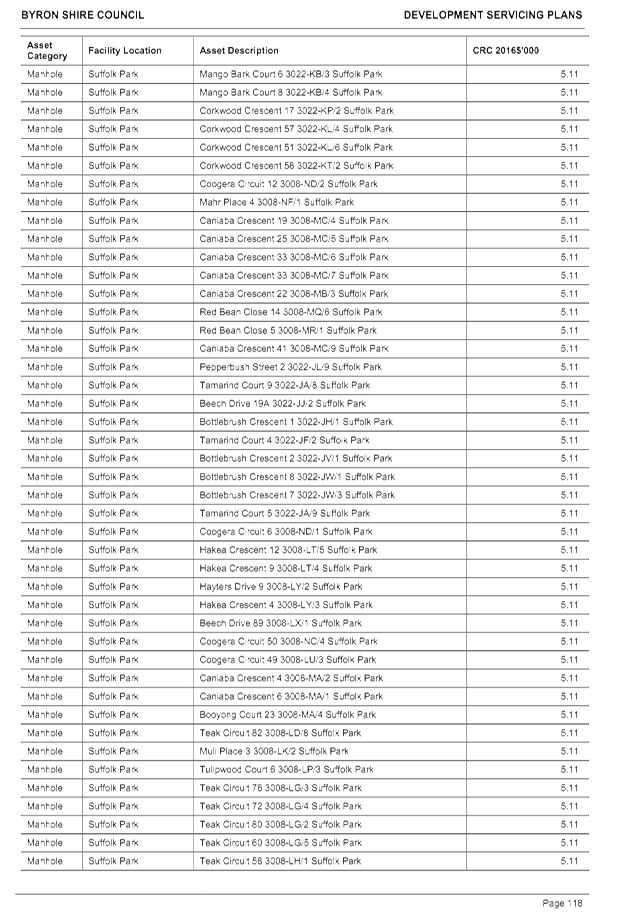
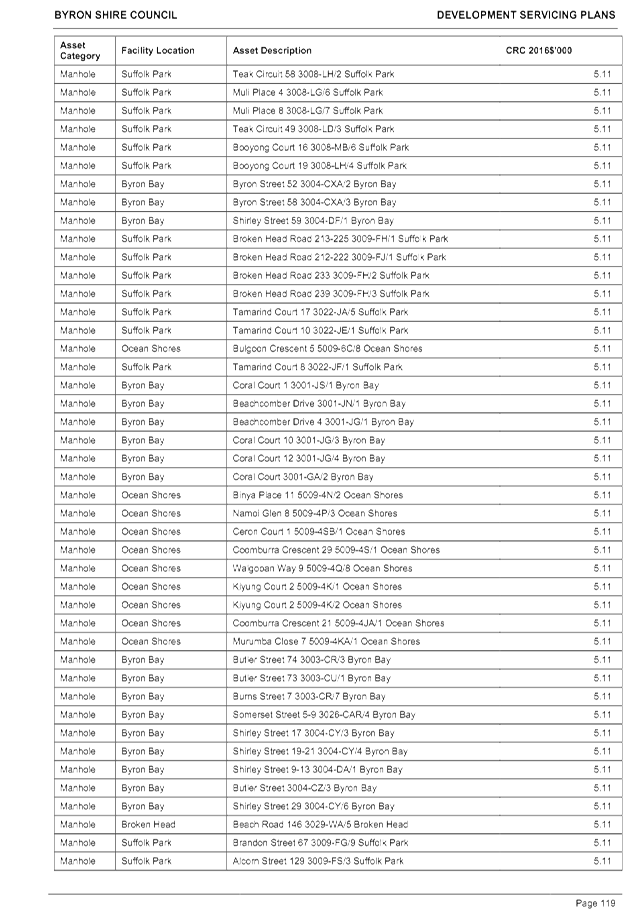
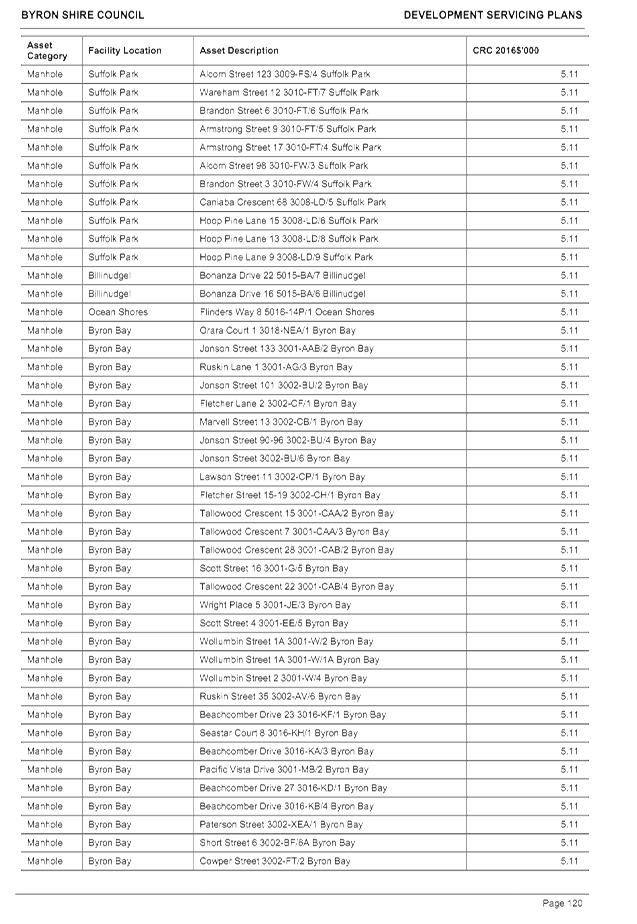
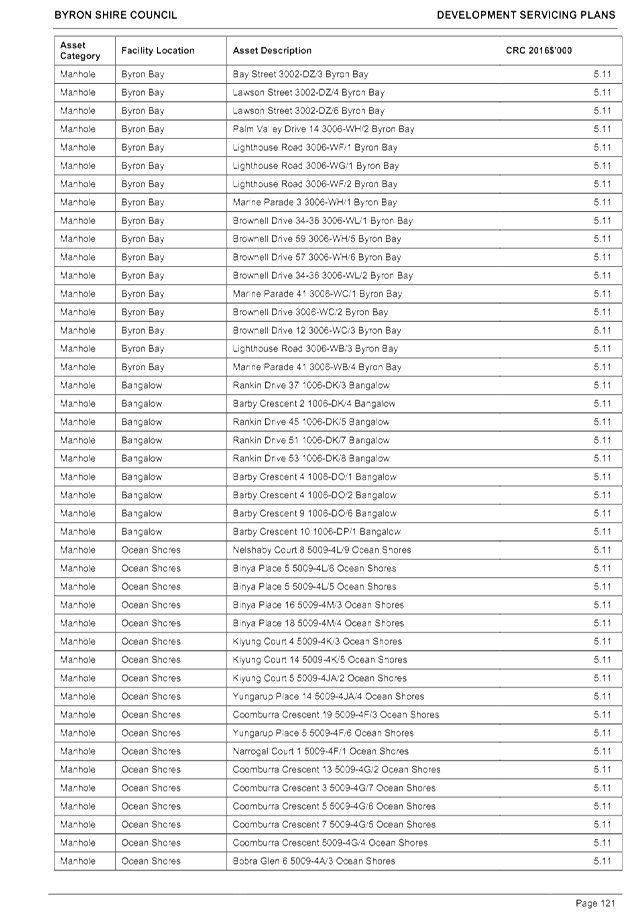
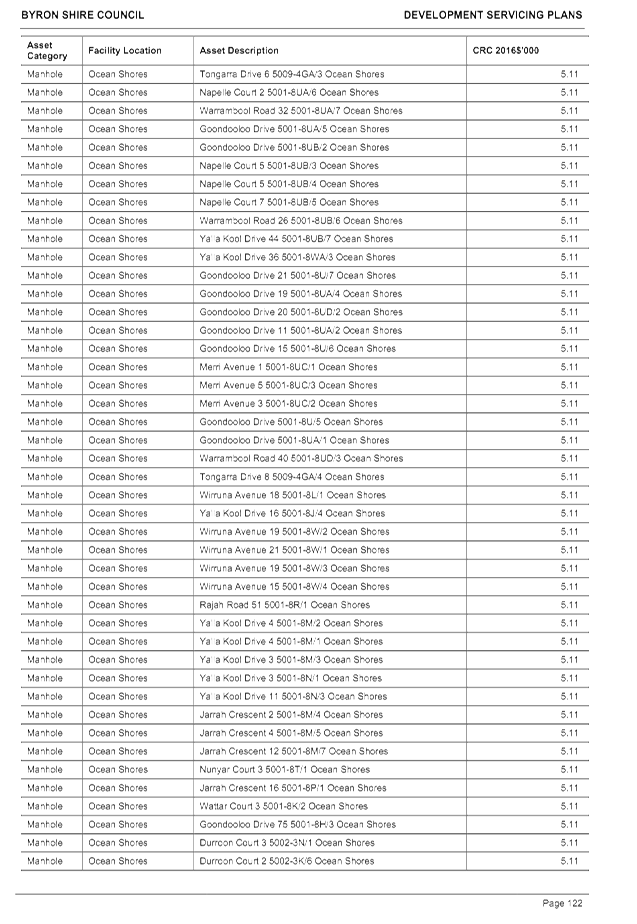
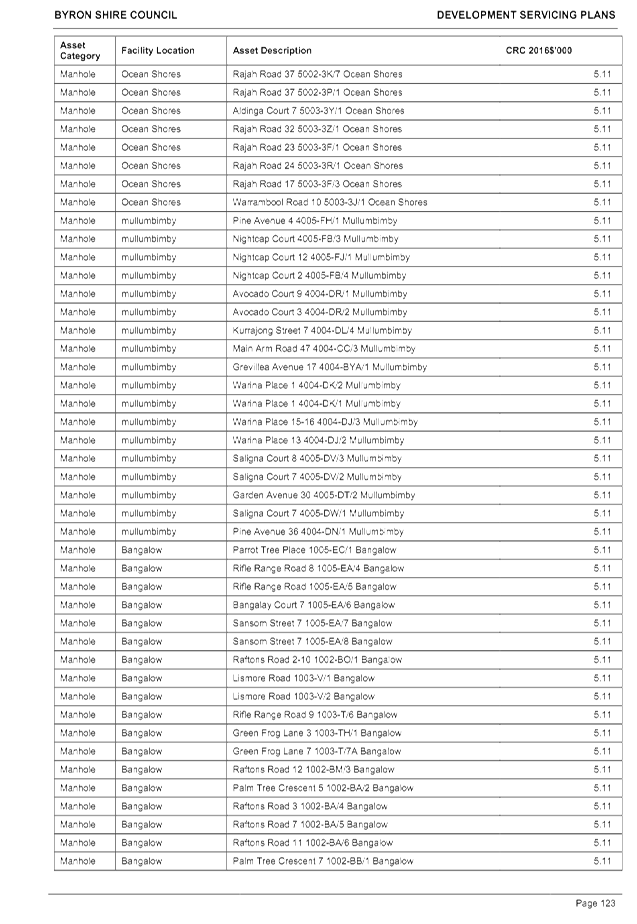
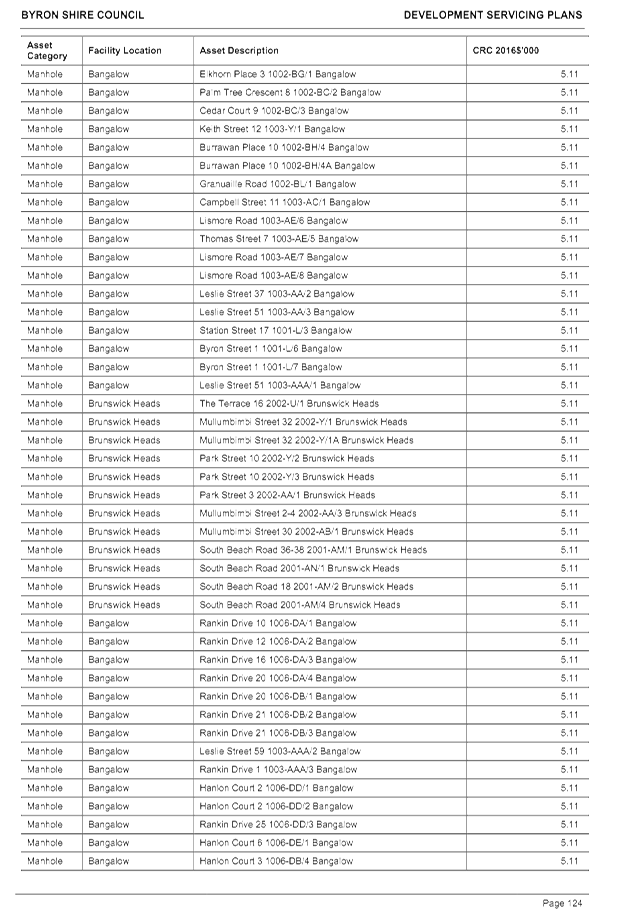
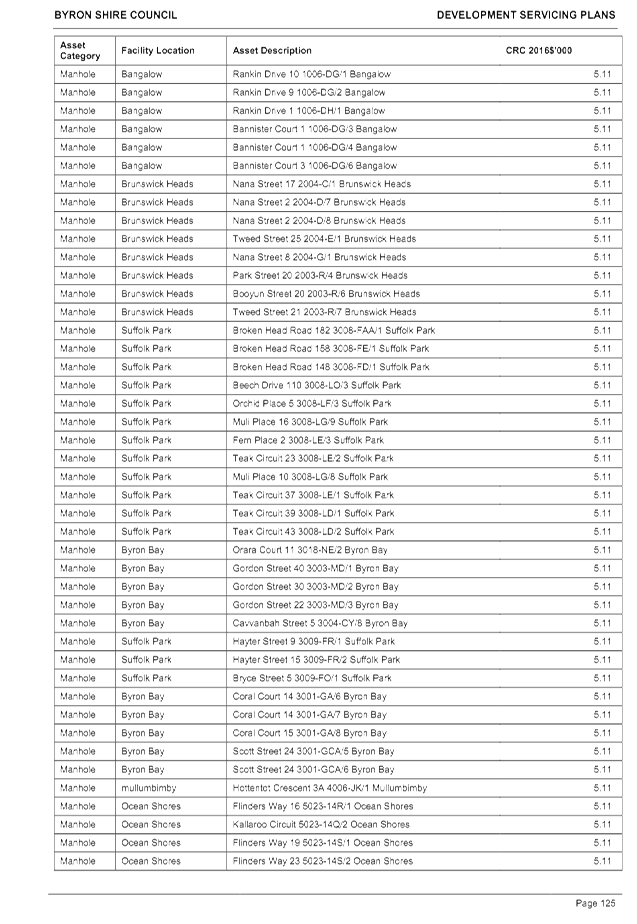
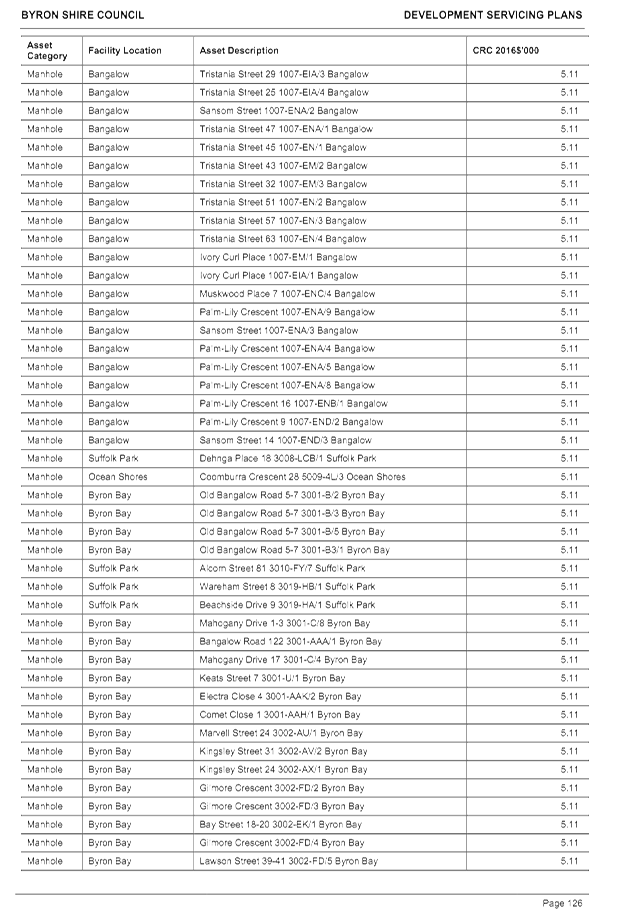
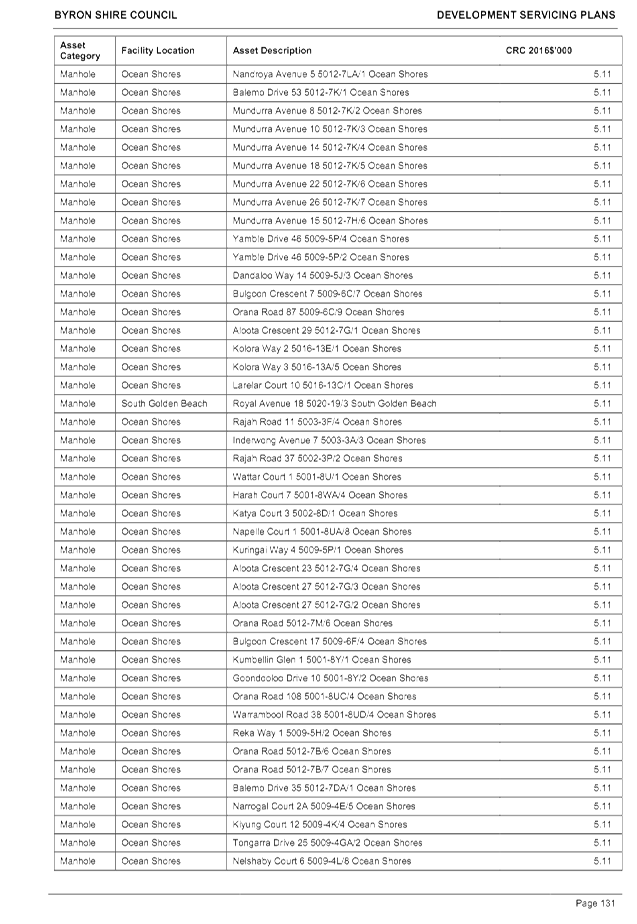
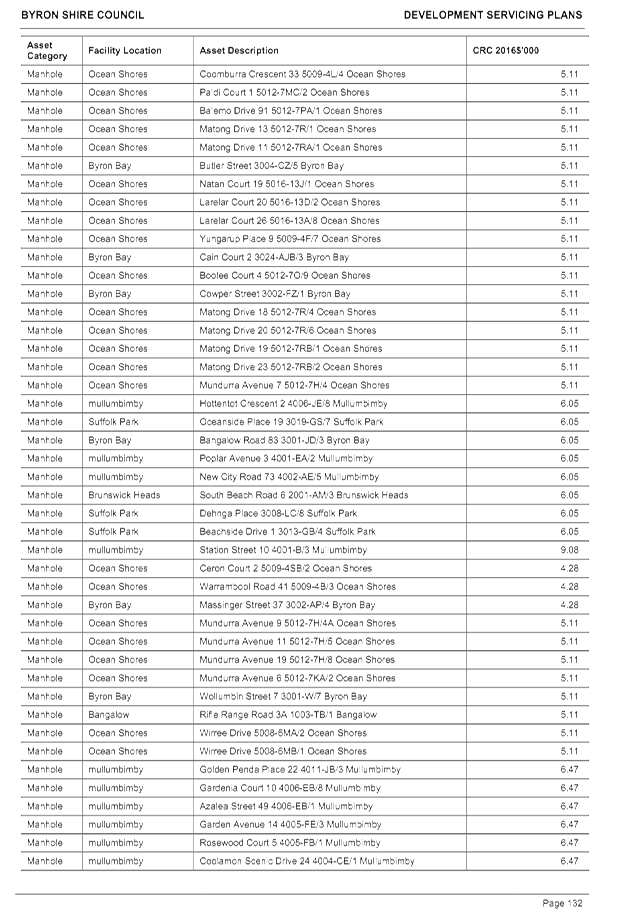
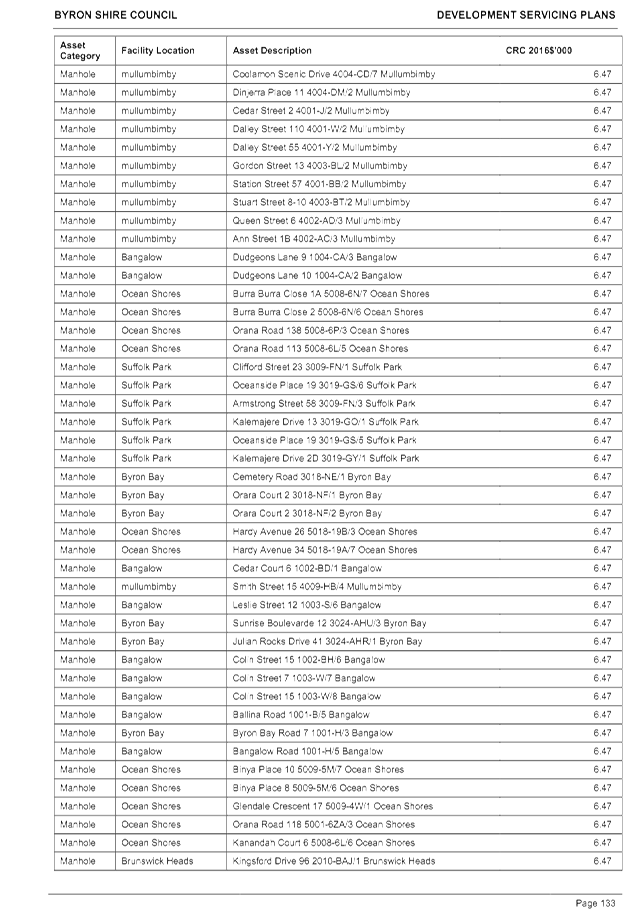
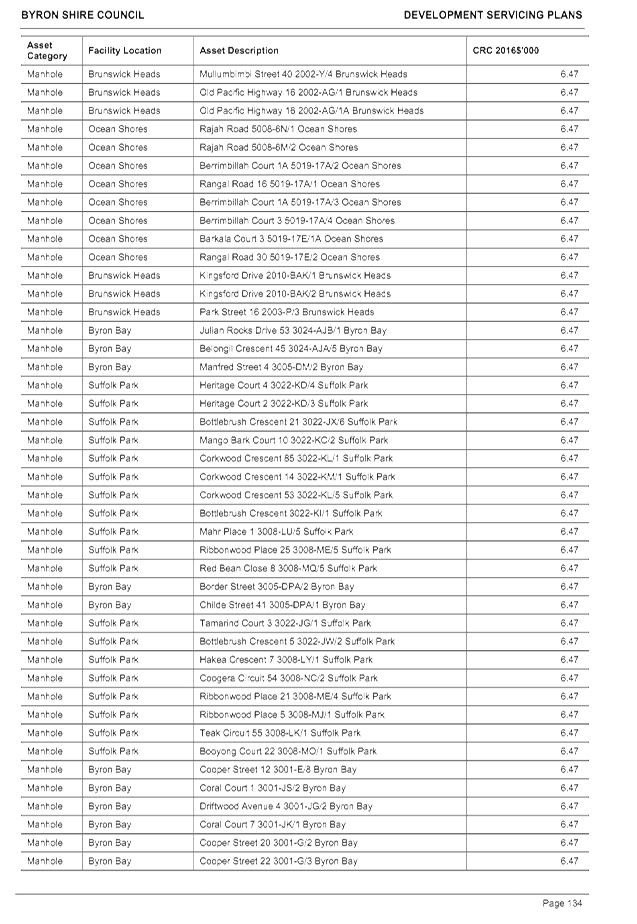
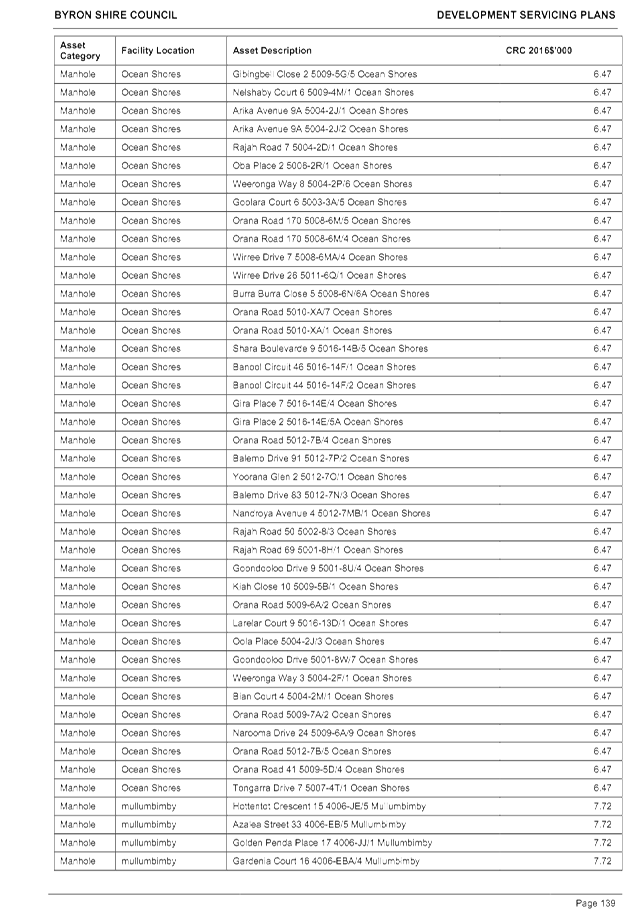
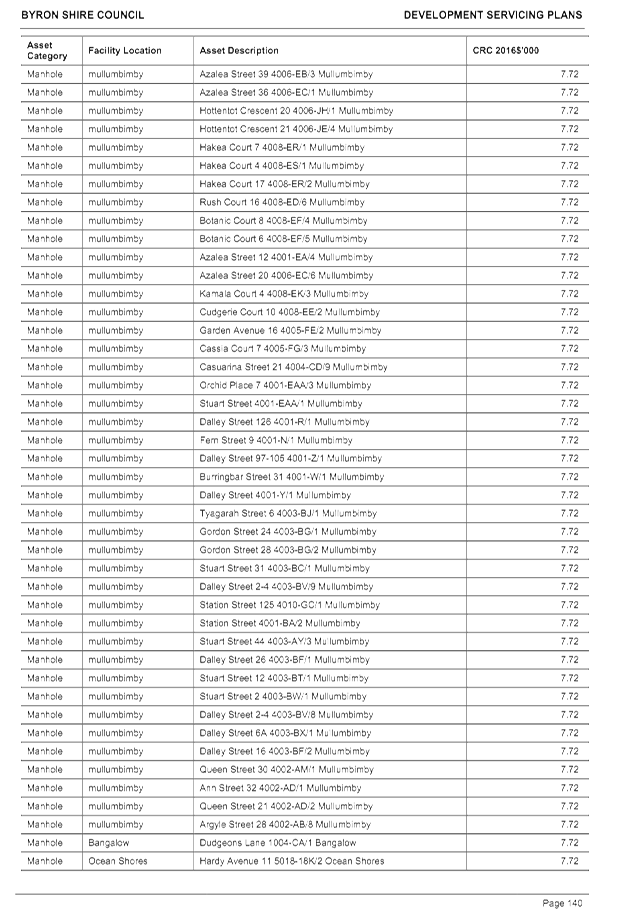
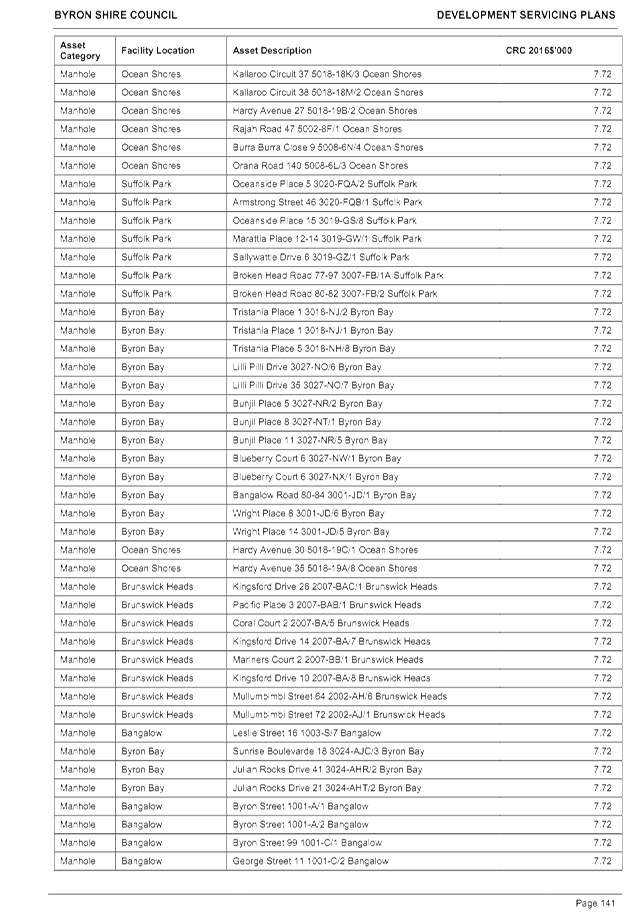
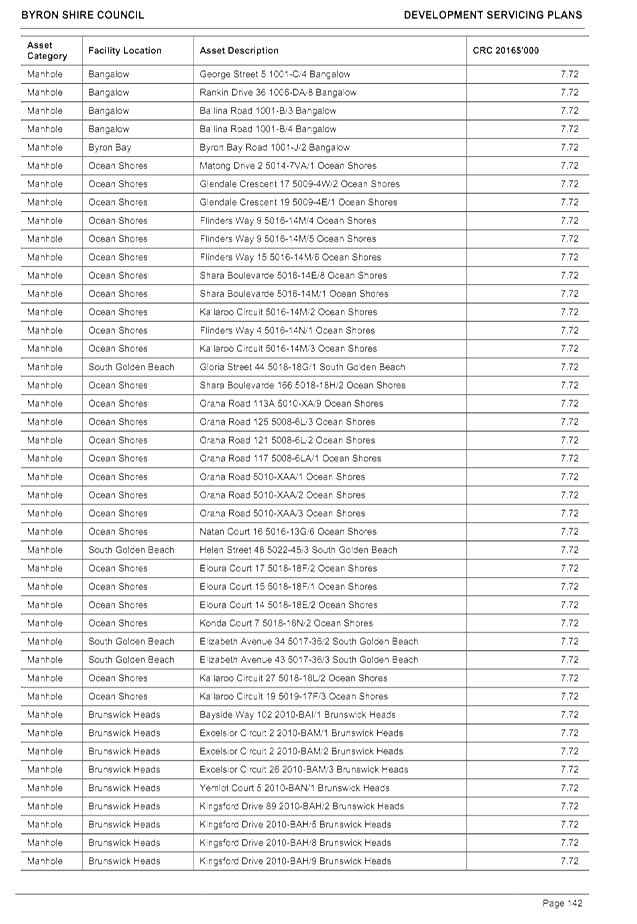
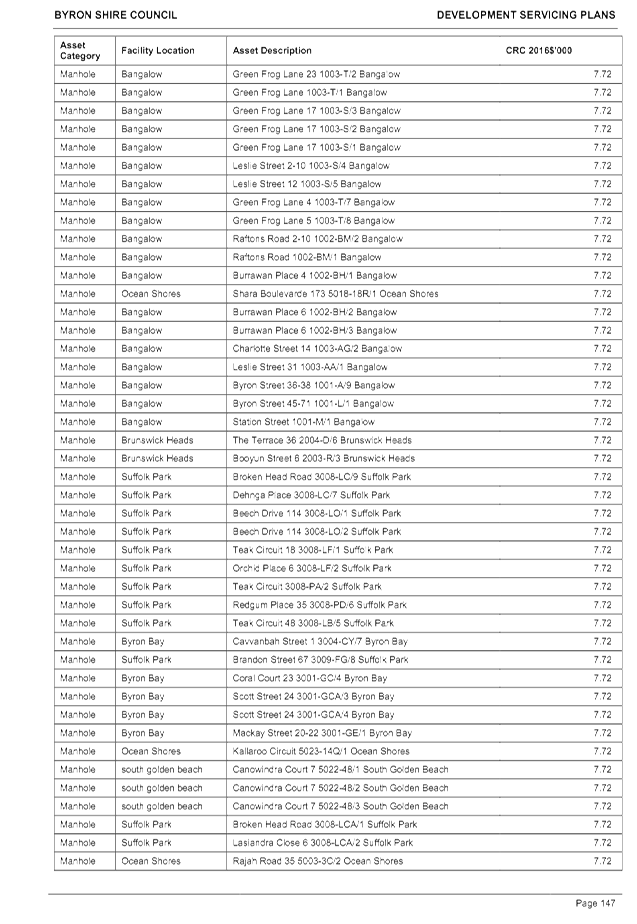
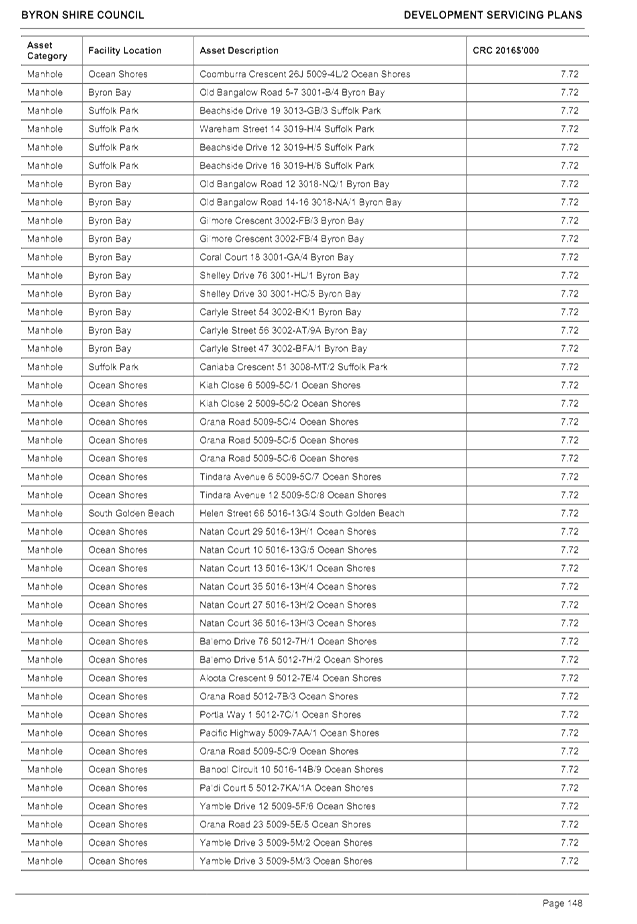
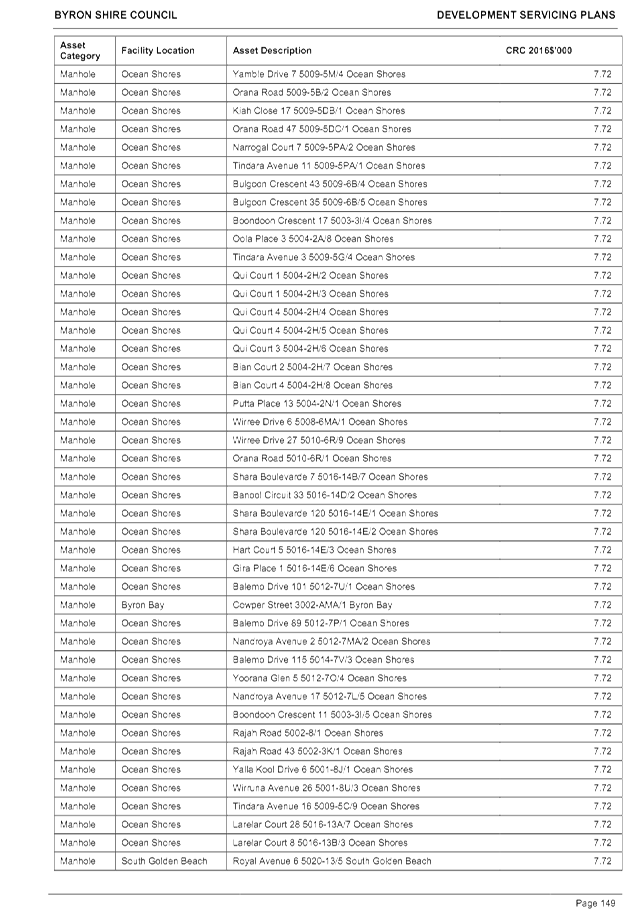
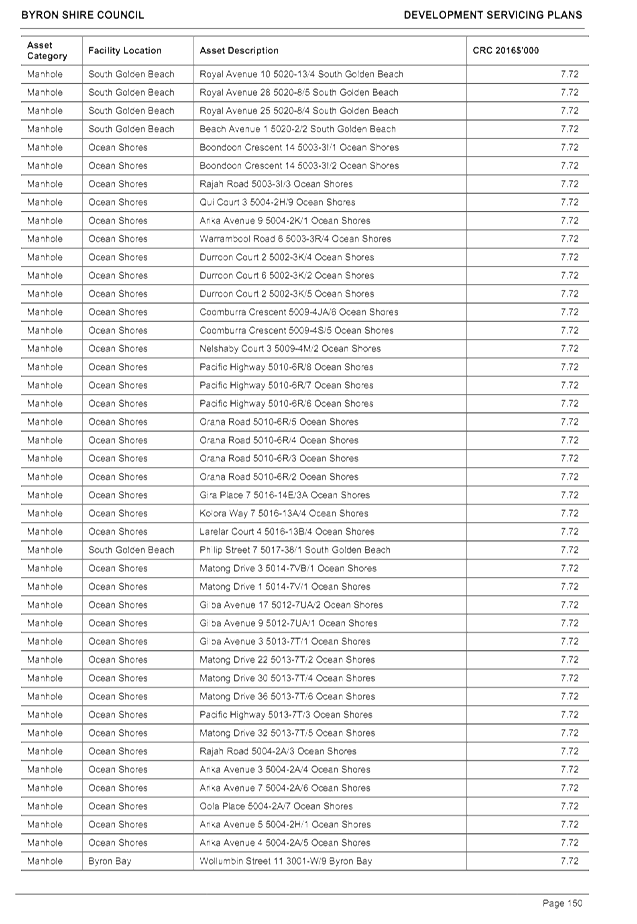
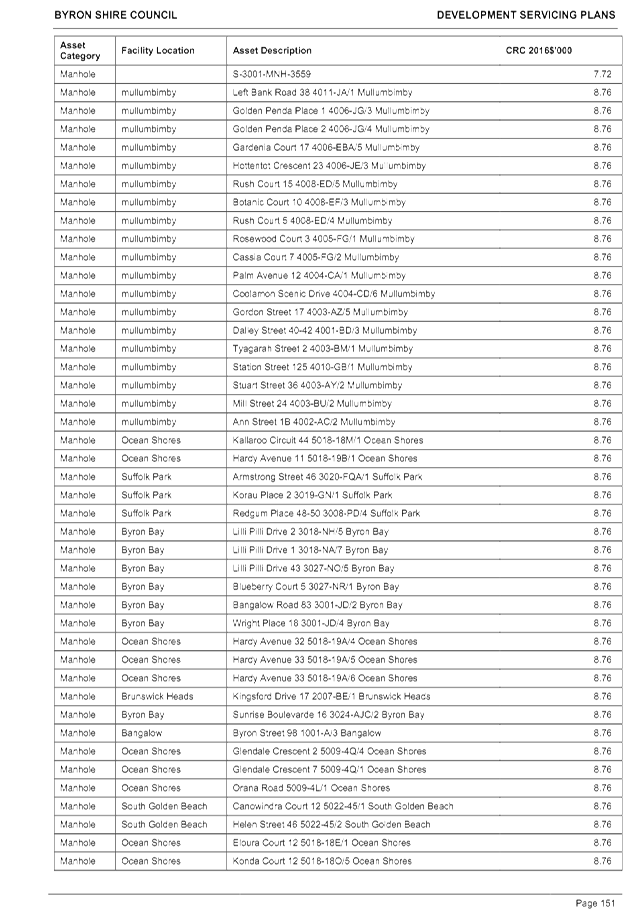
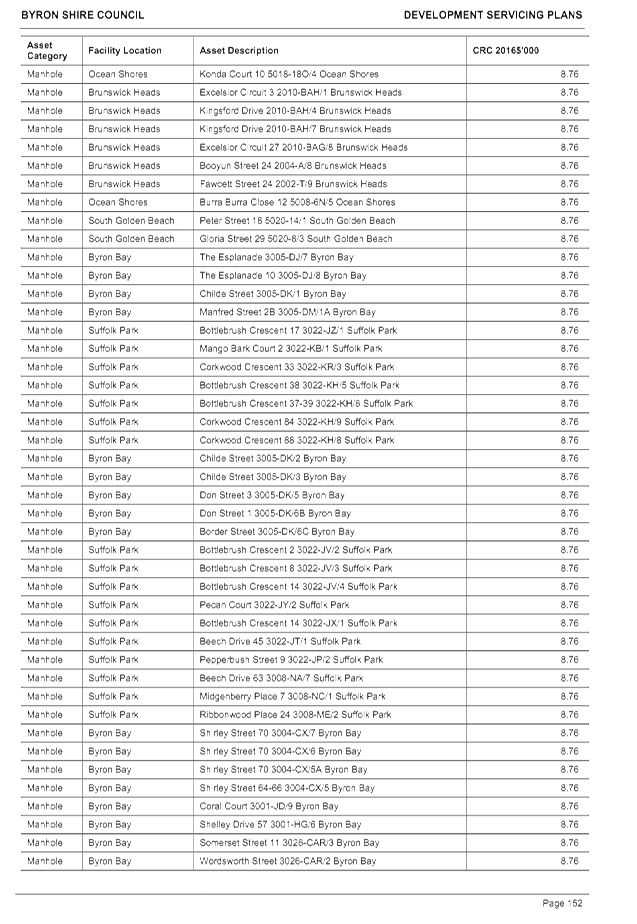
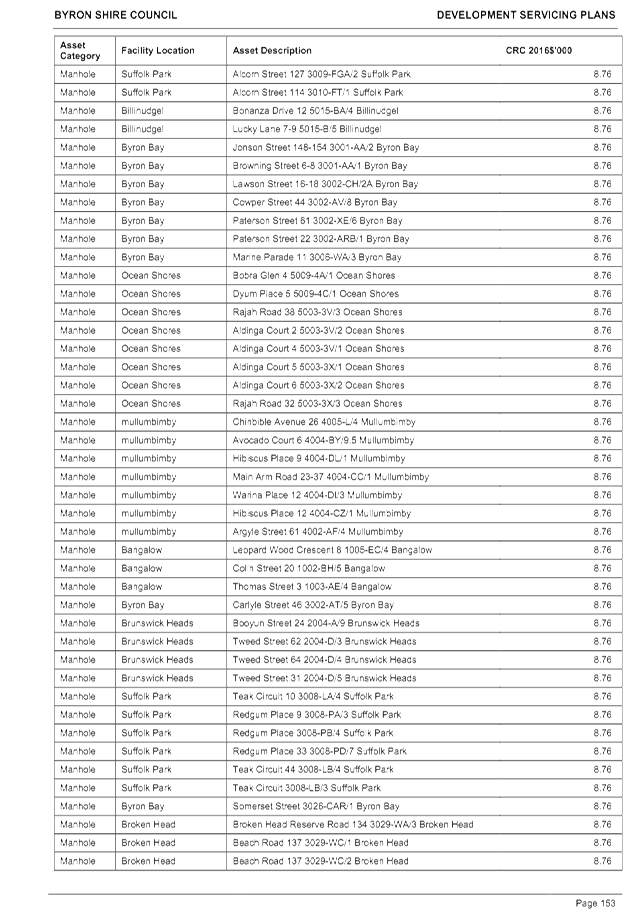
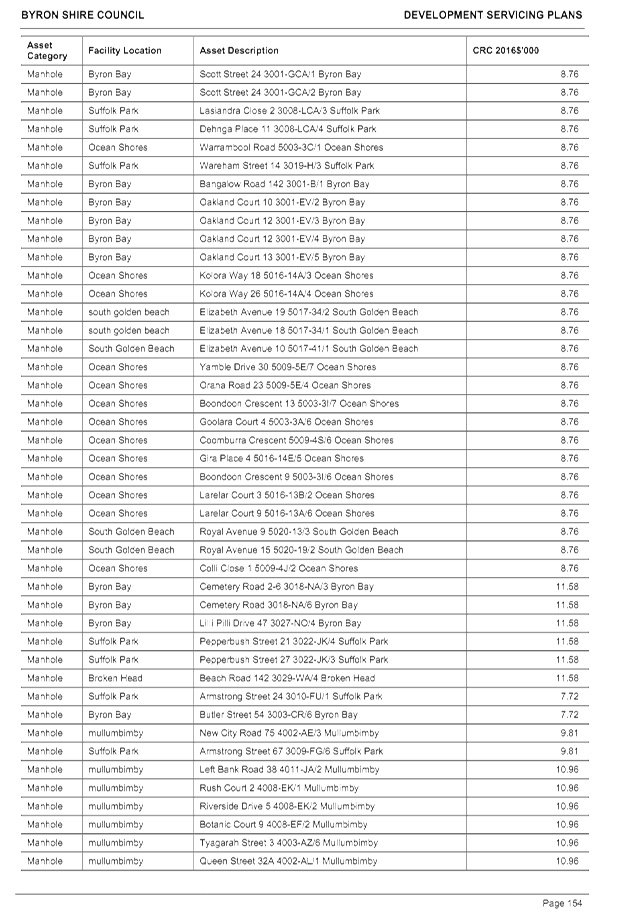
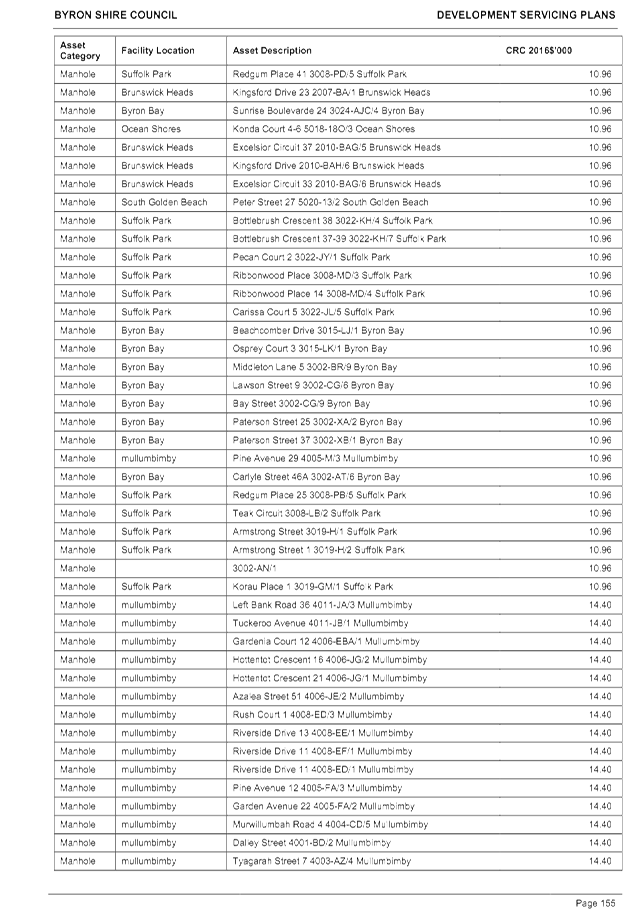
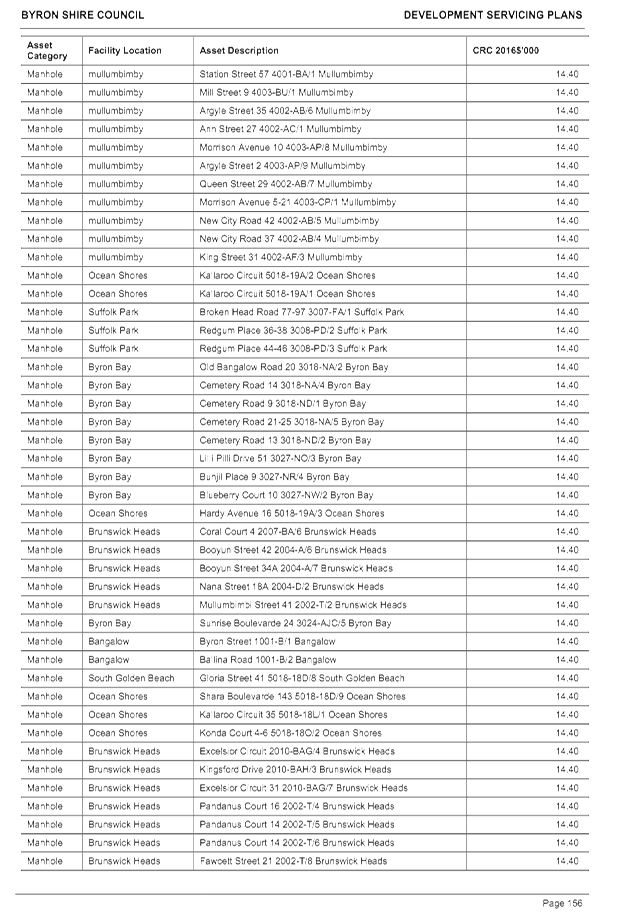
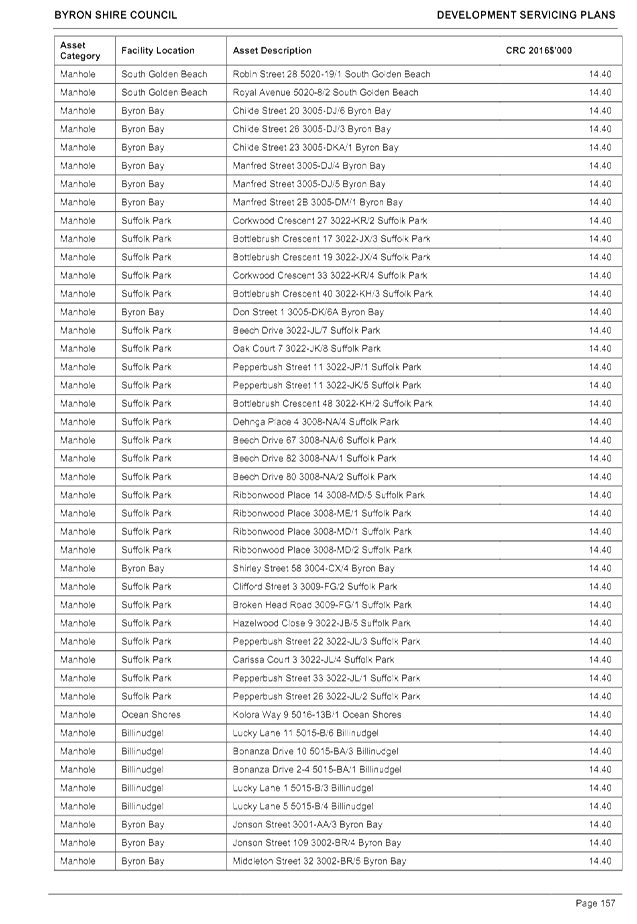
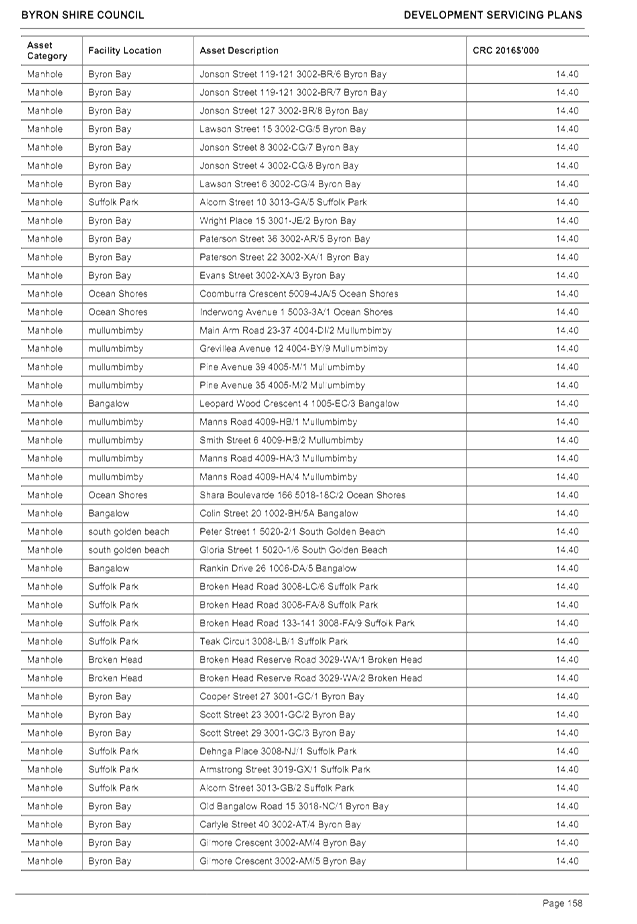
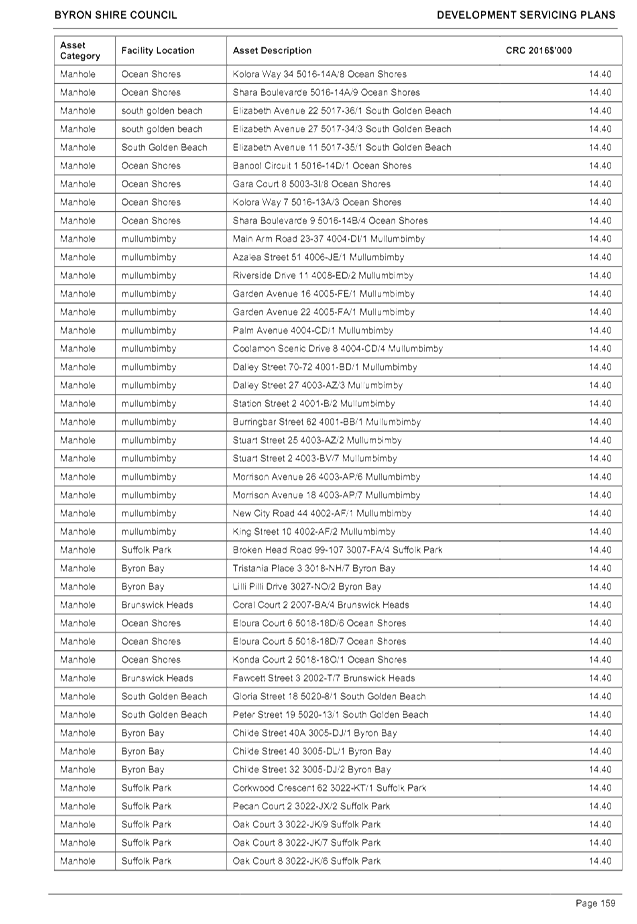
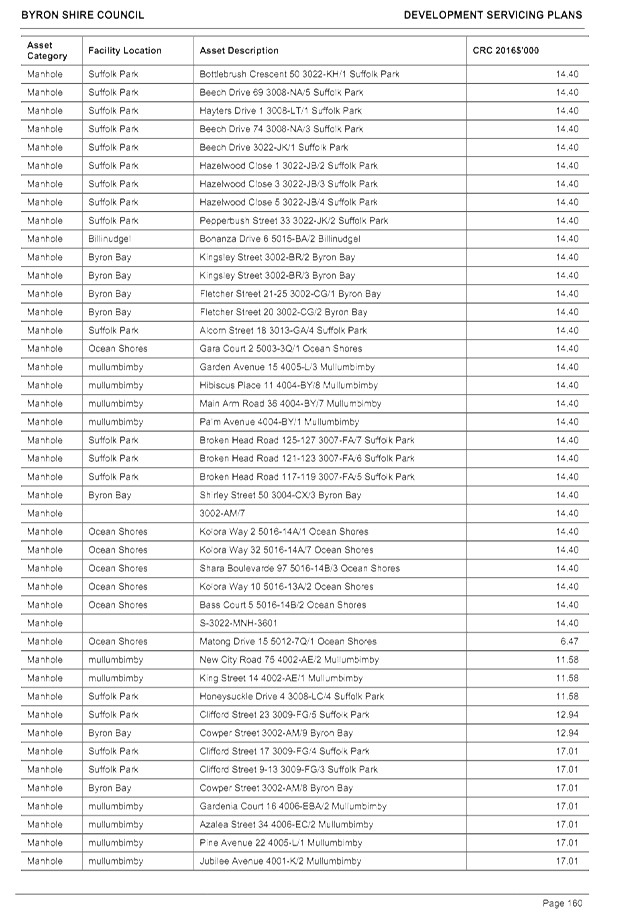
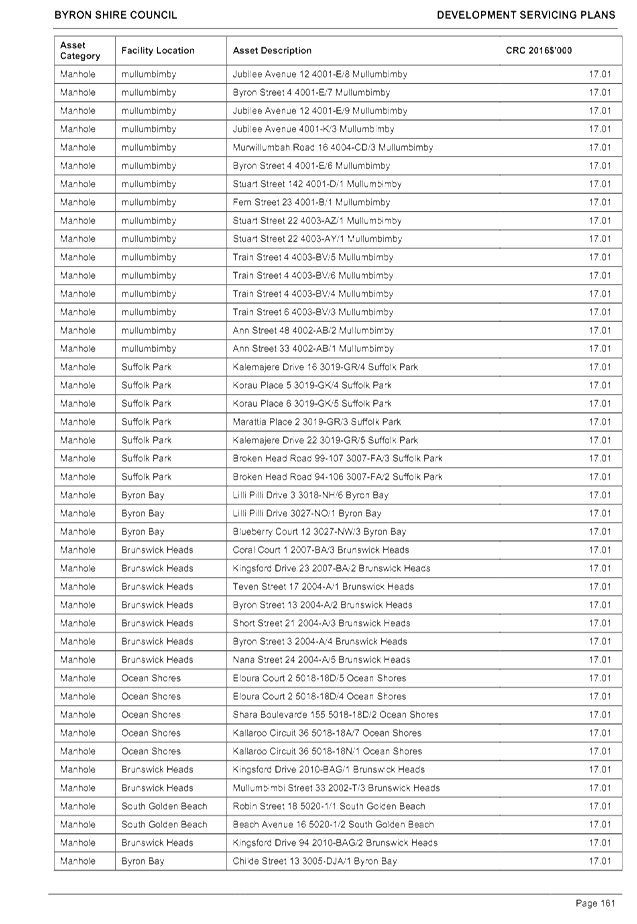
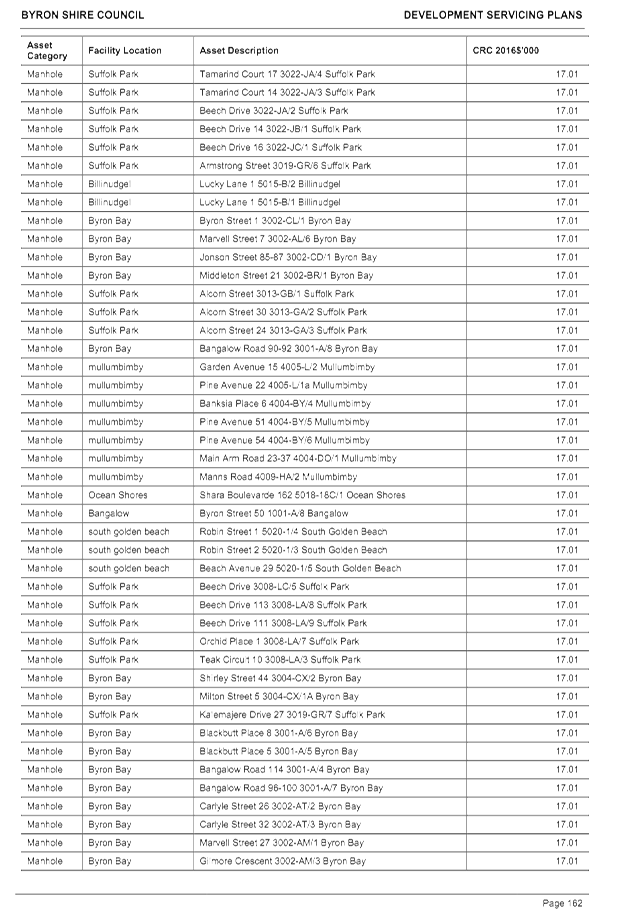
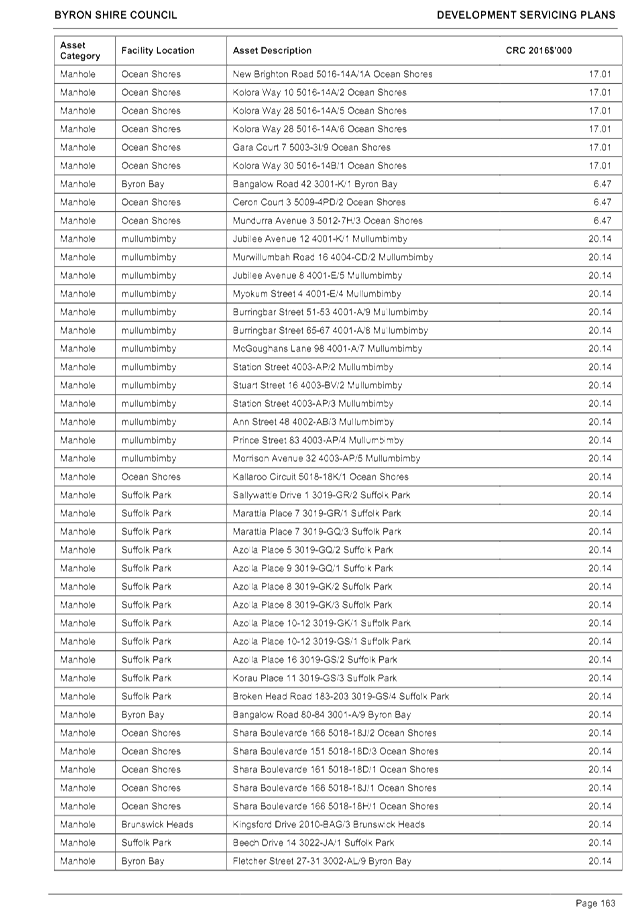
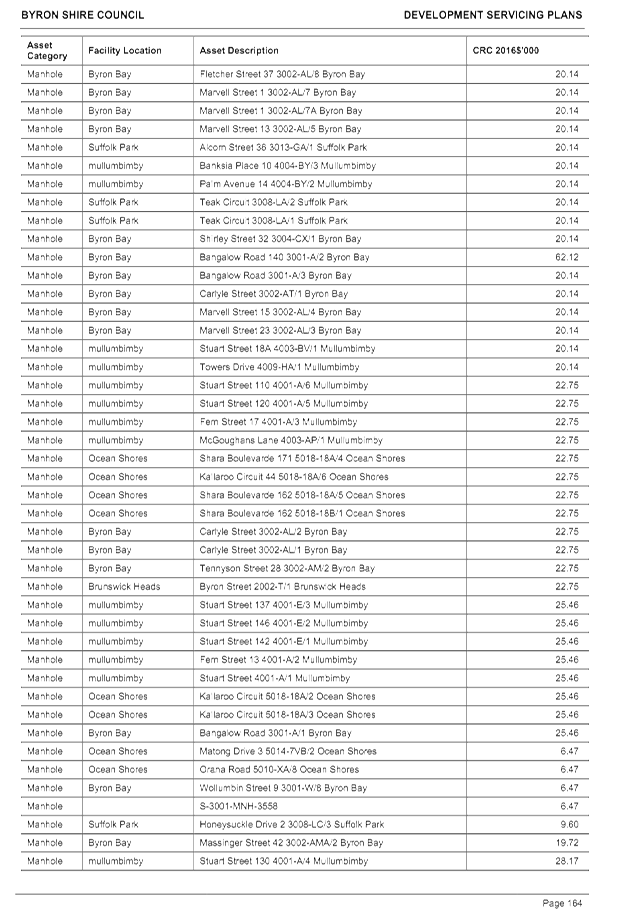
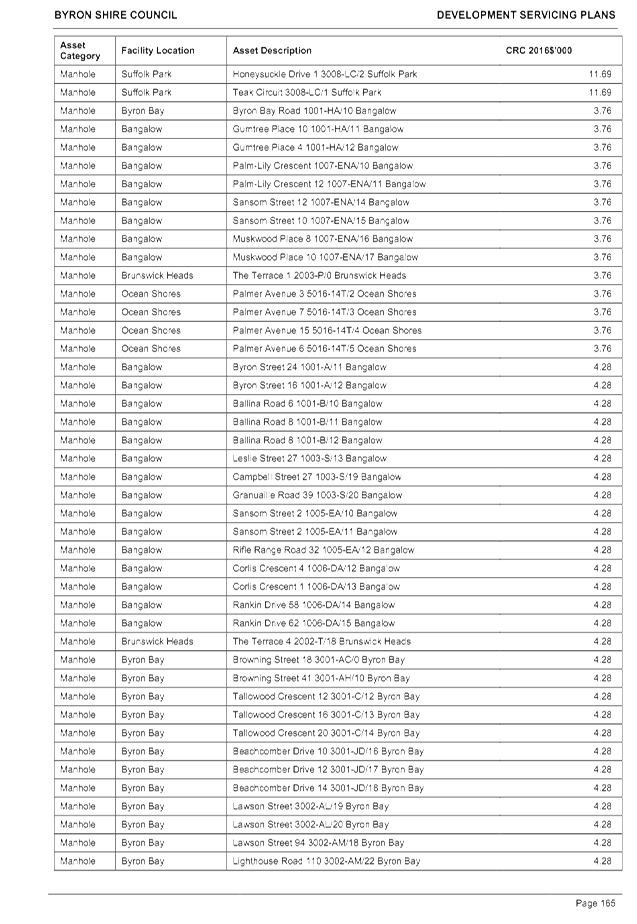
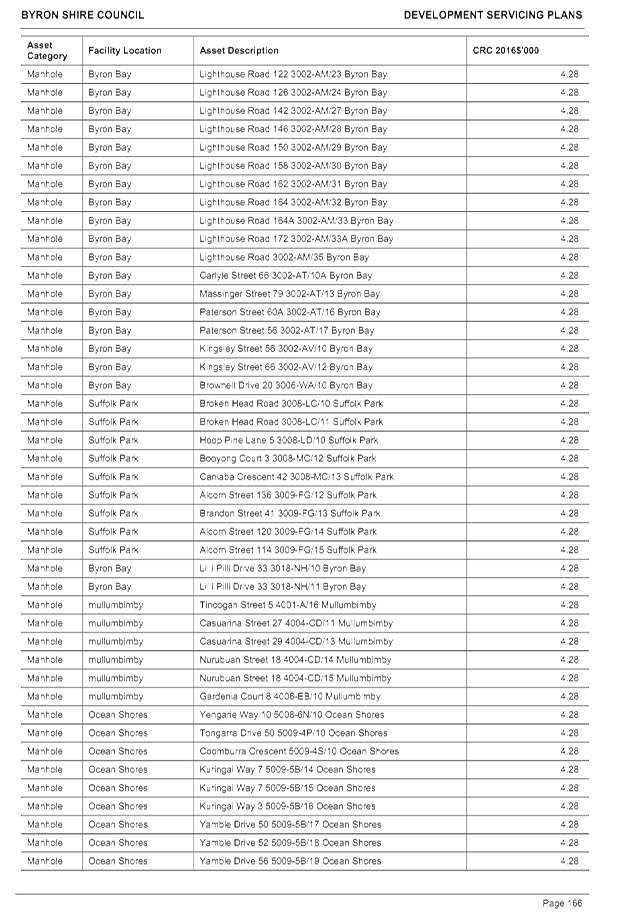
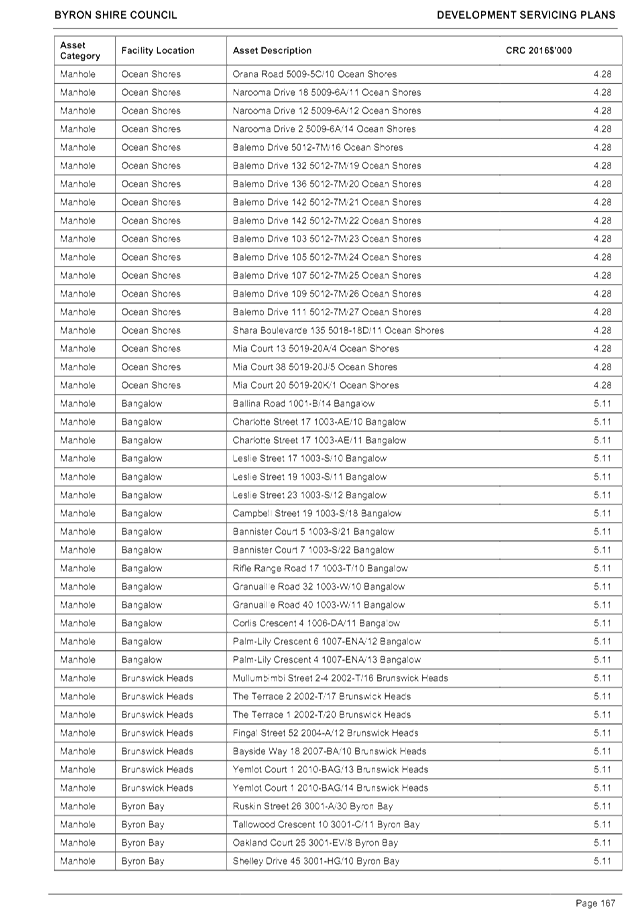
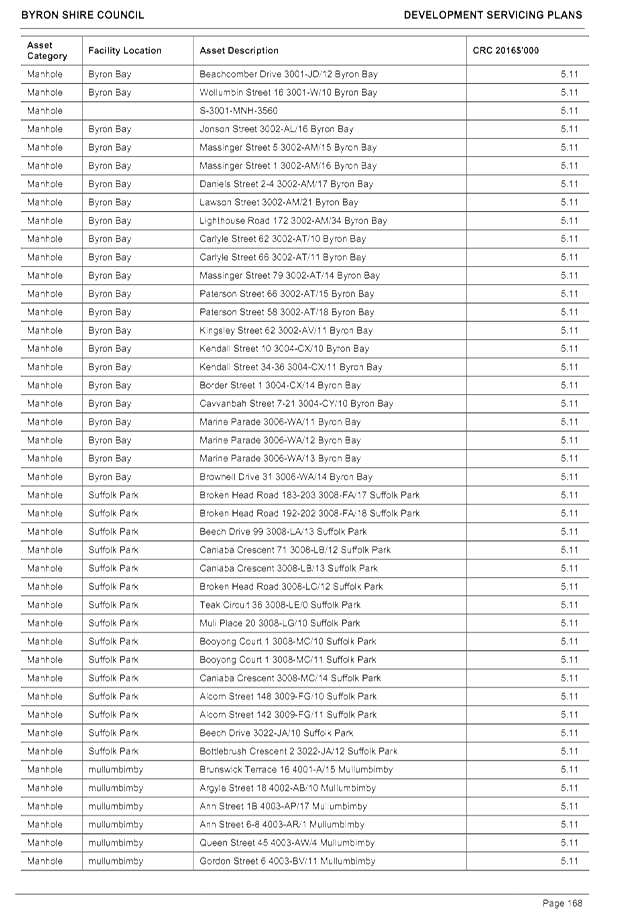
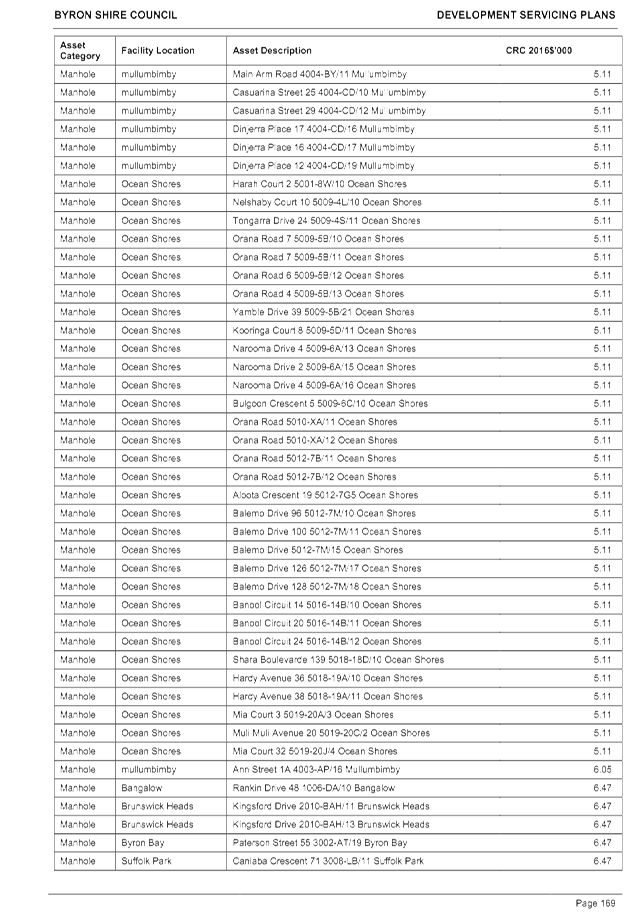
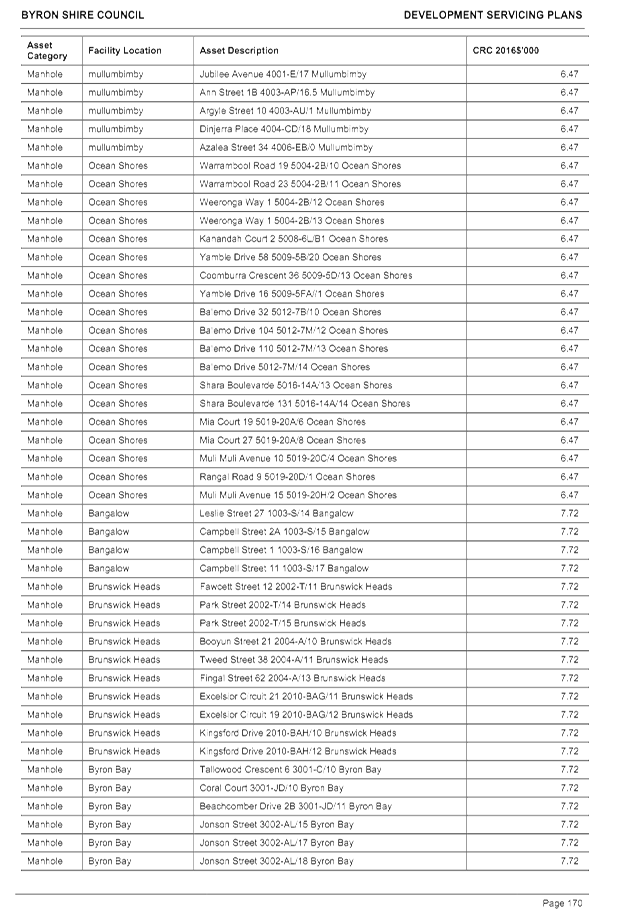
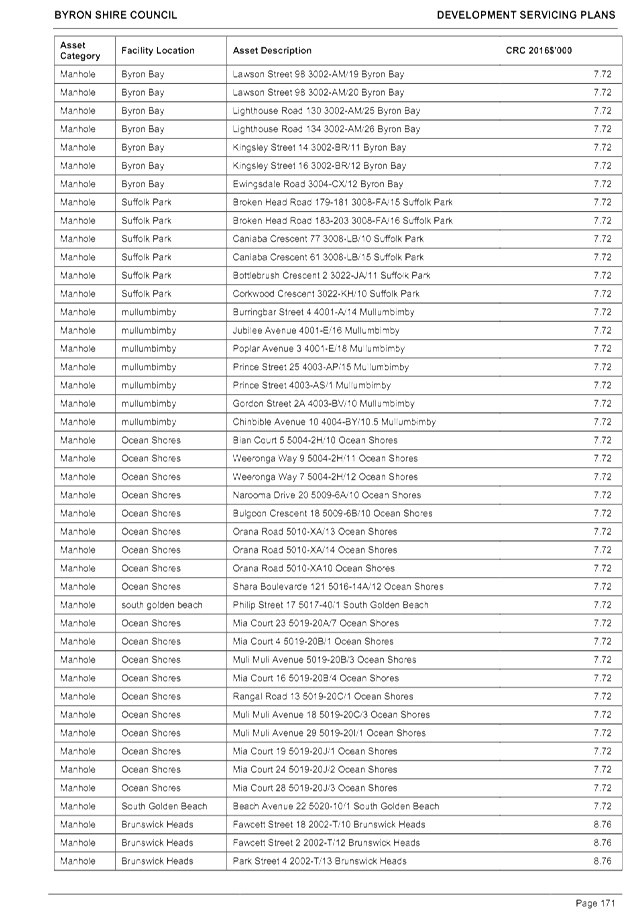
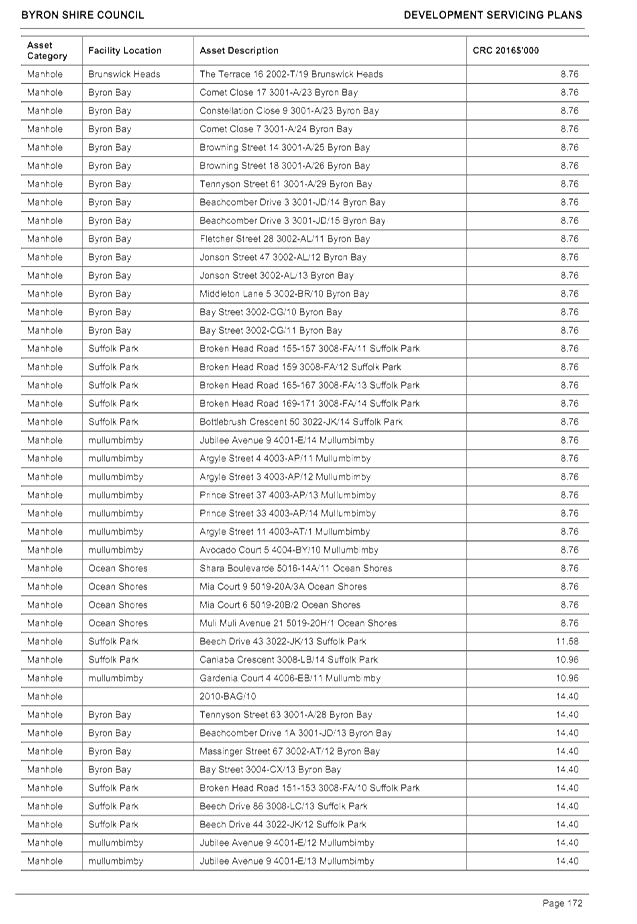
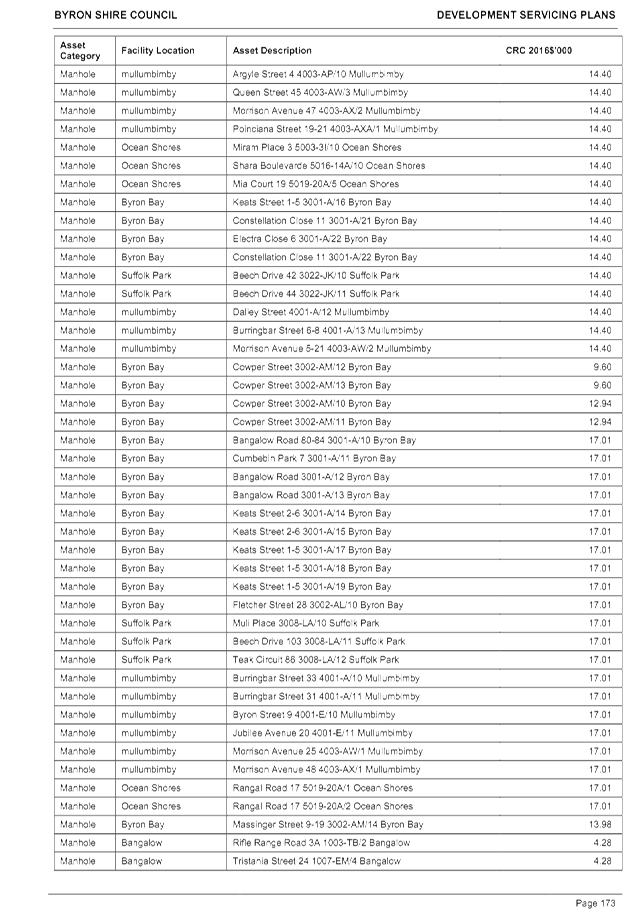
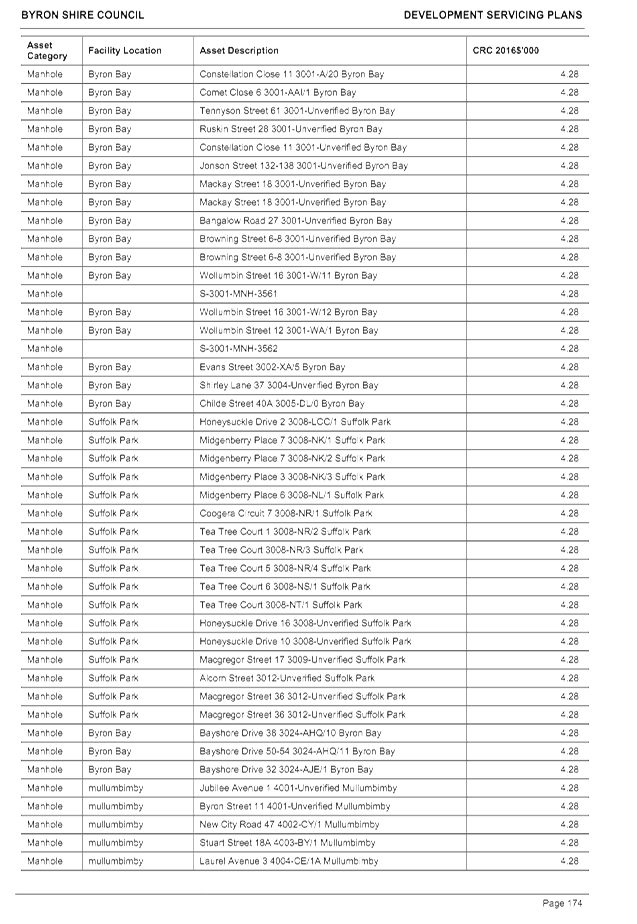
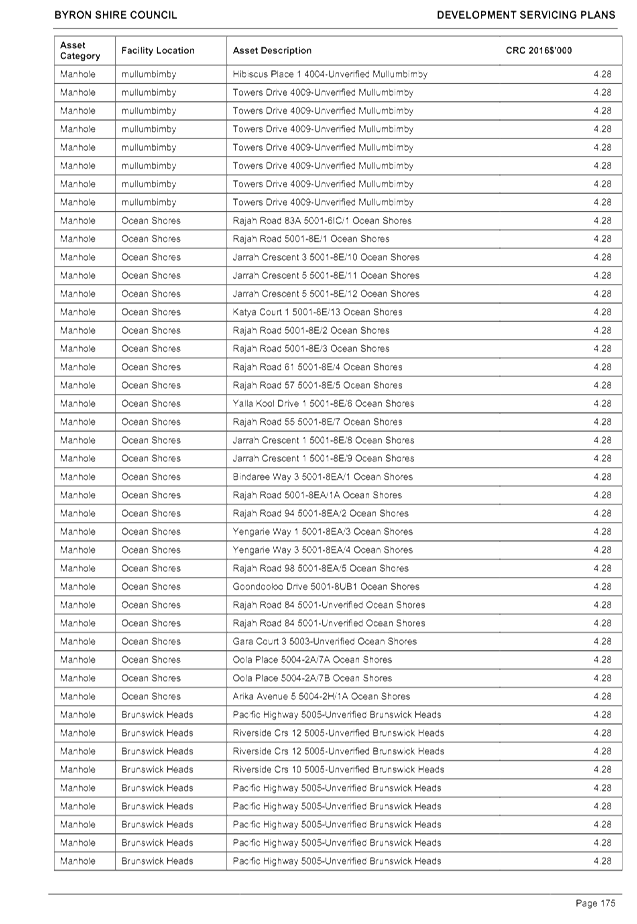
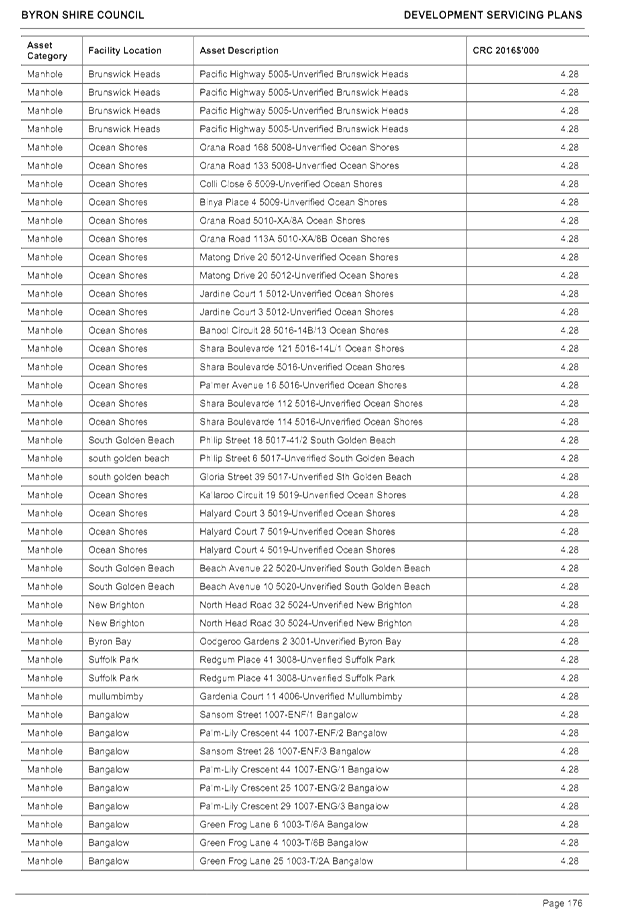
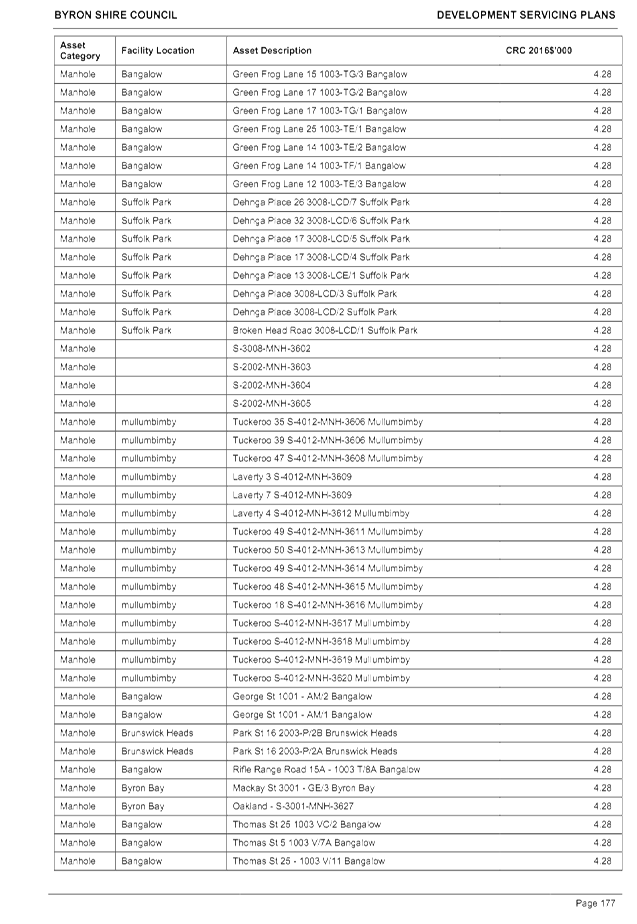
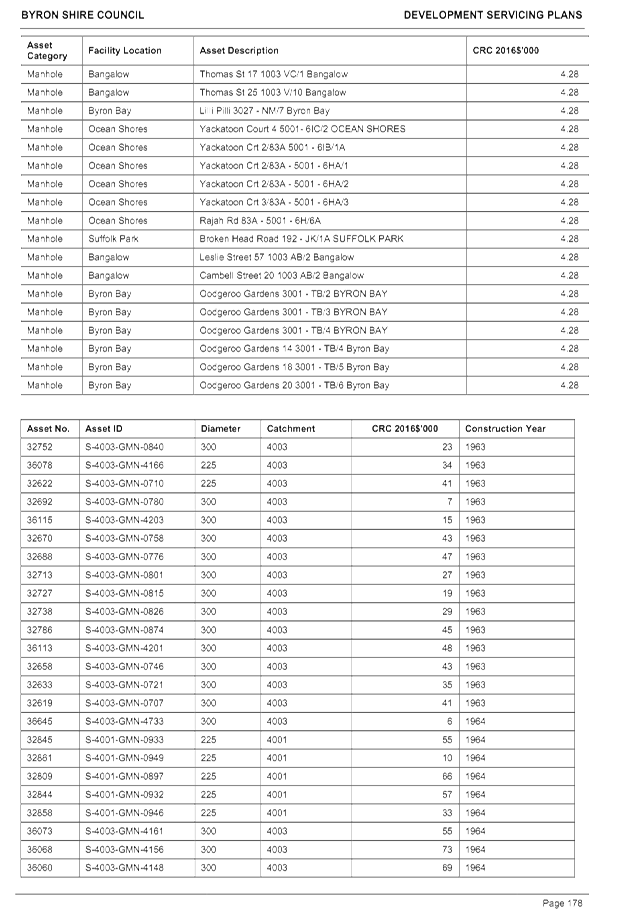
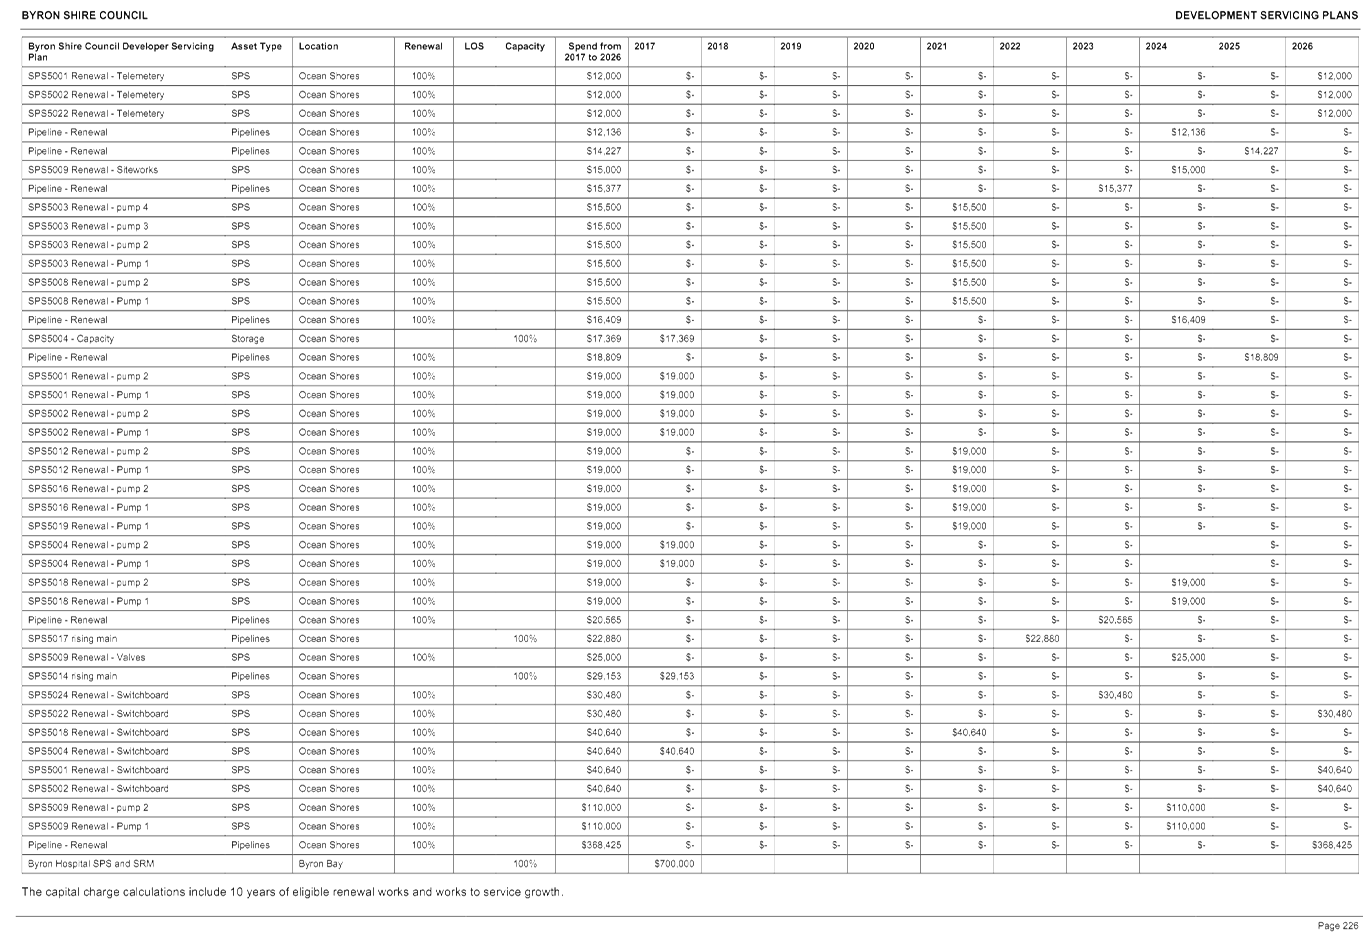
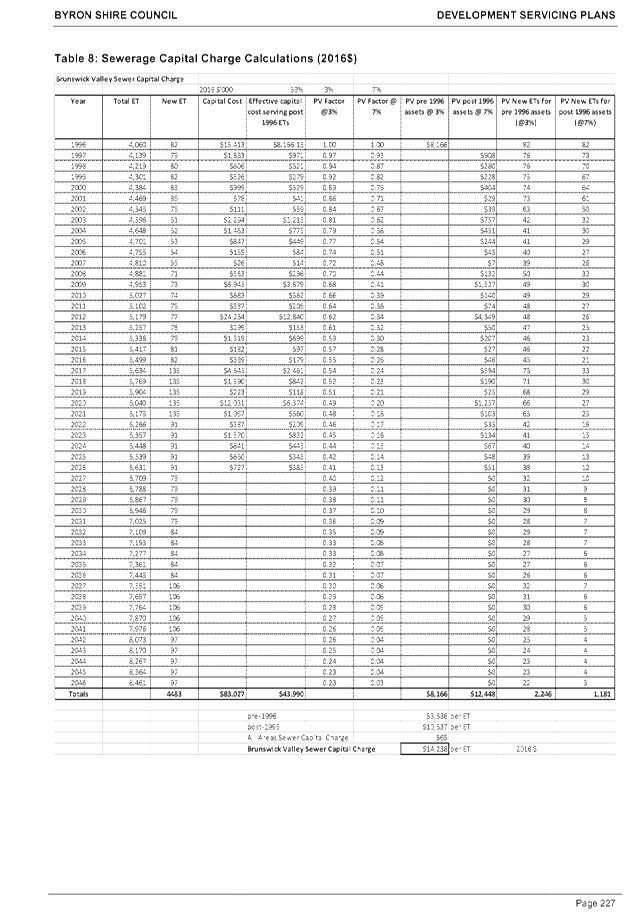
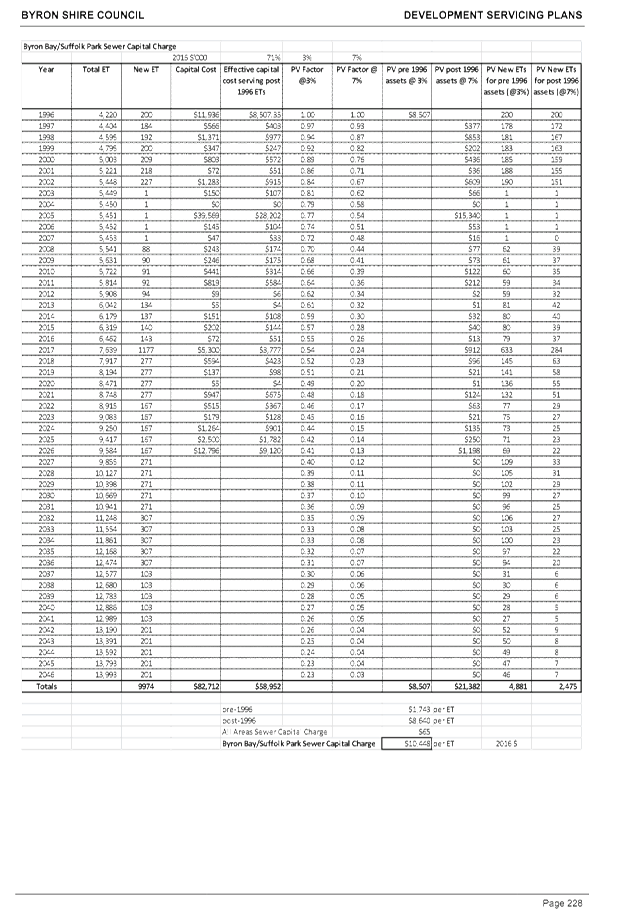
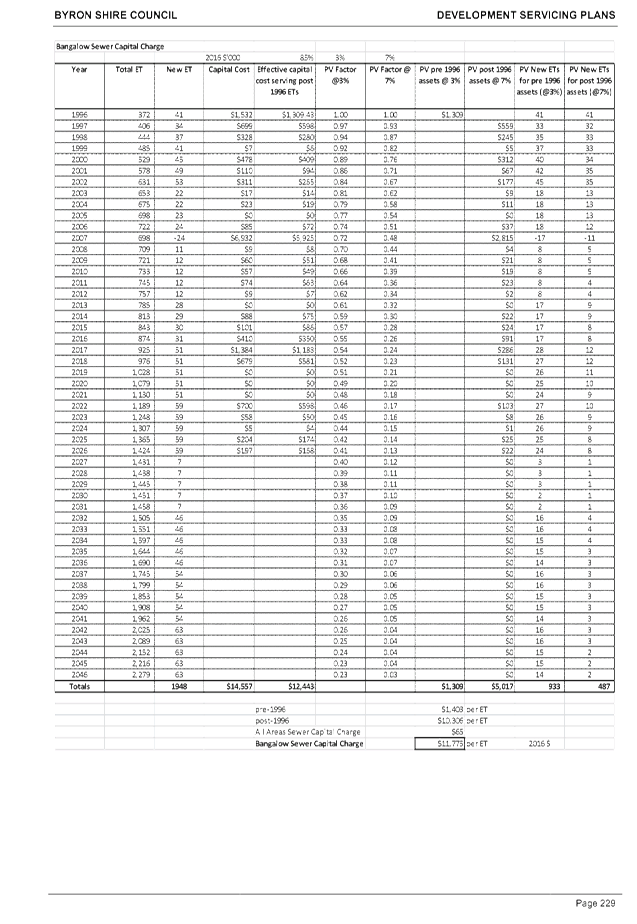
6.1 Developer
Servicing Rates
Attachment
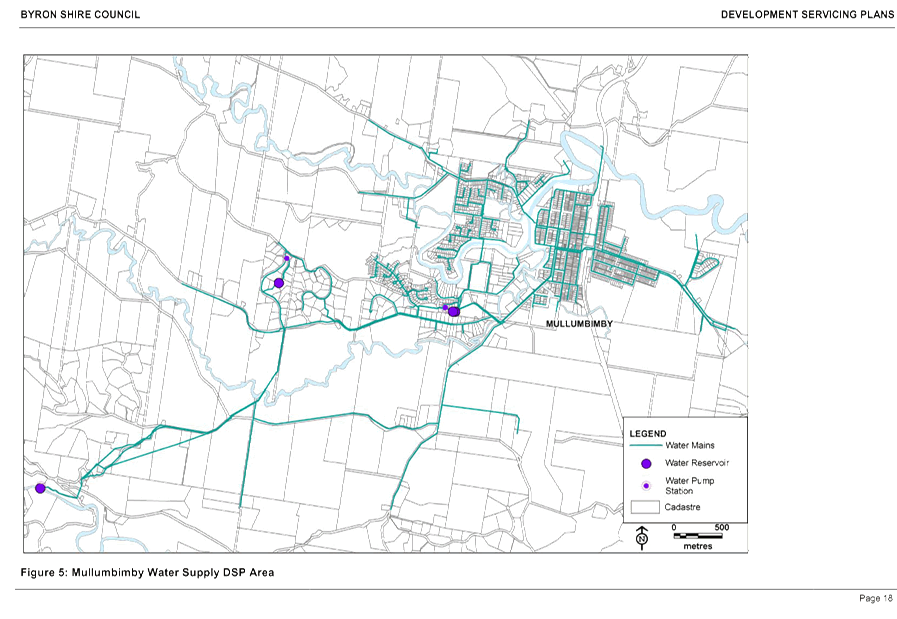
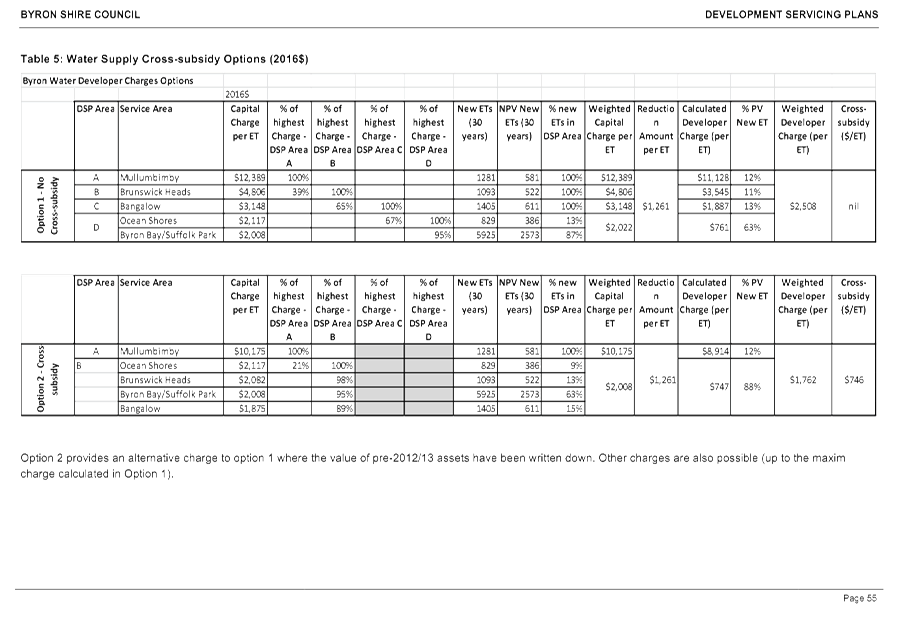
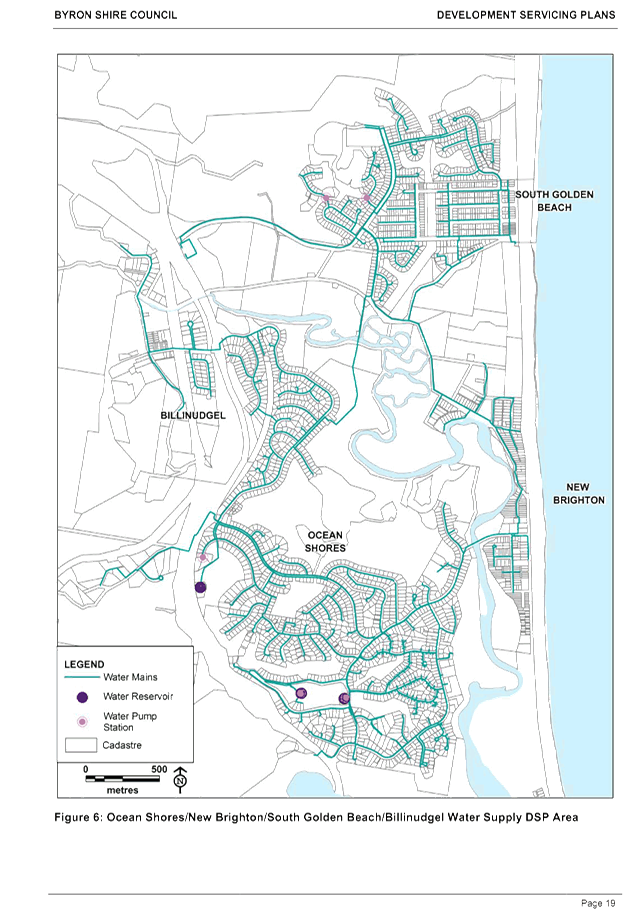
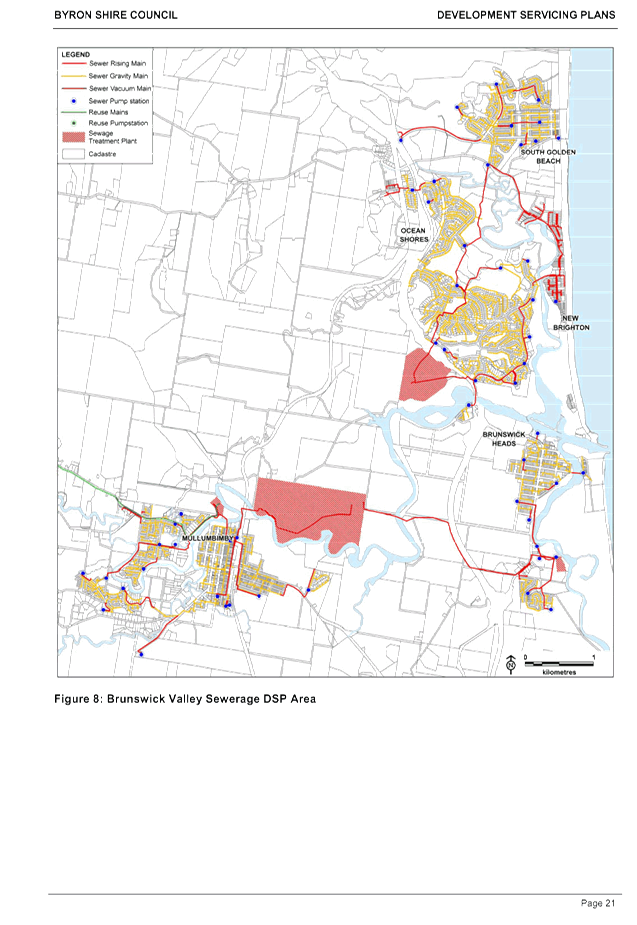
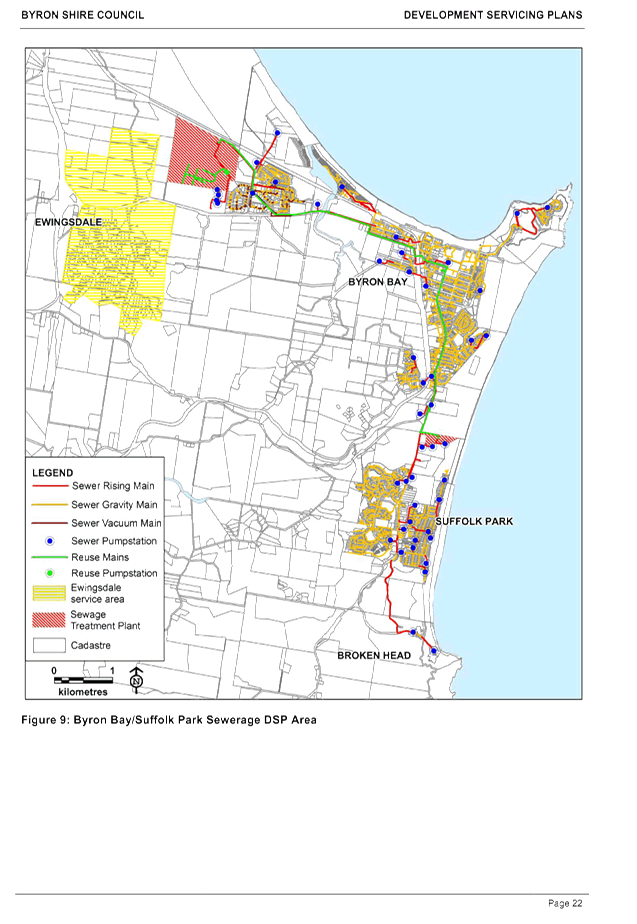
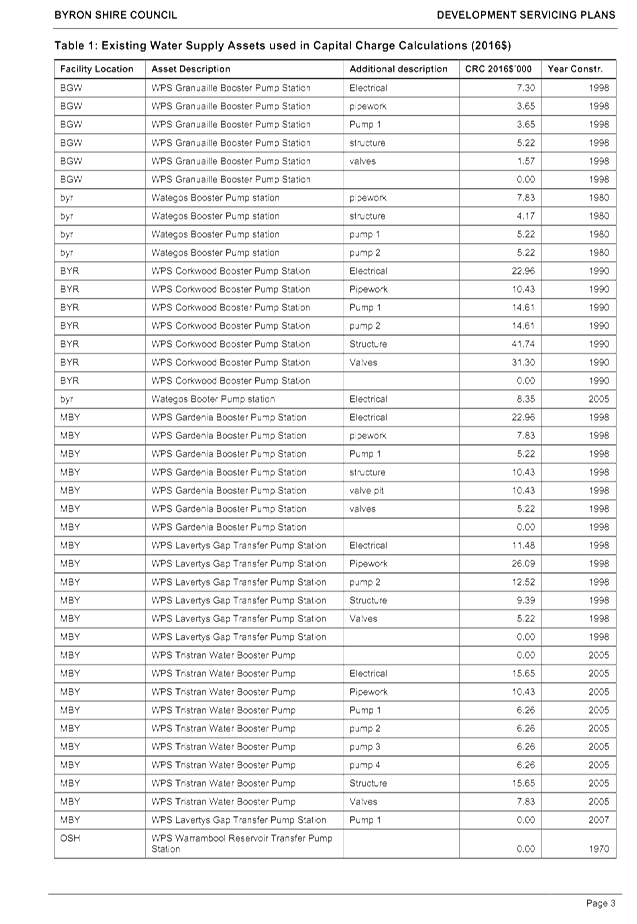
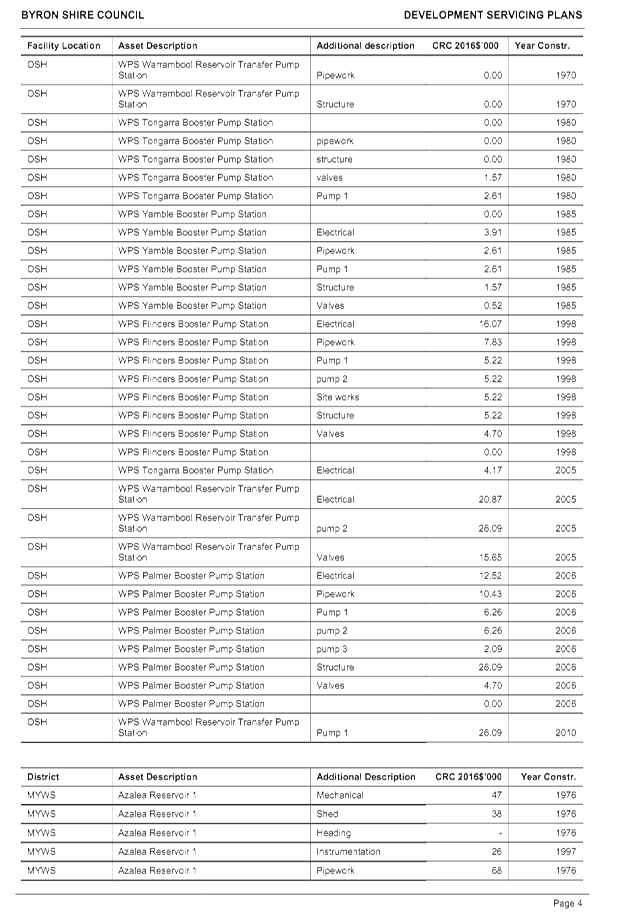
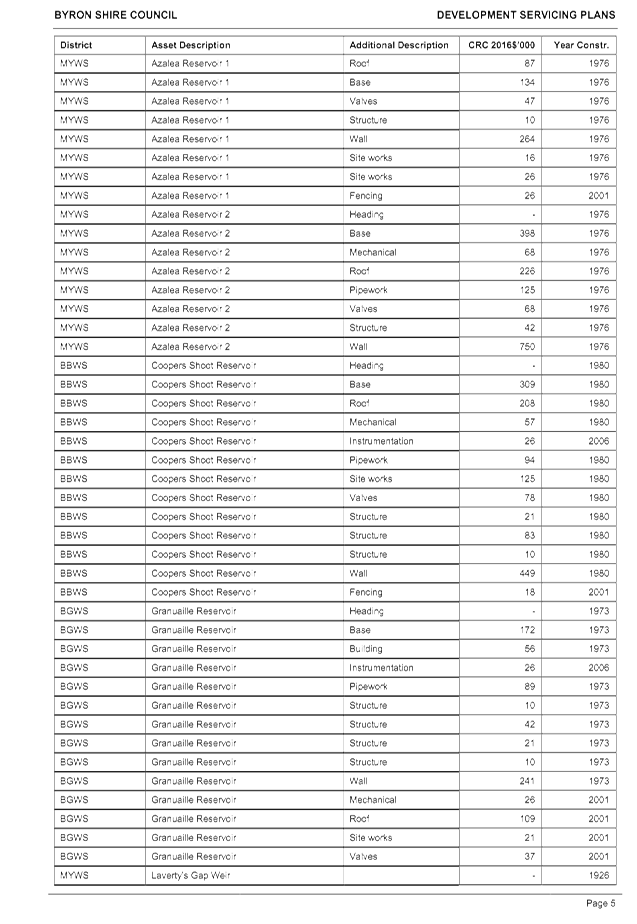
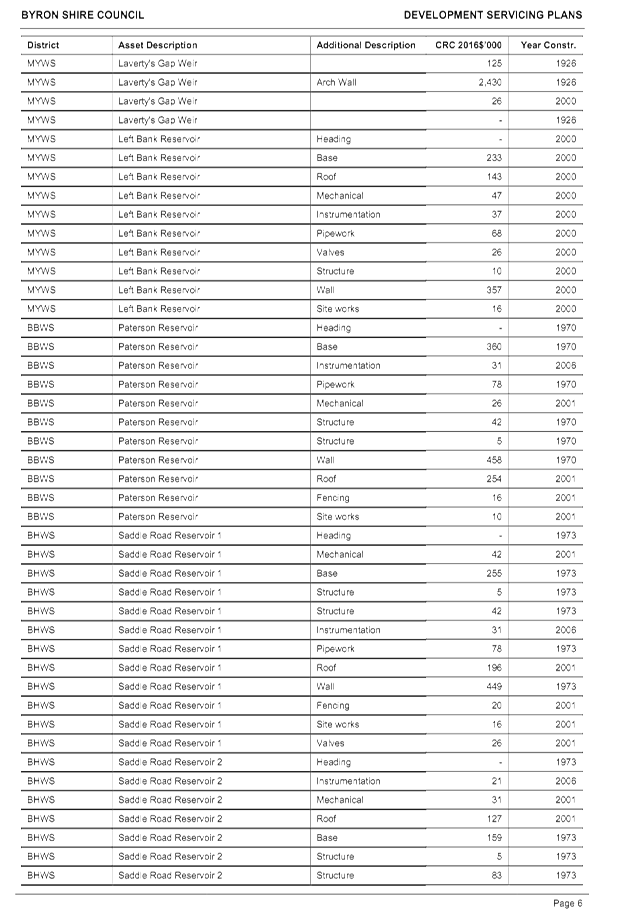
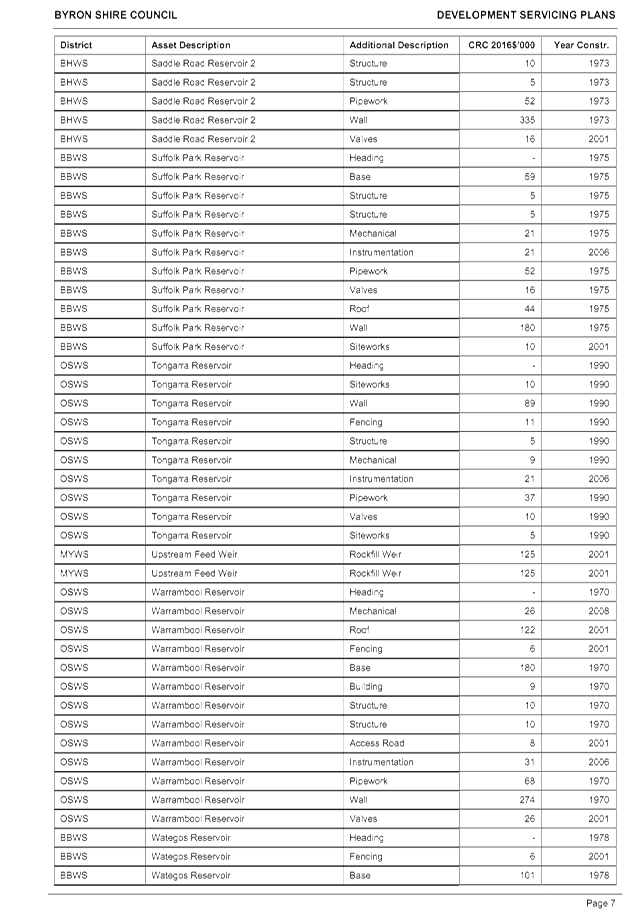
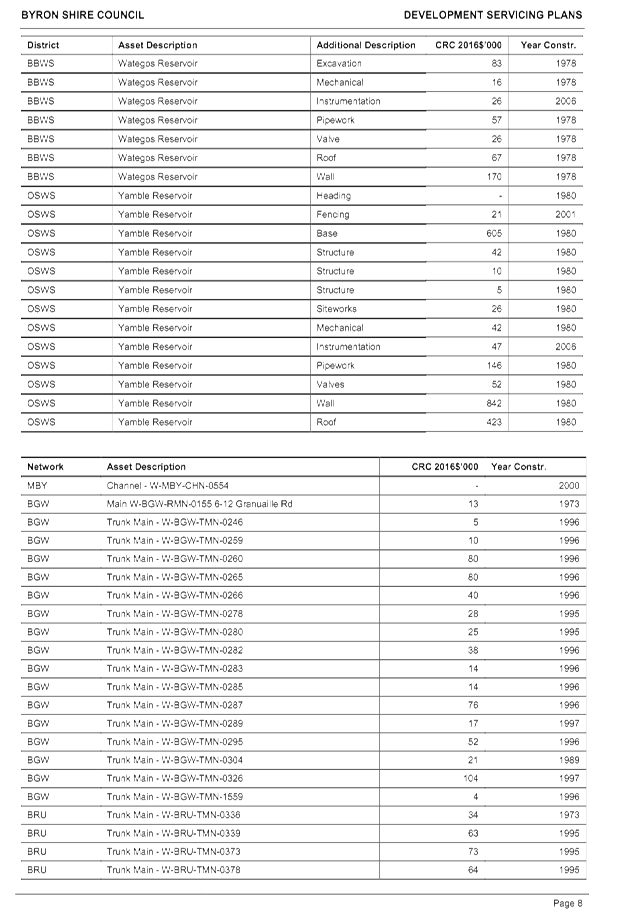
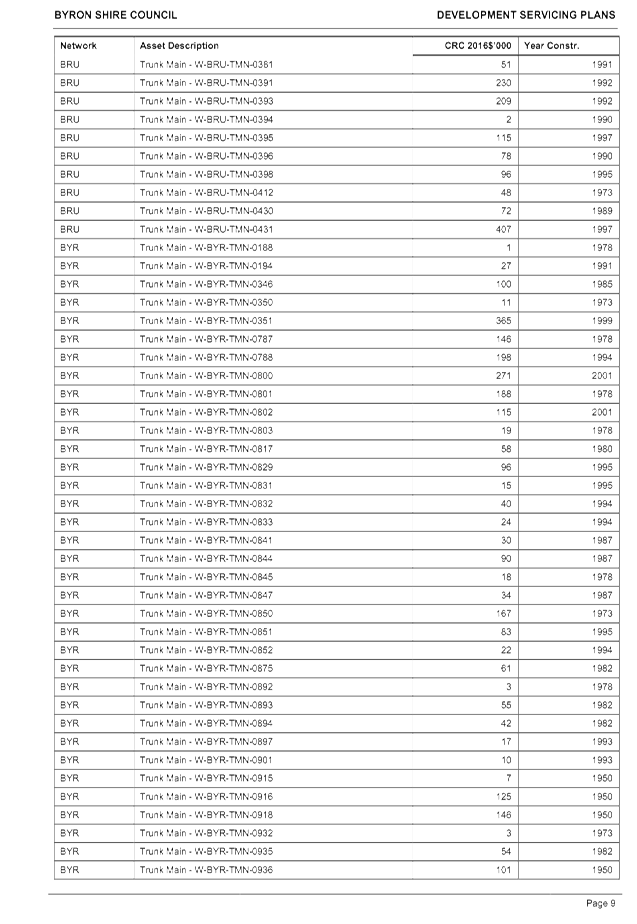
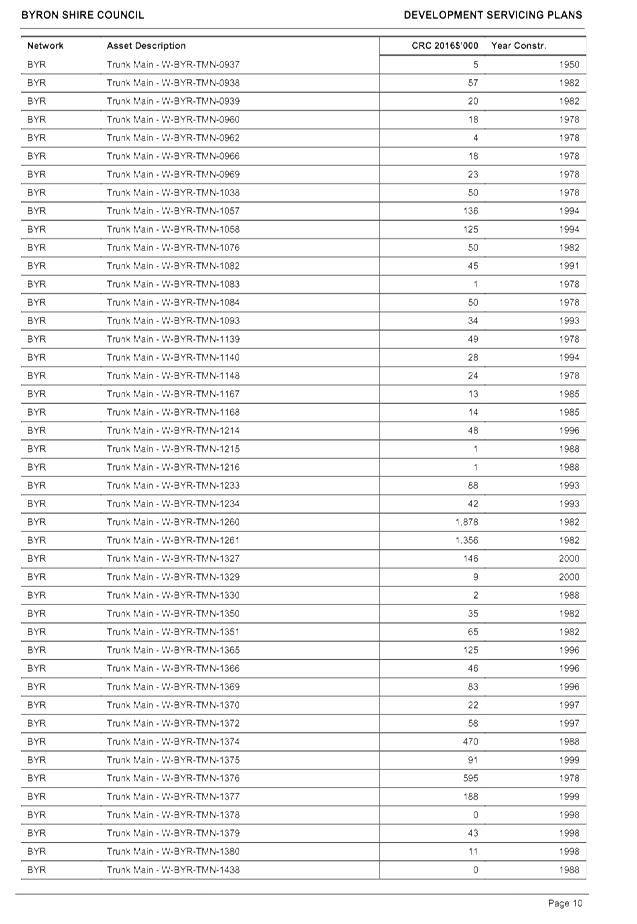
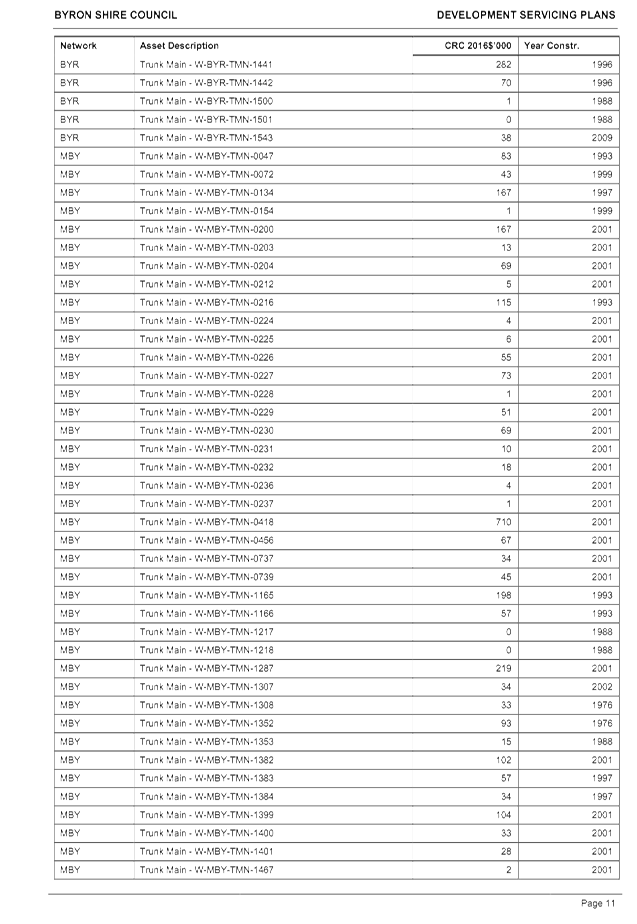
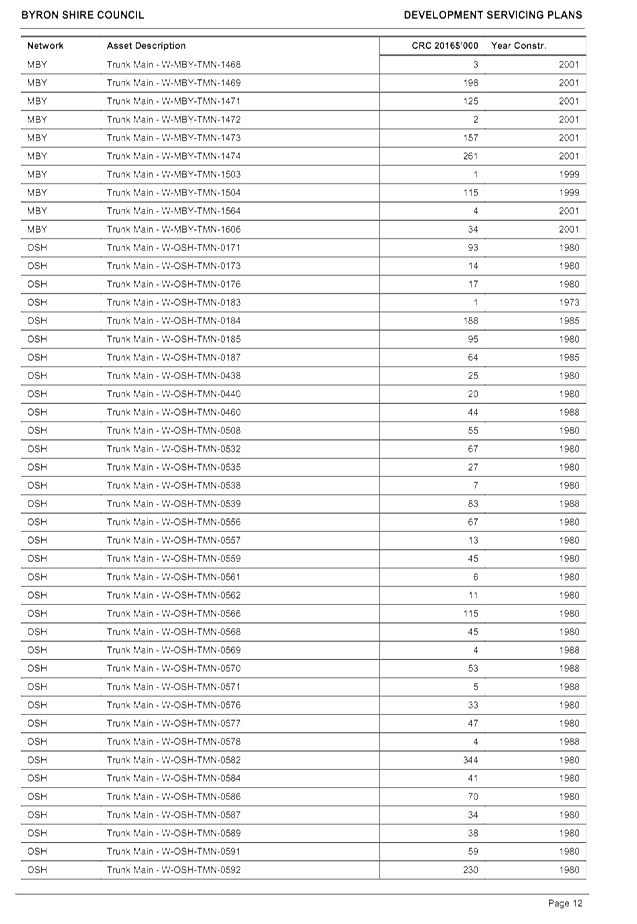
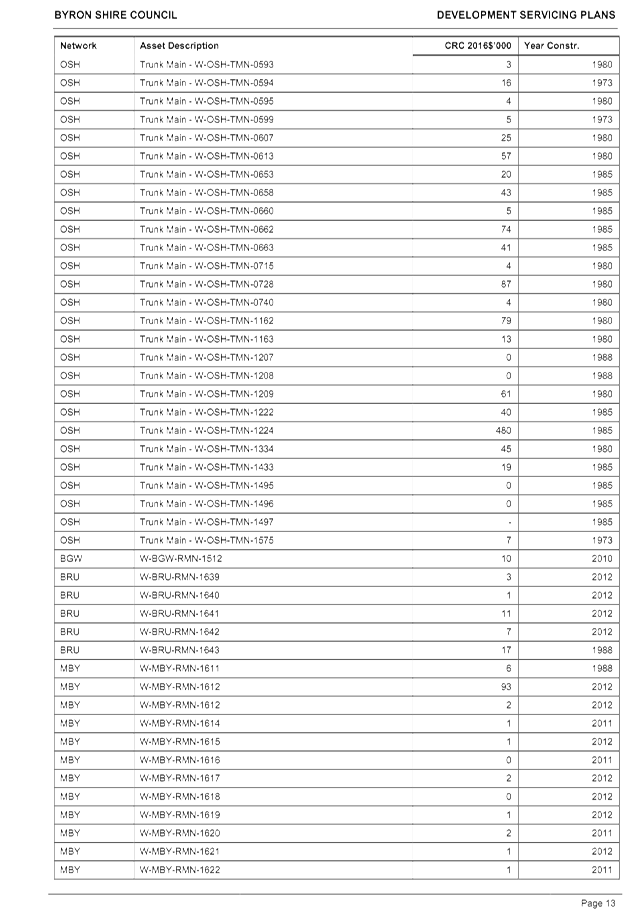
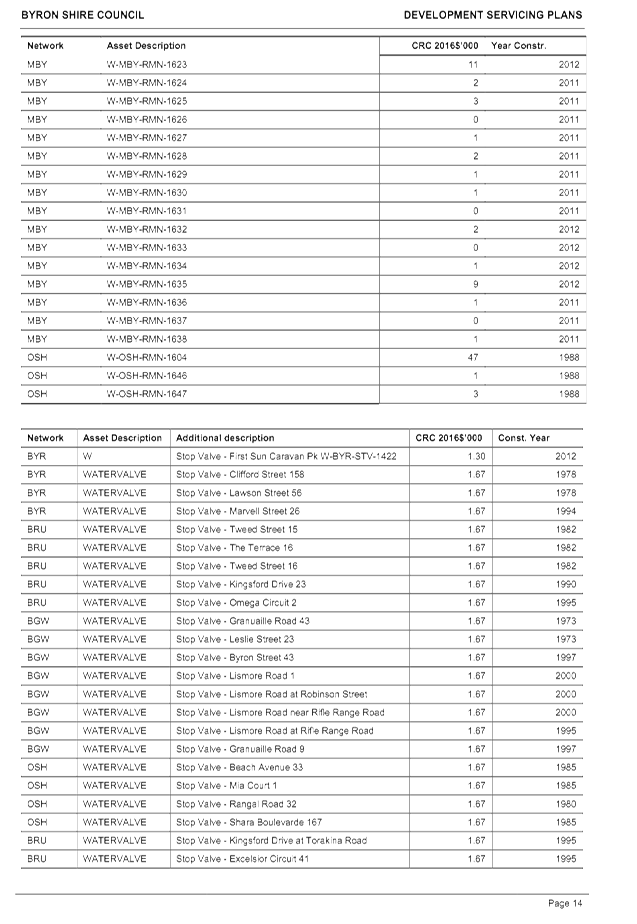
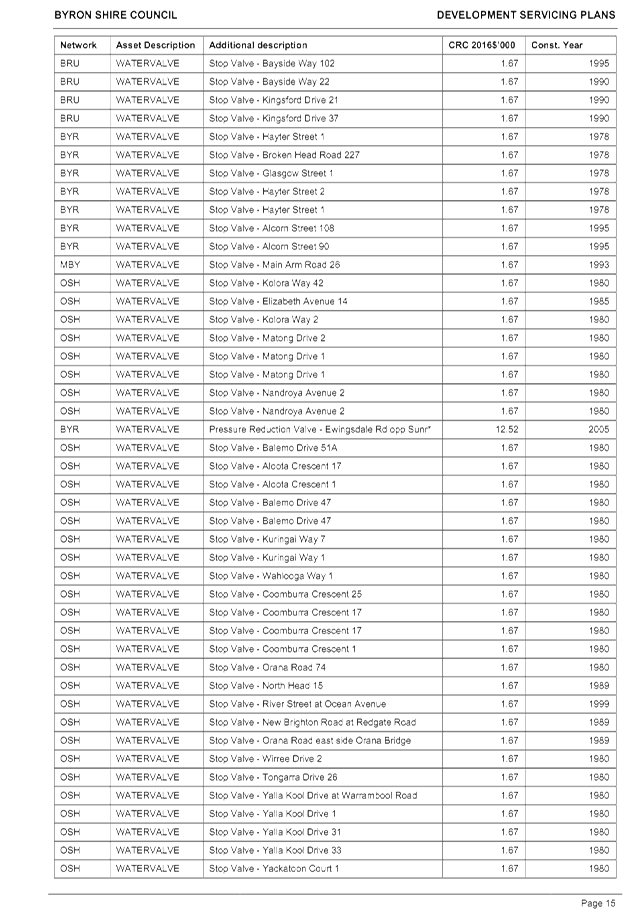
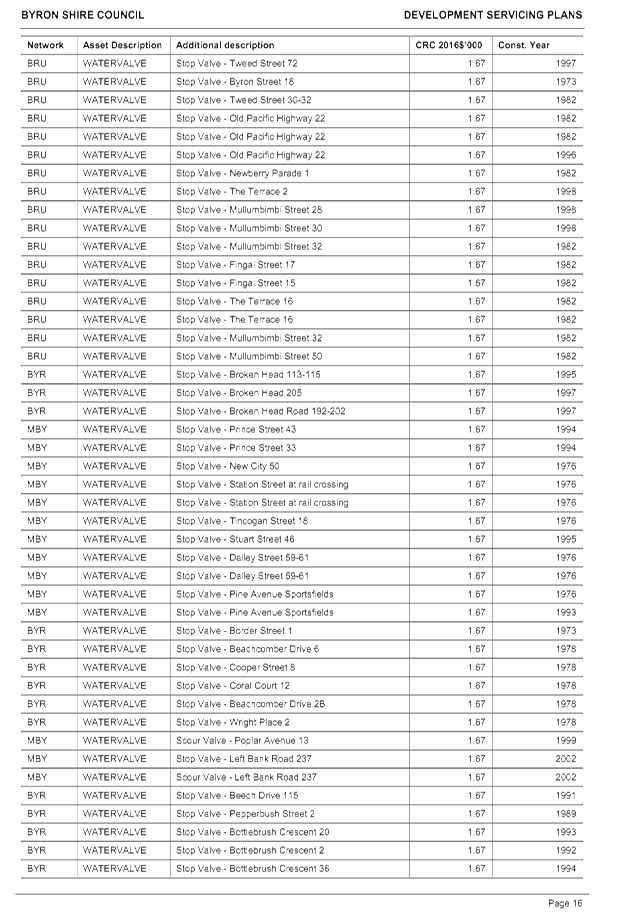
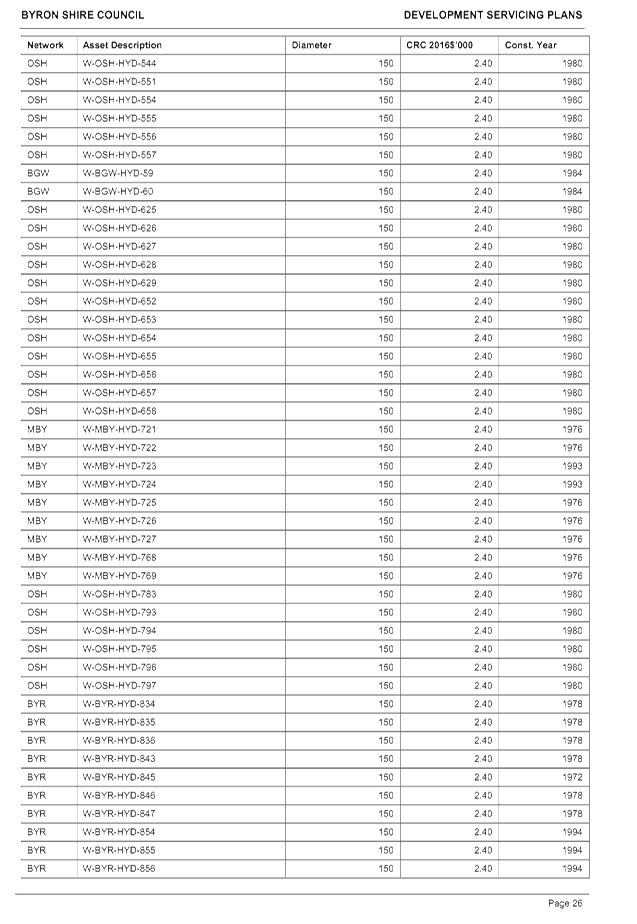
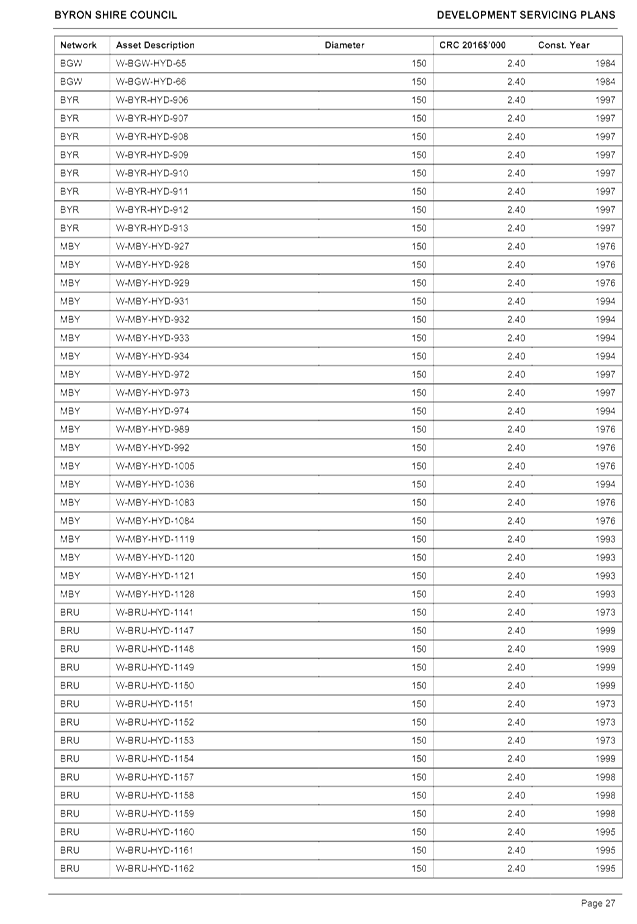
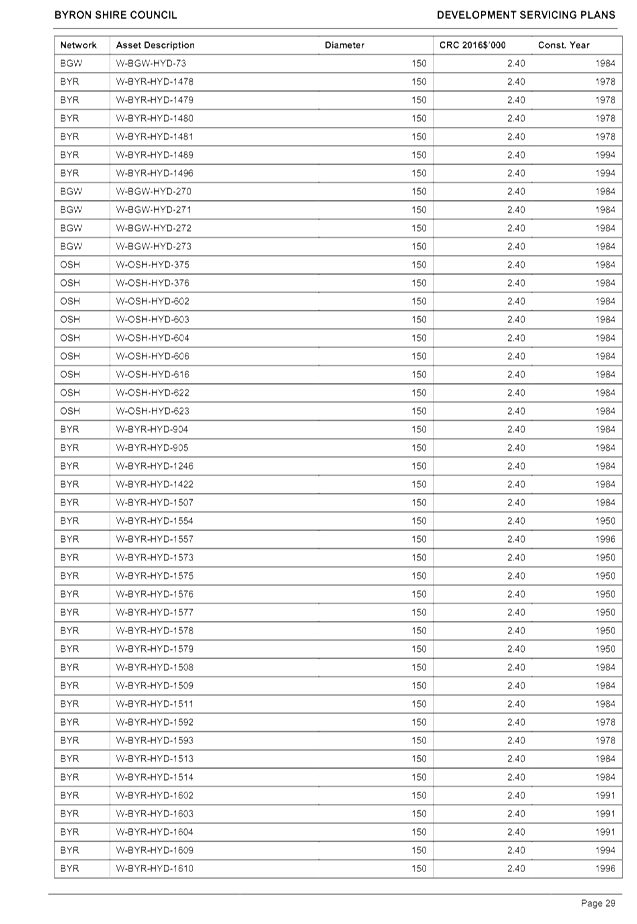
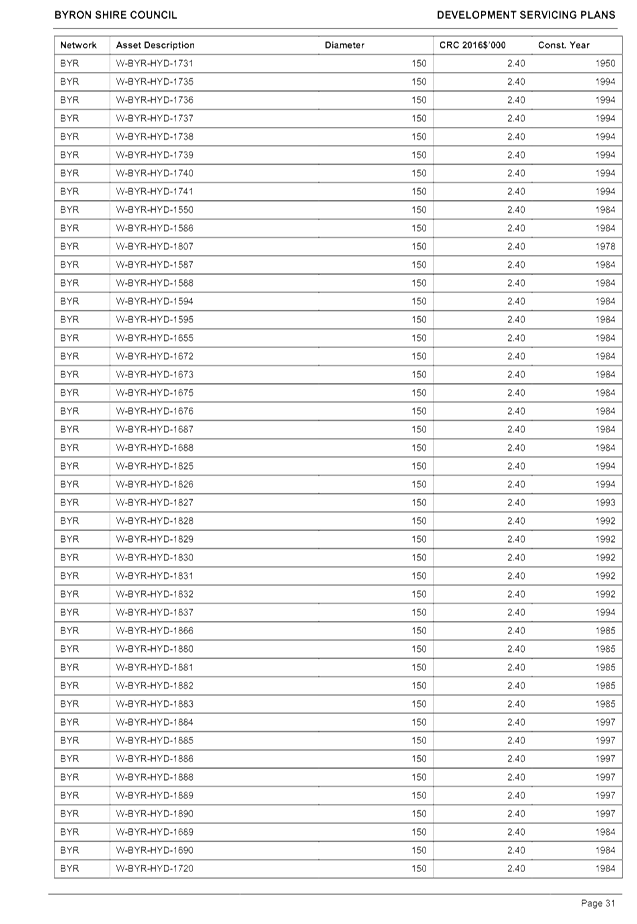
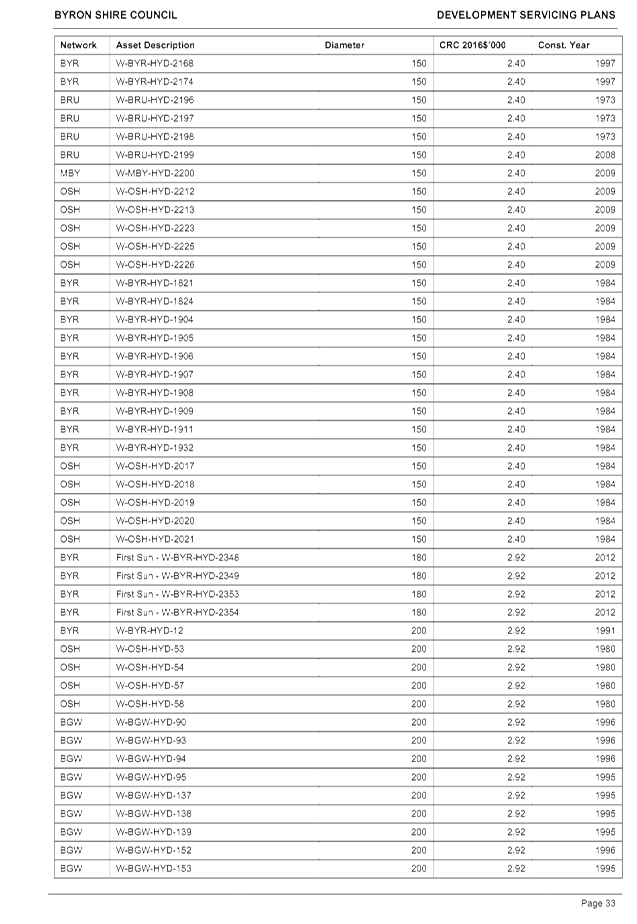
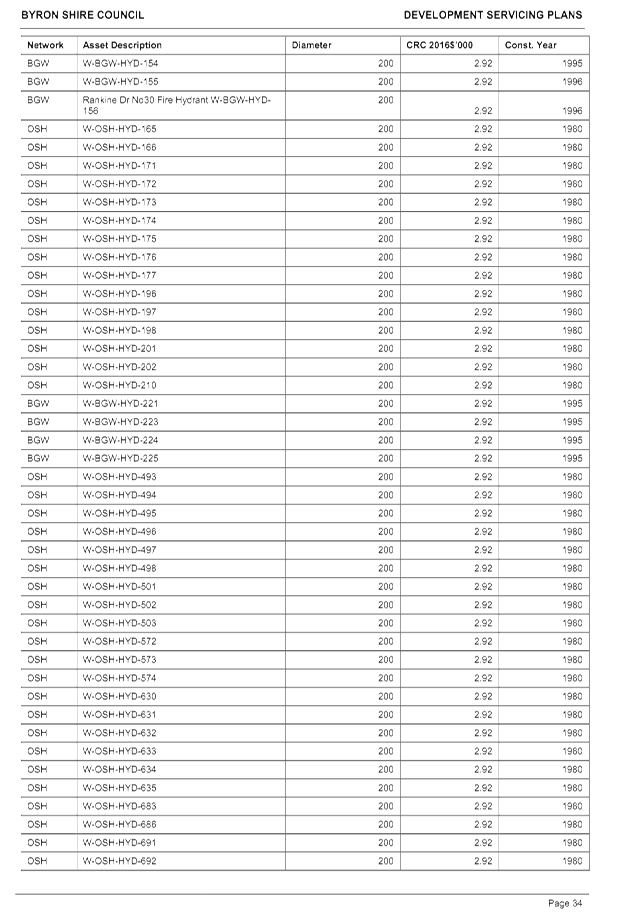
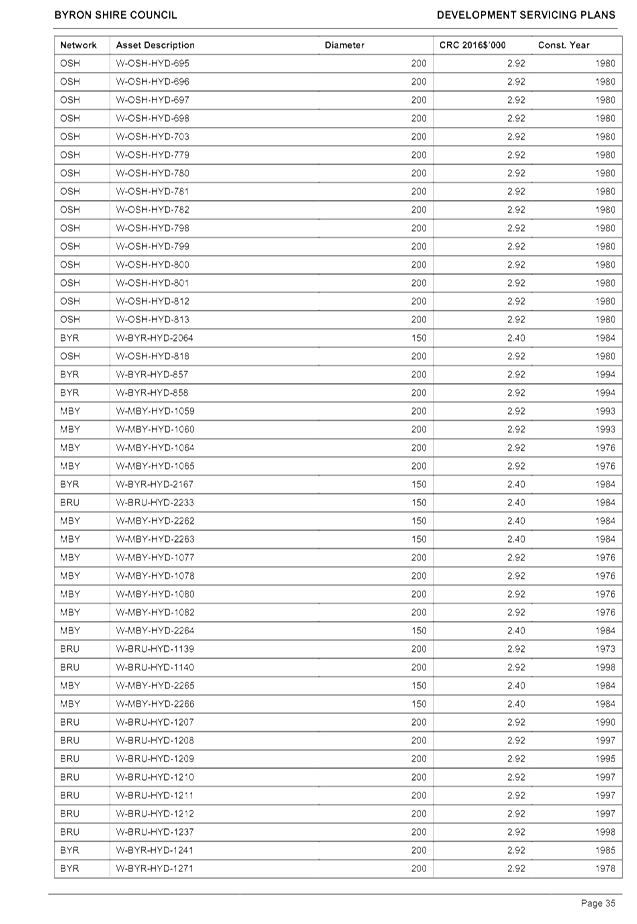
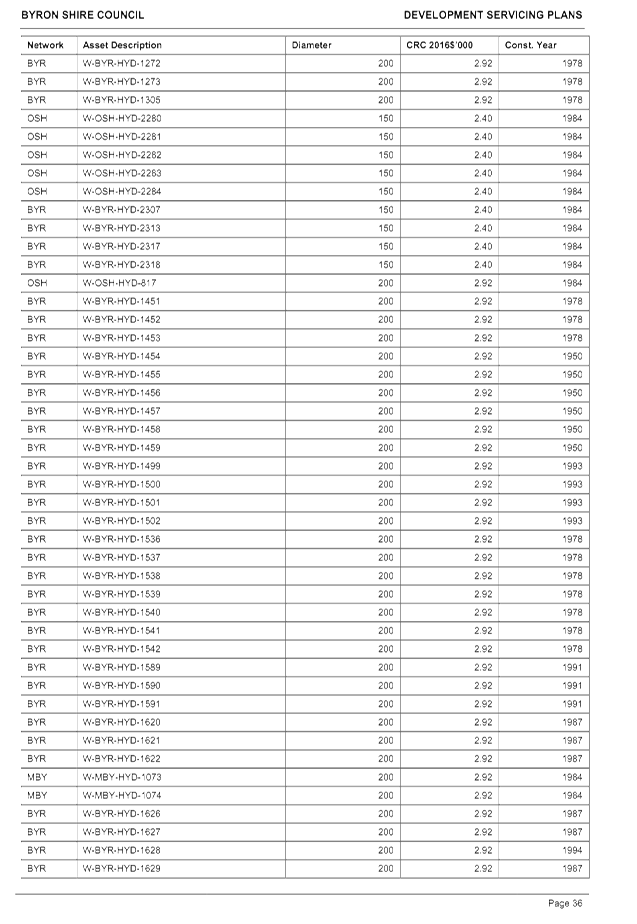
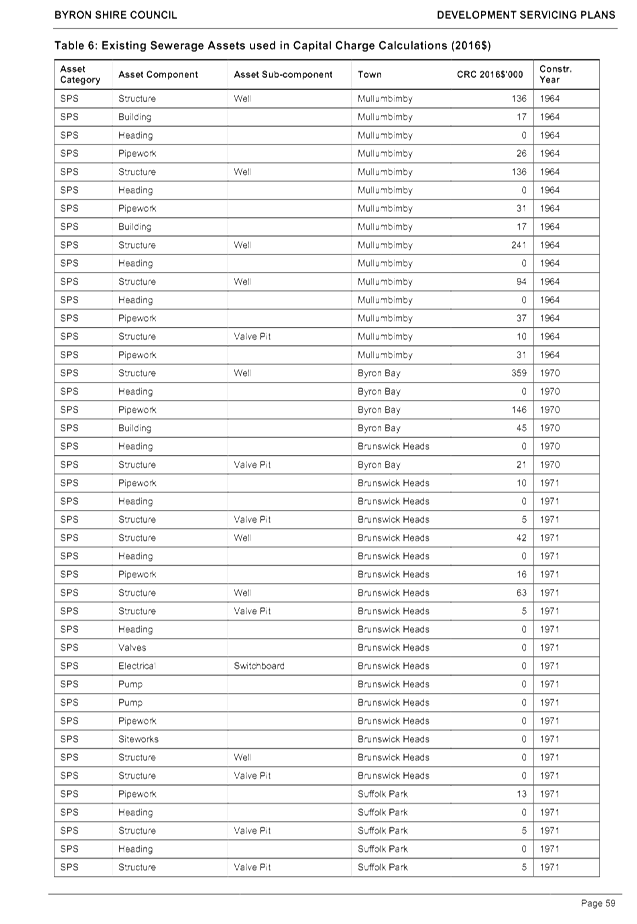
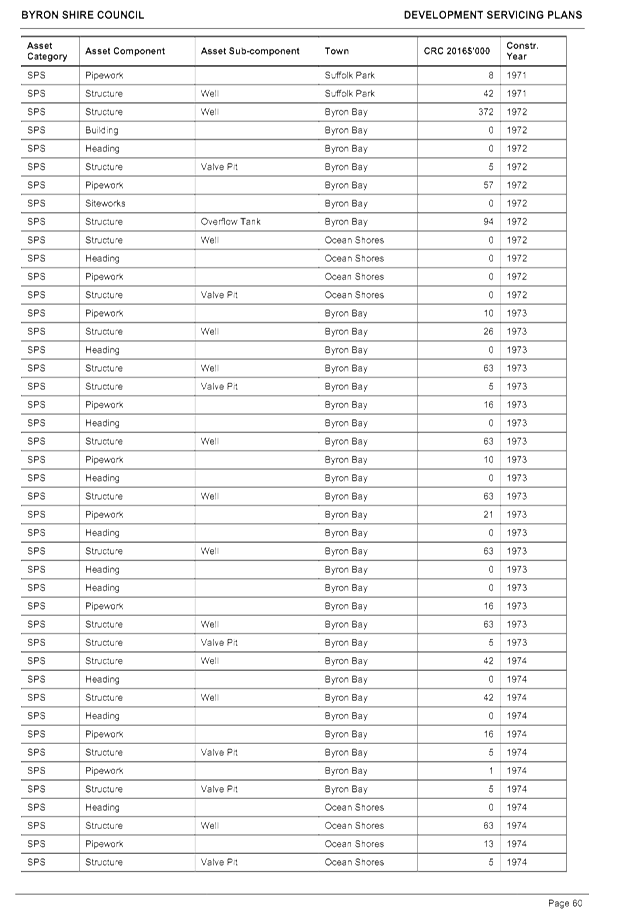
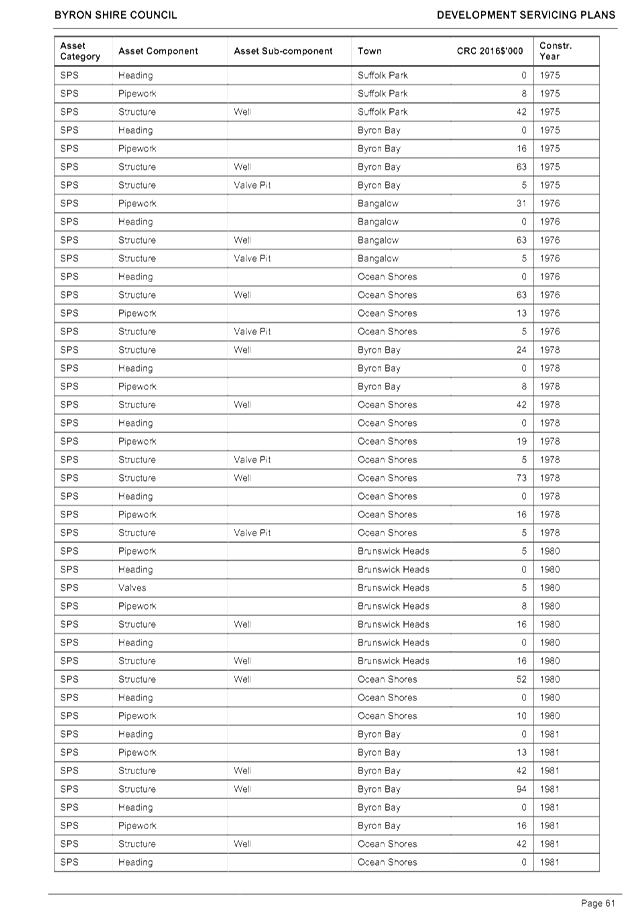
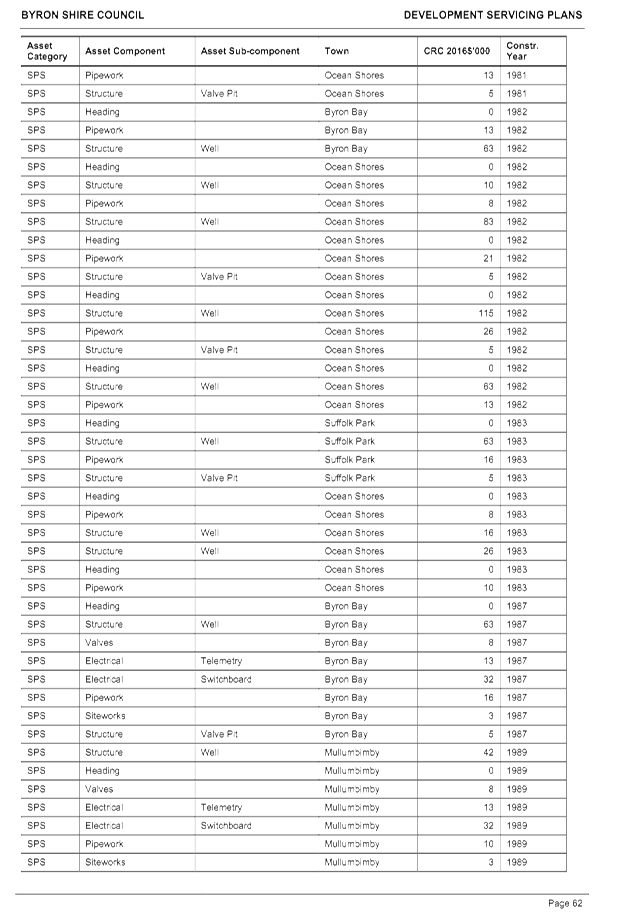
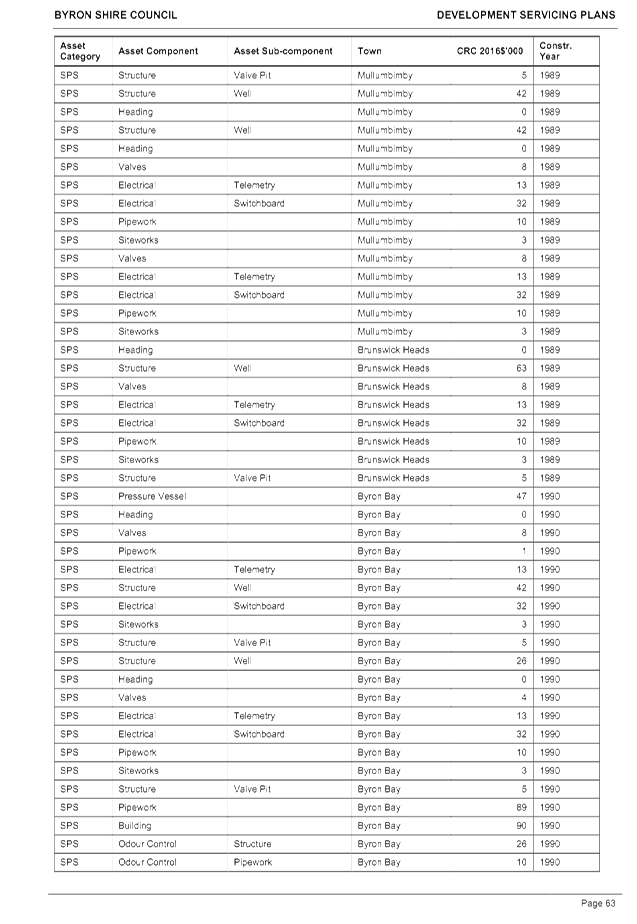
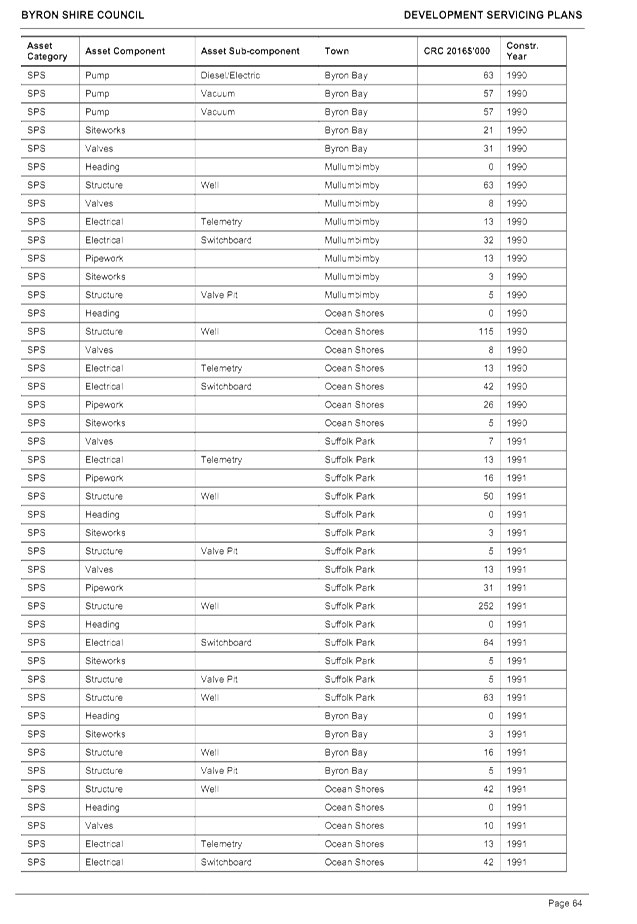
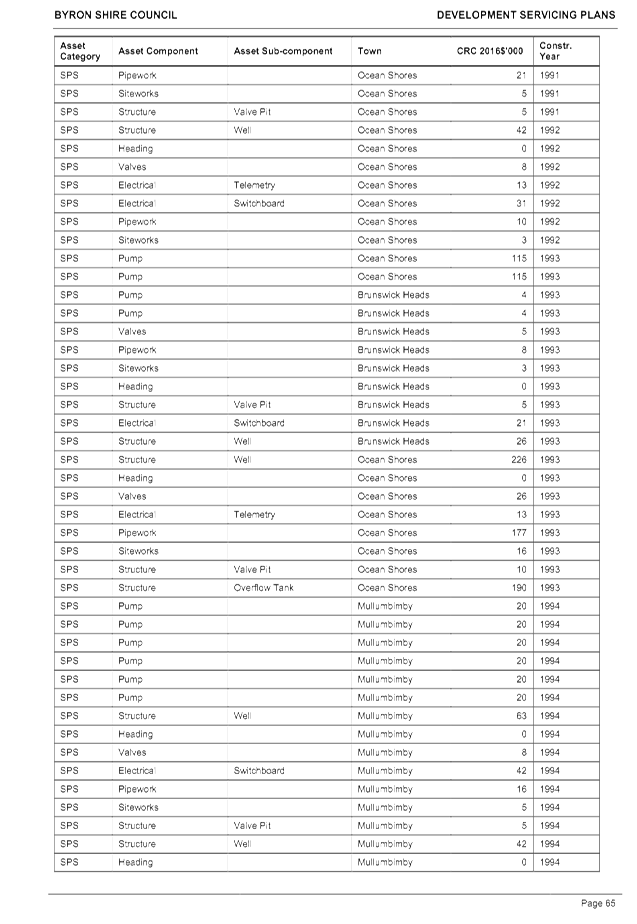
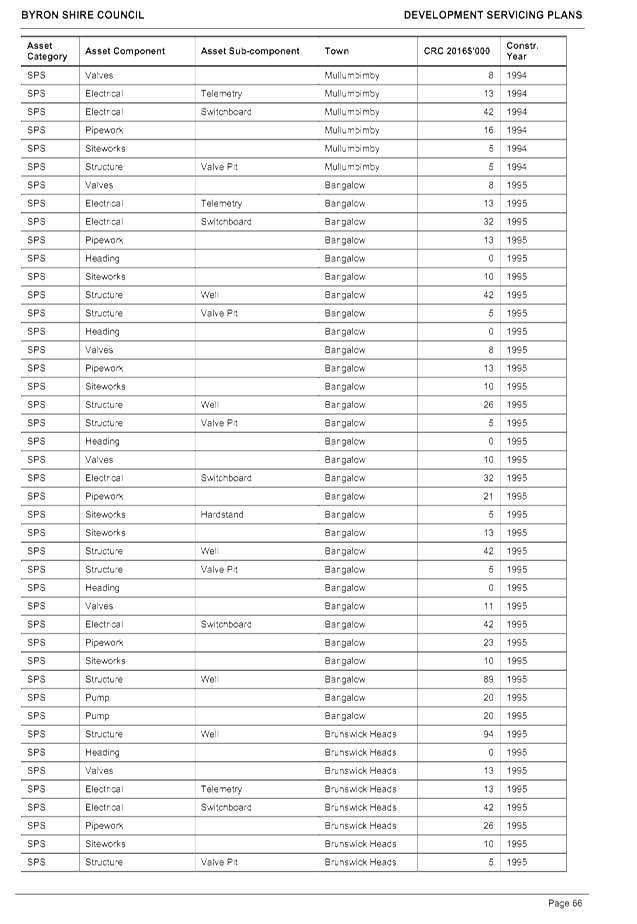
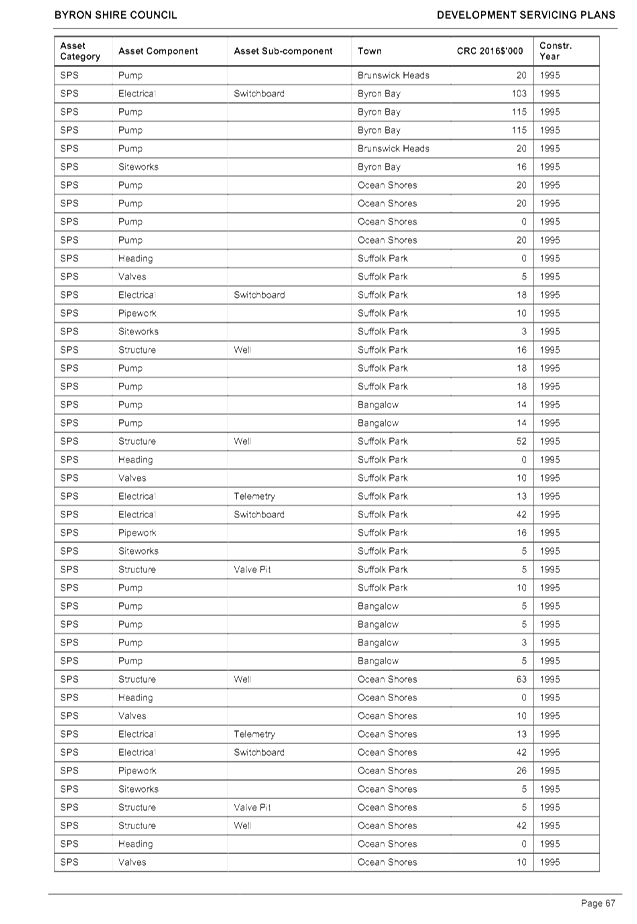
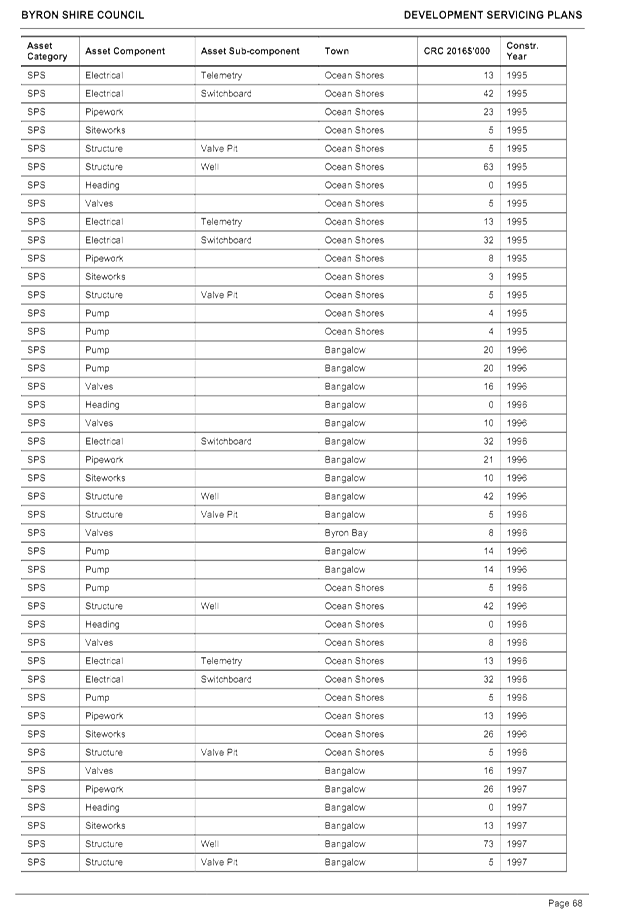
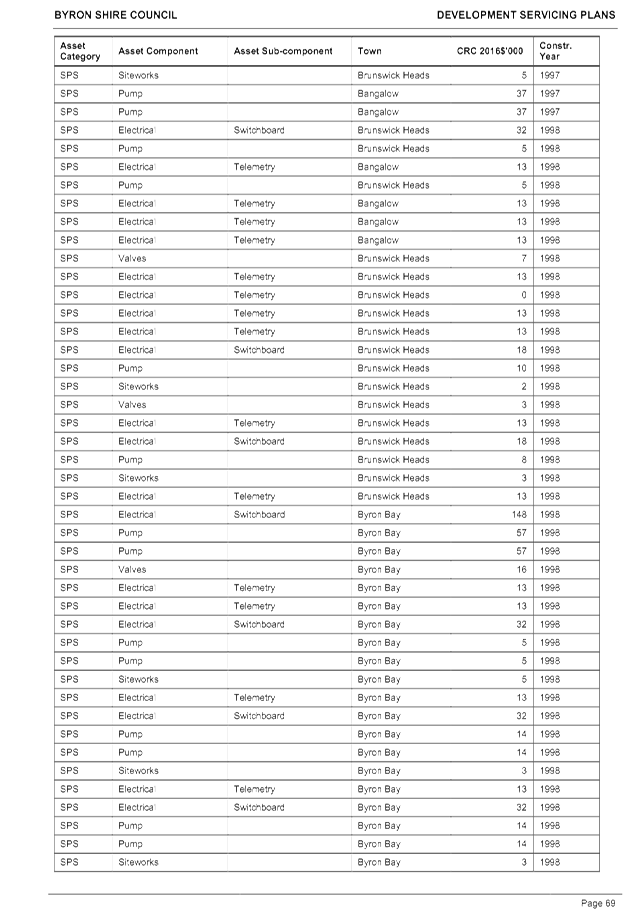
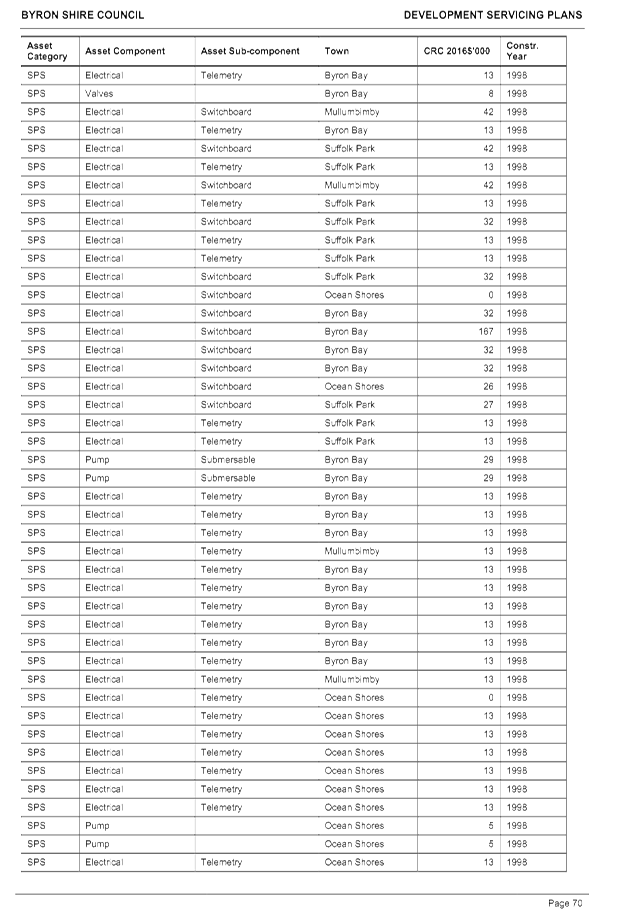
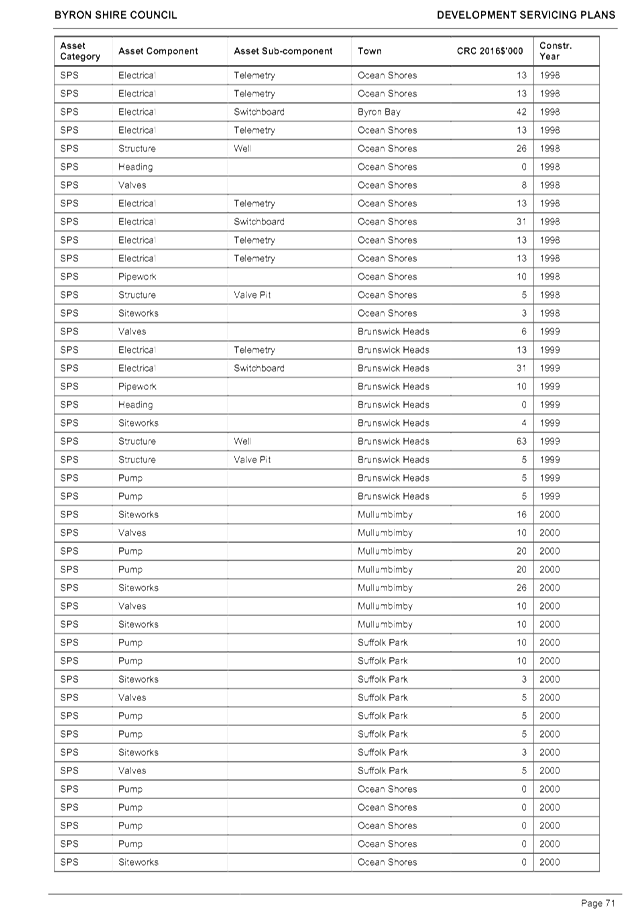
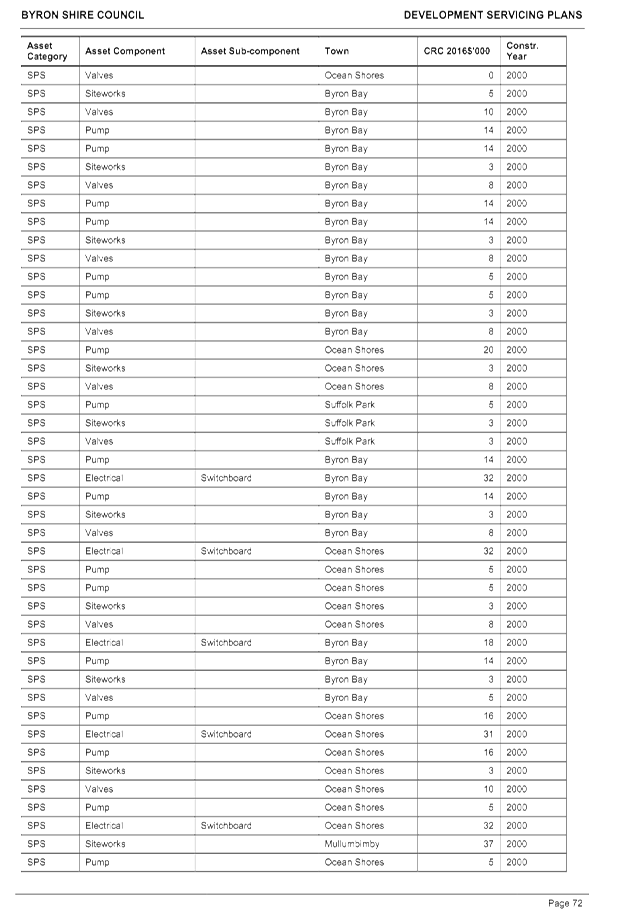
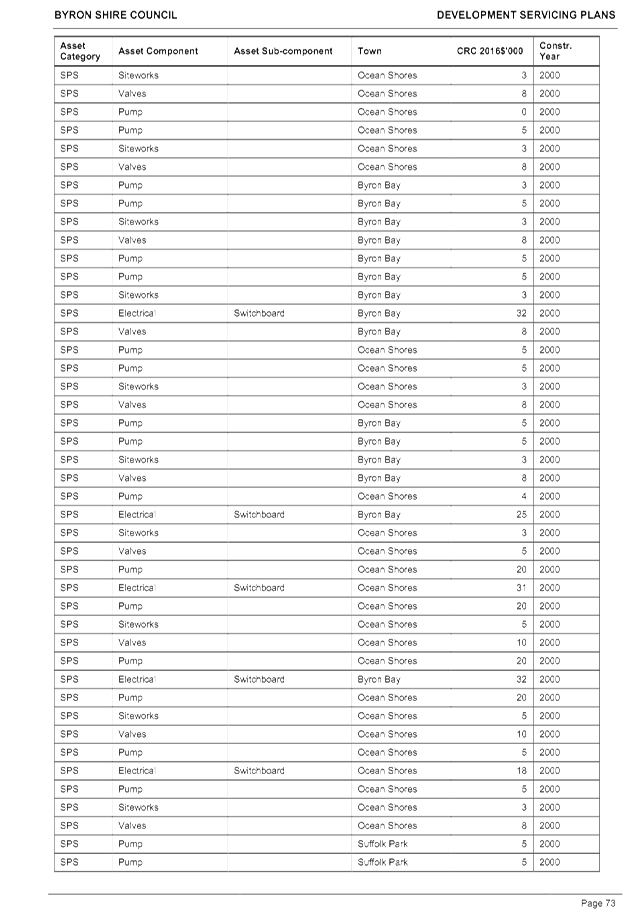
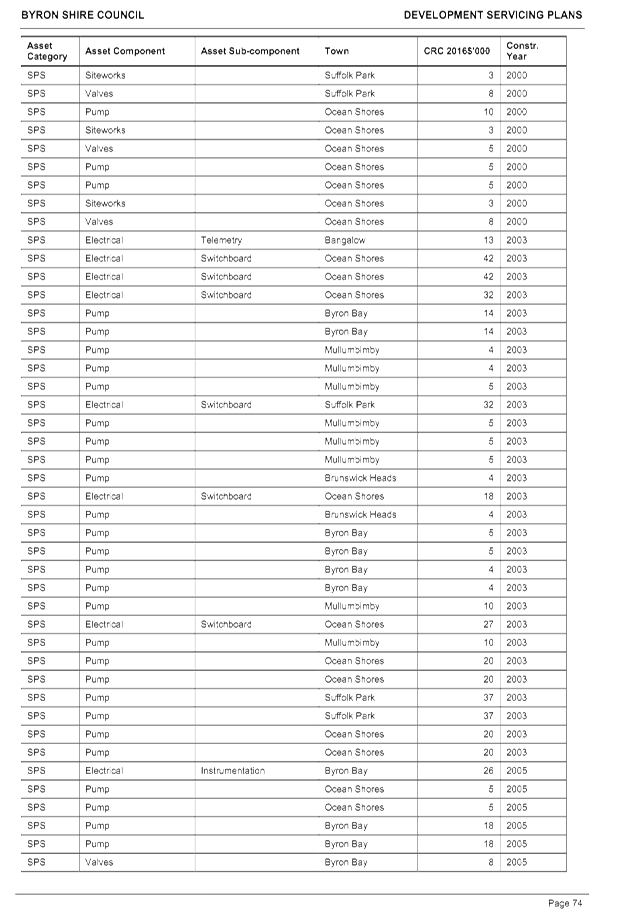
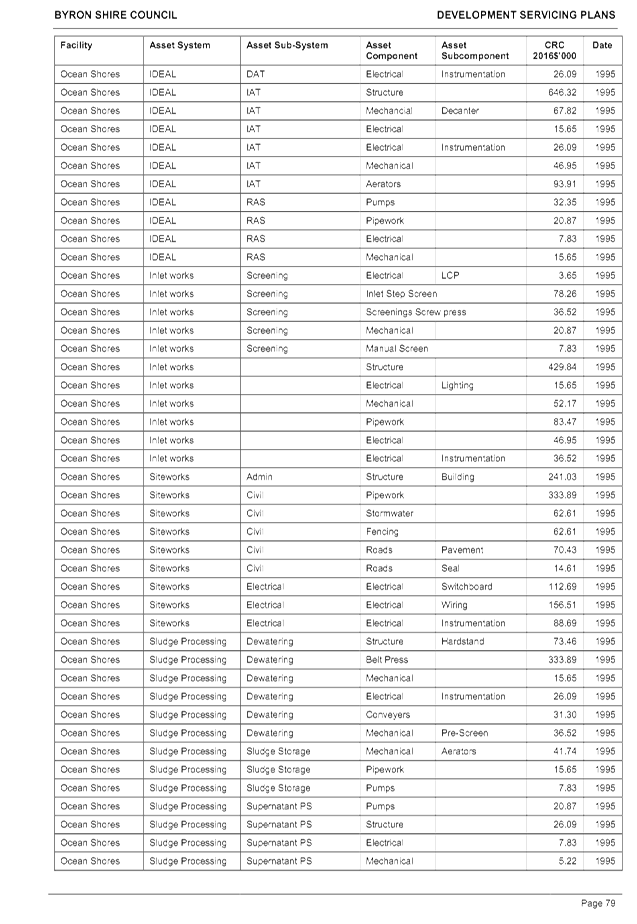
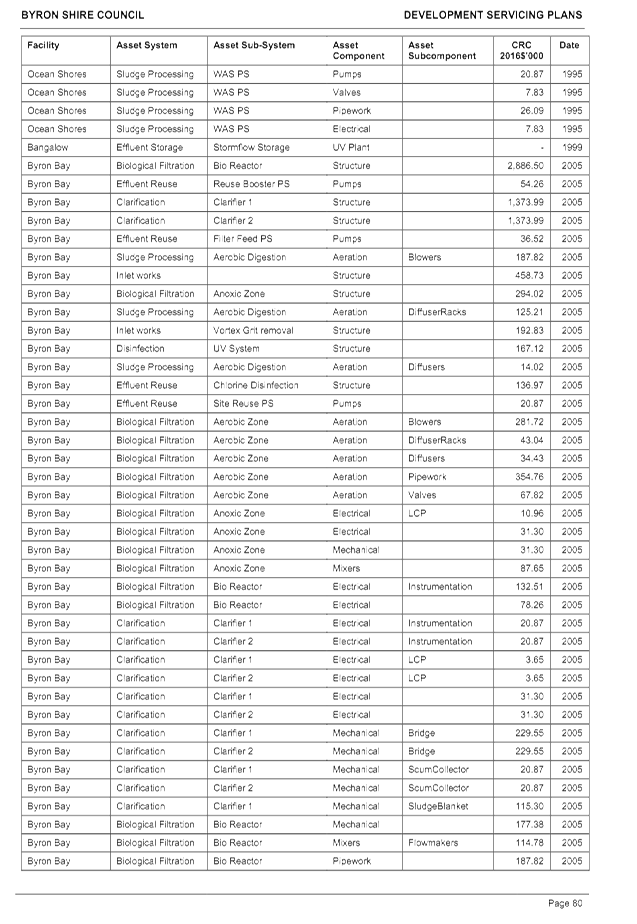
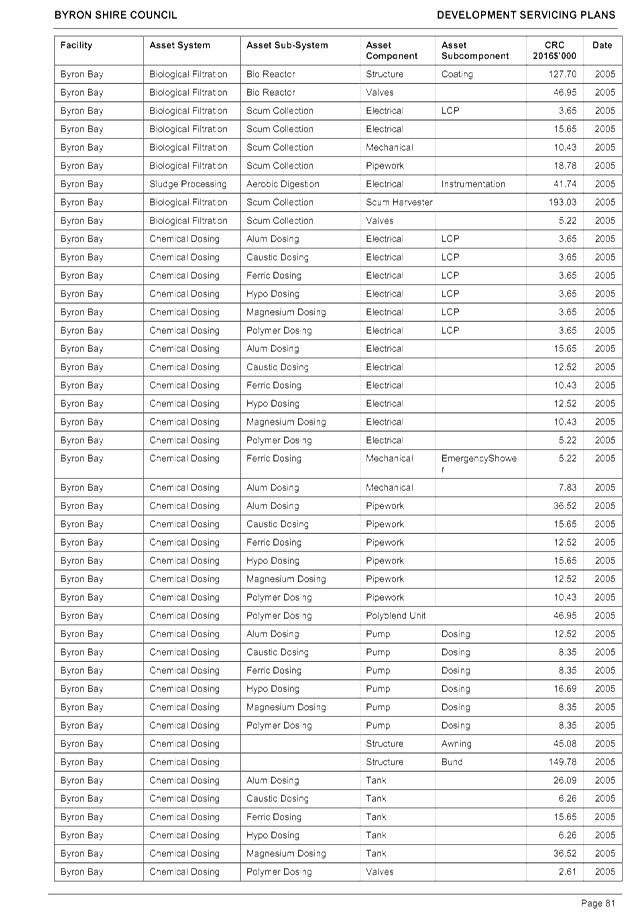
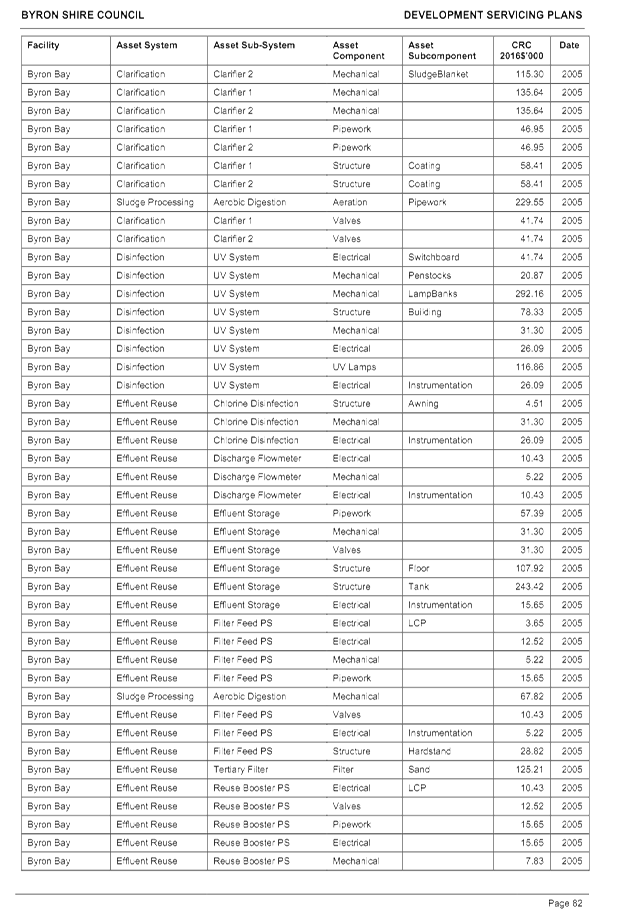
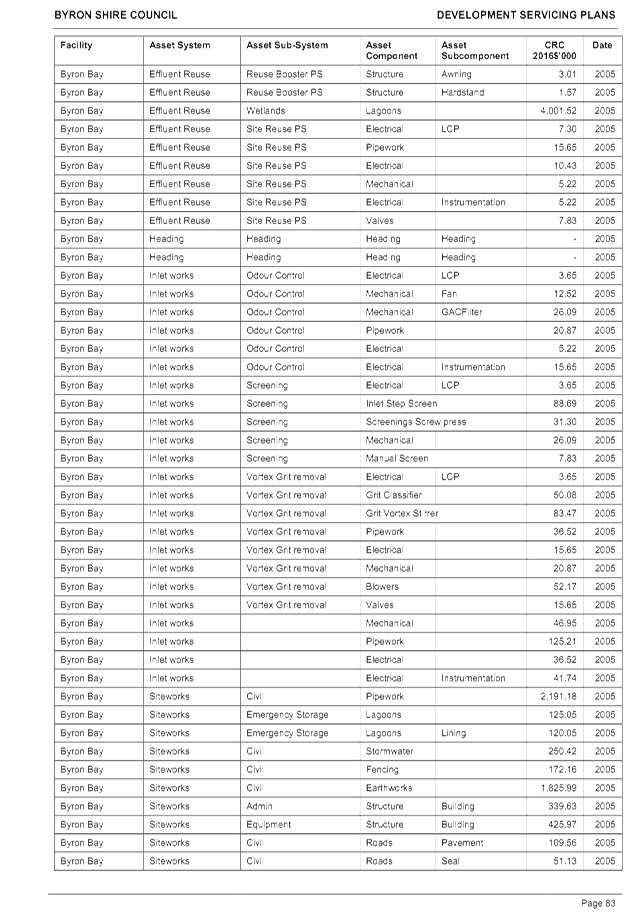
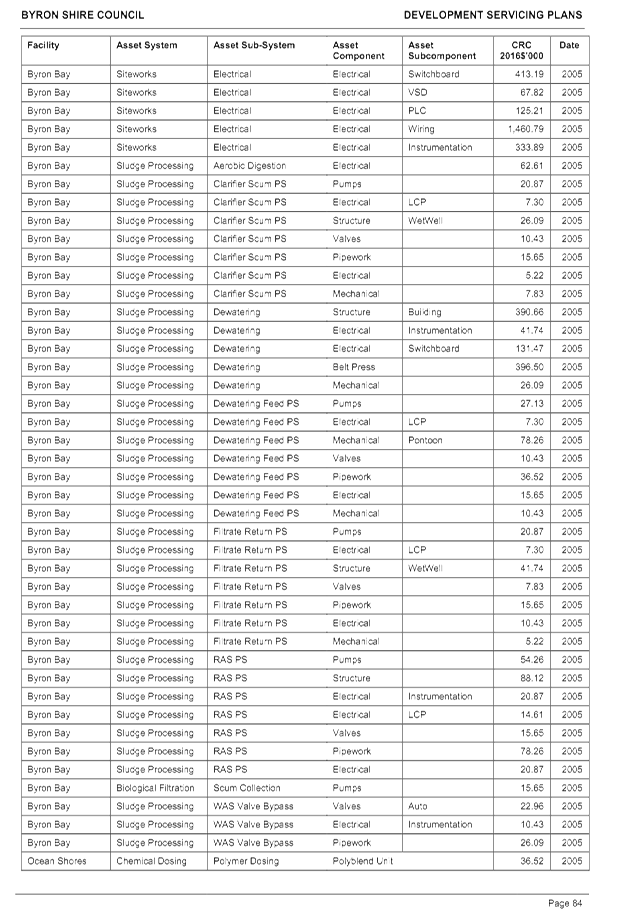
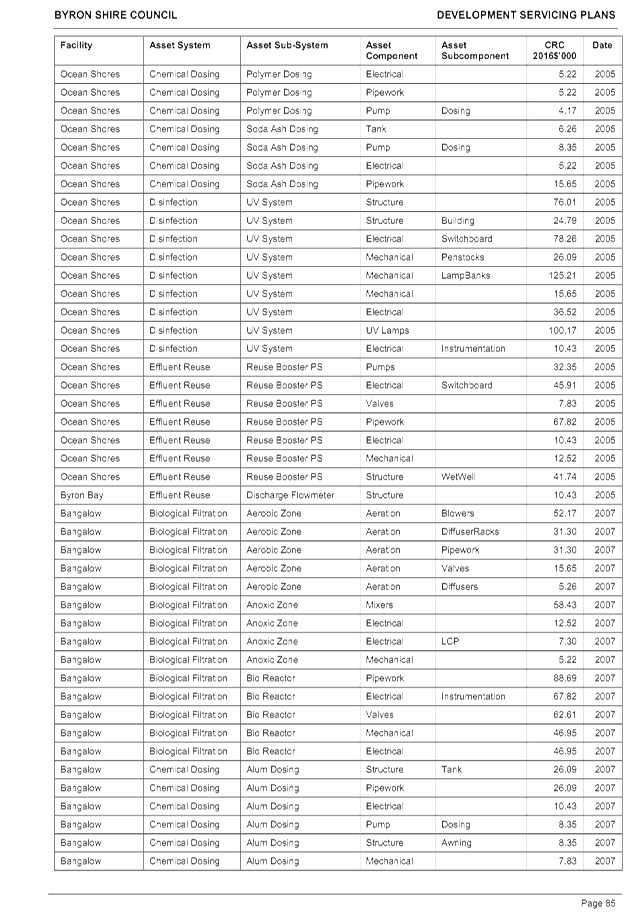
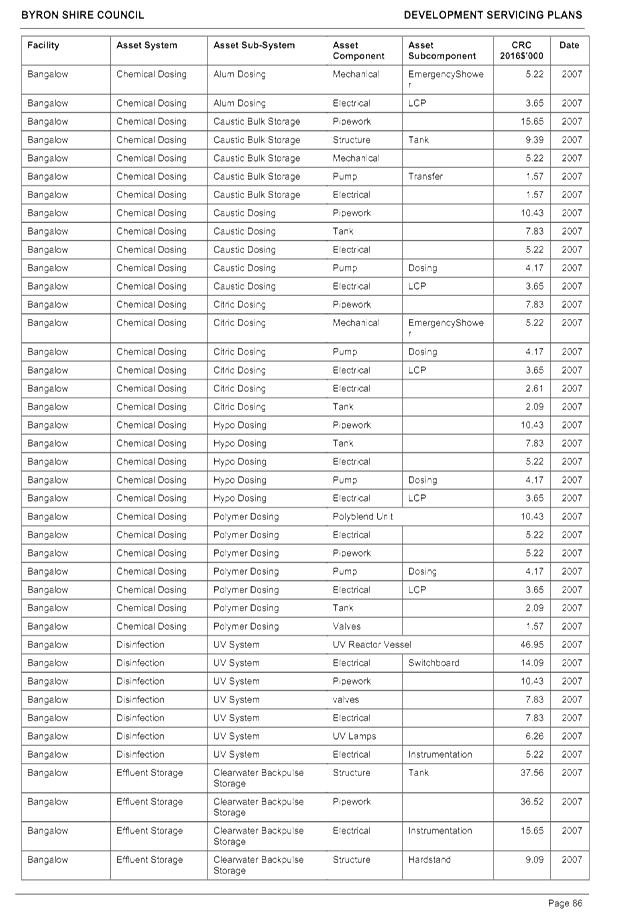
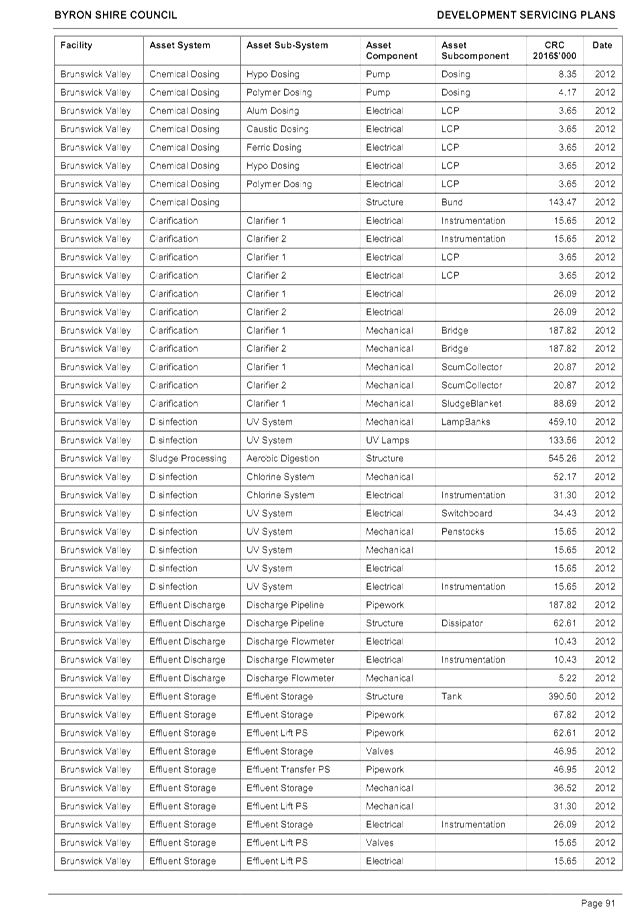
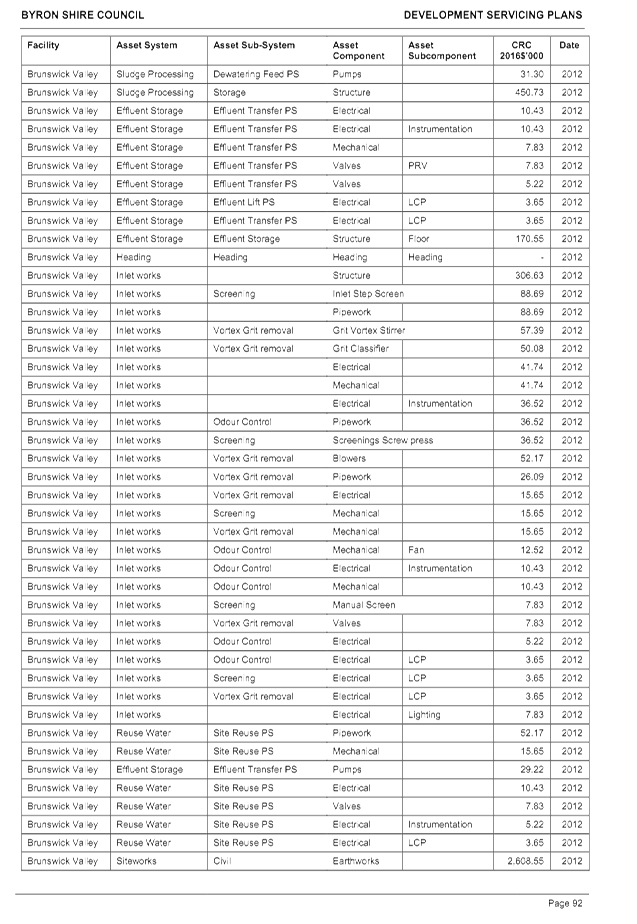
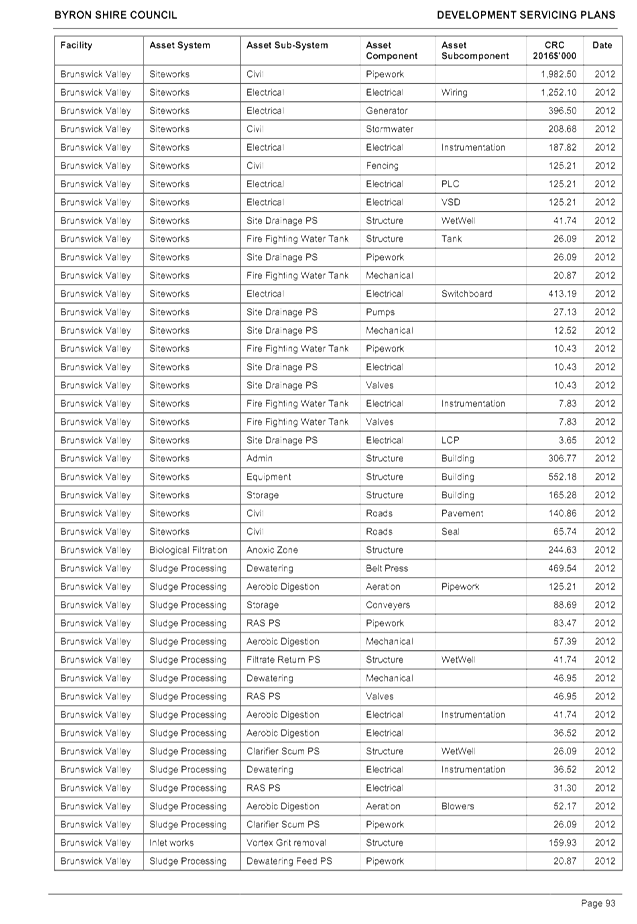
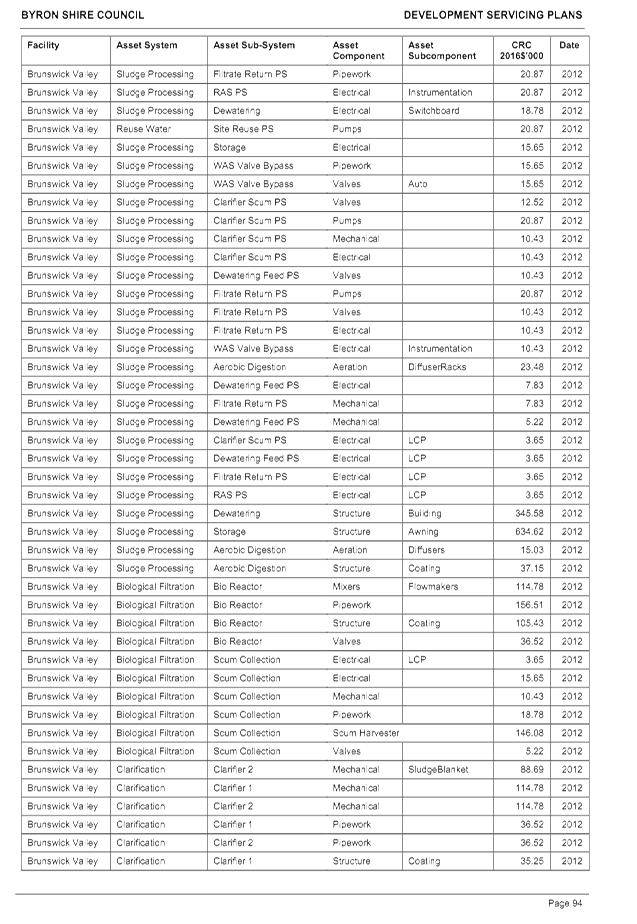
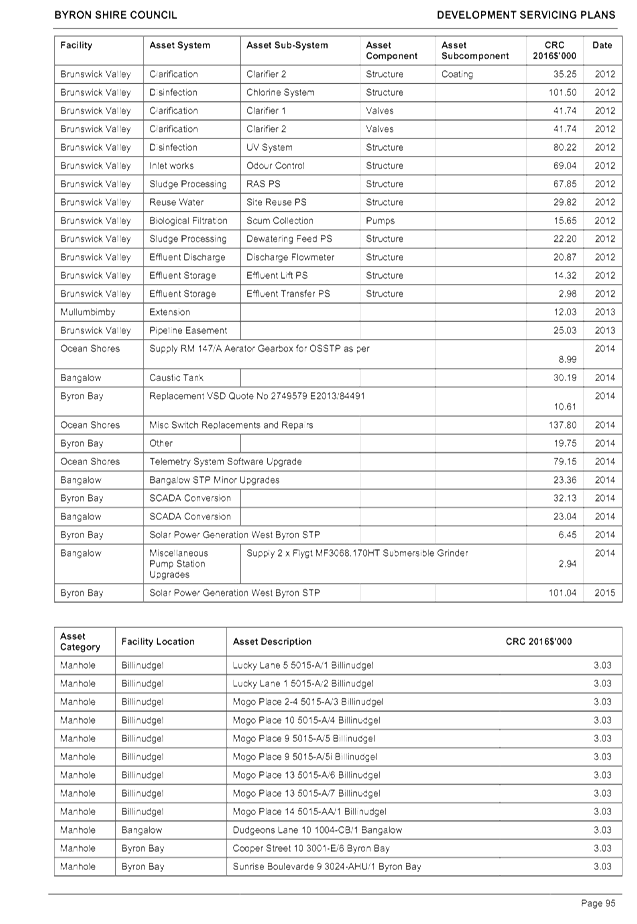
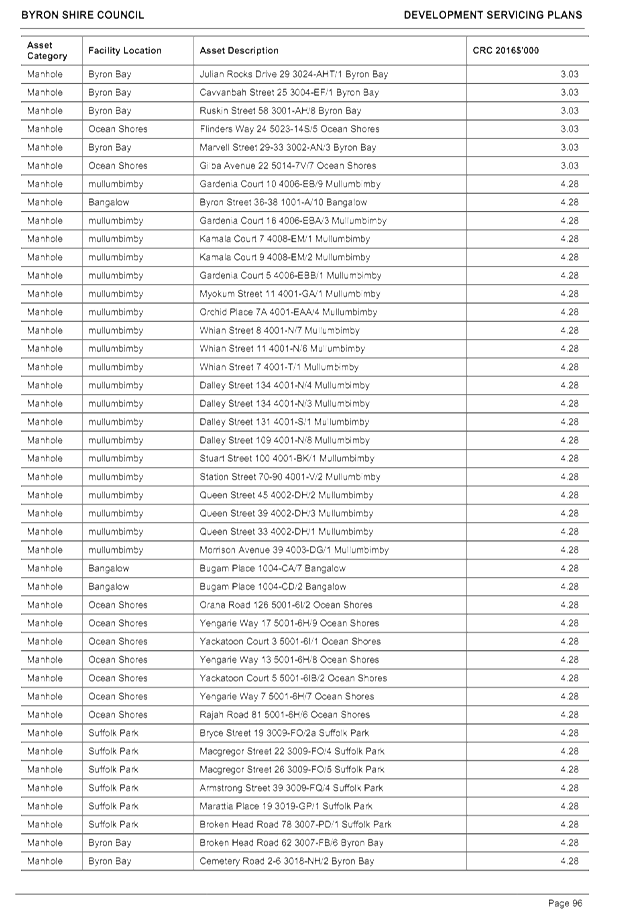
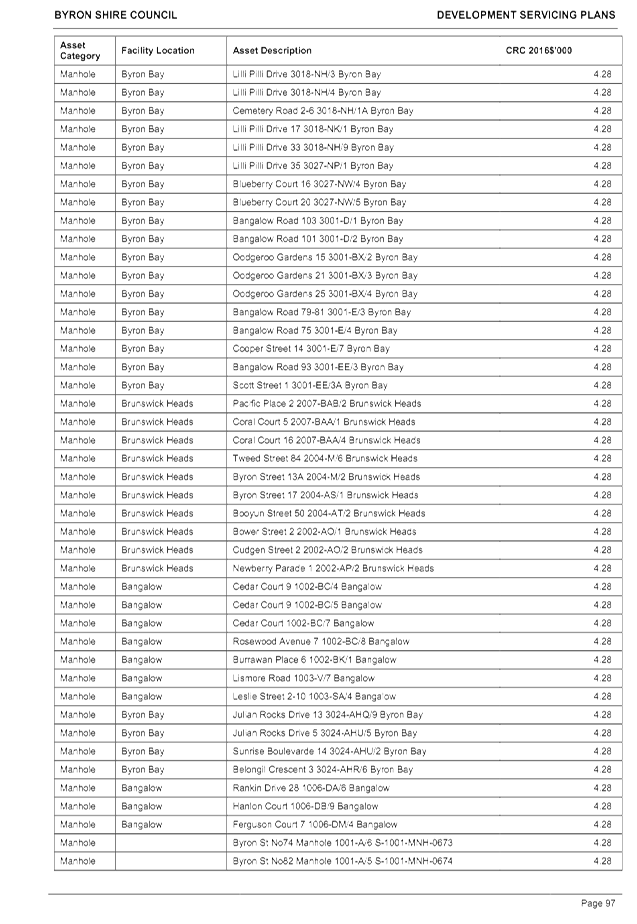
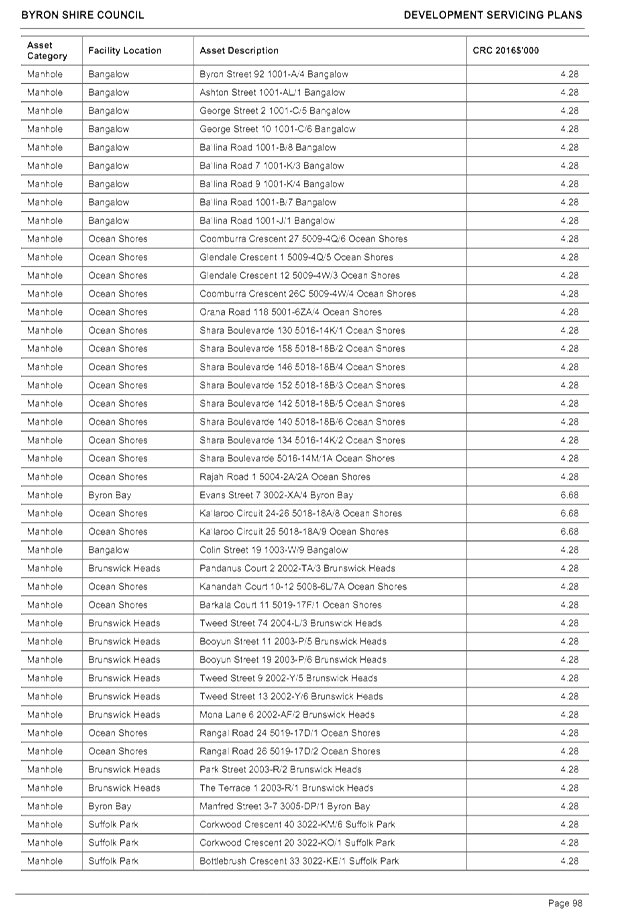
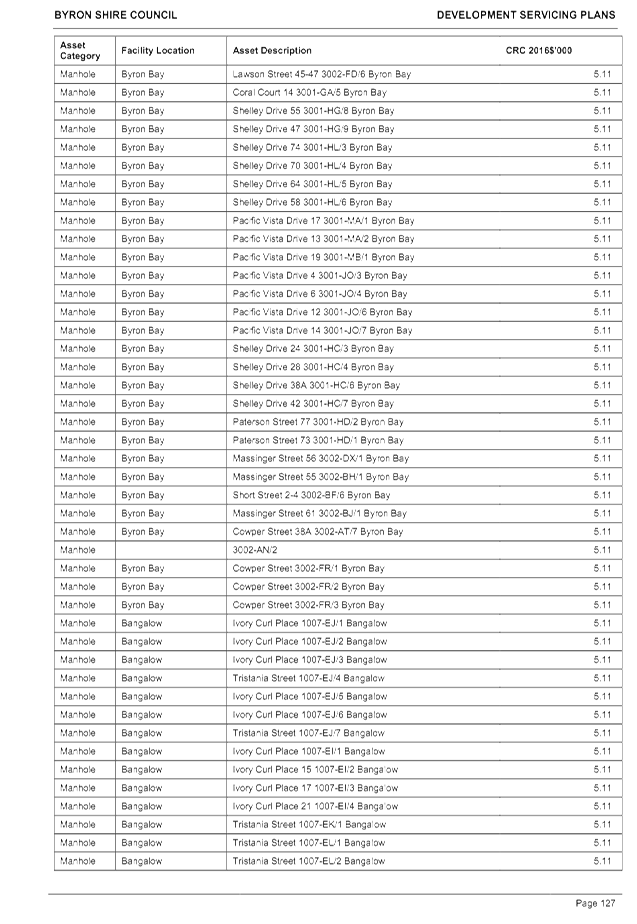
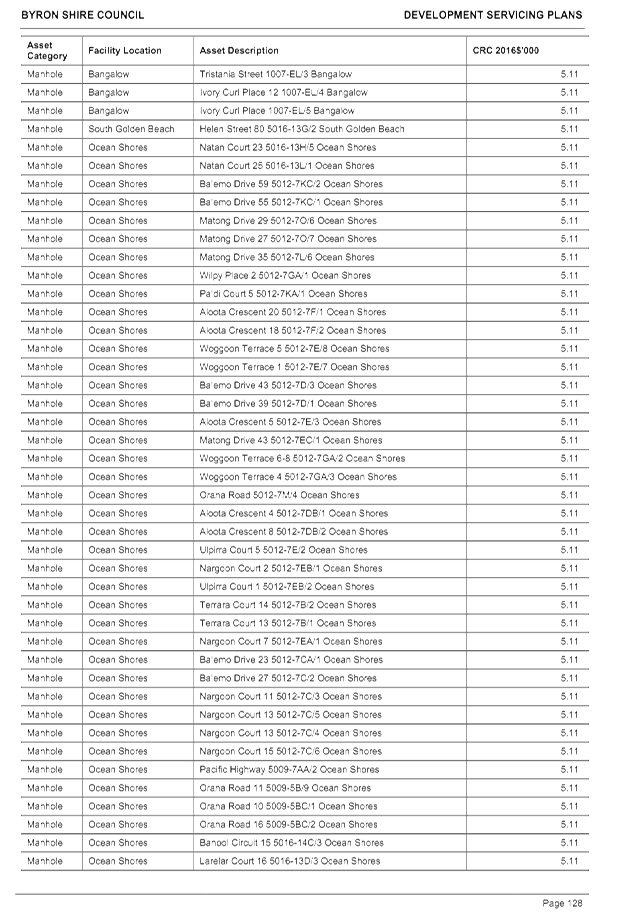
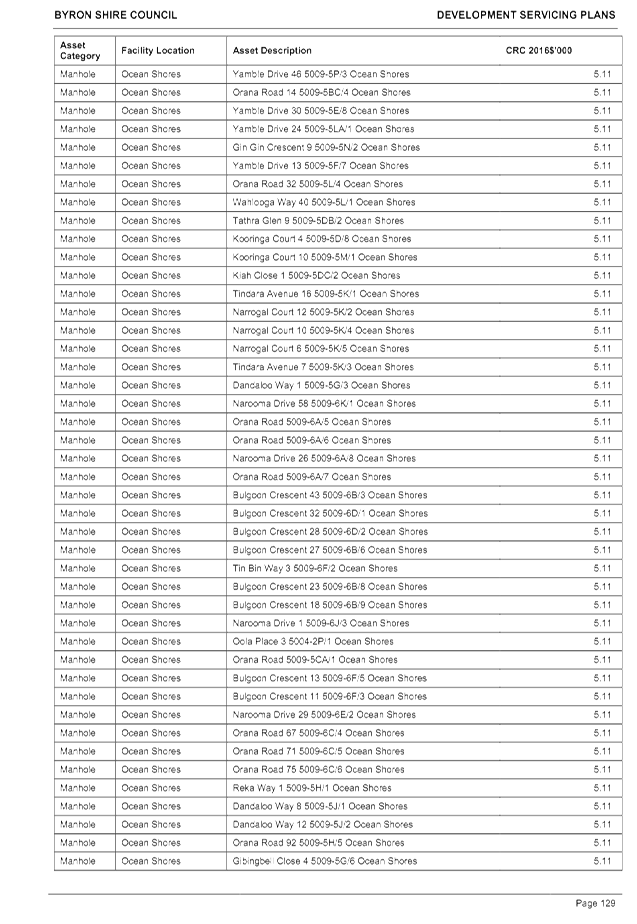
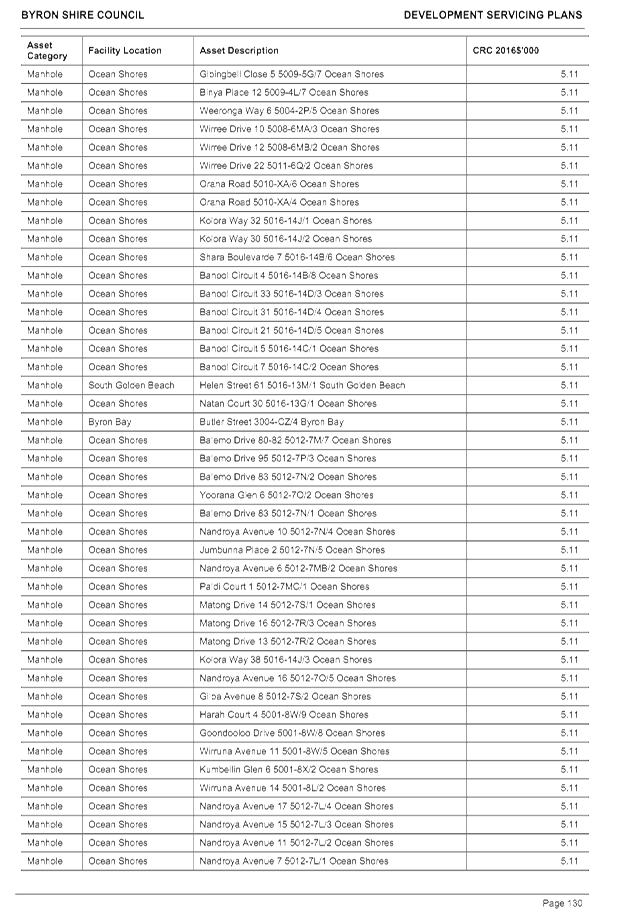
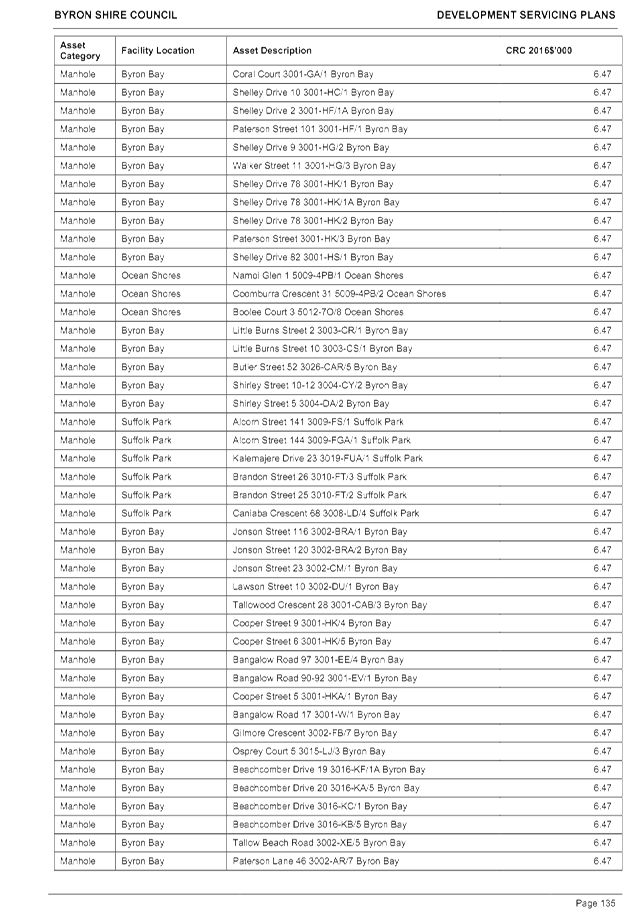
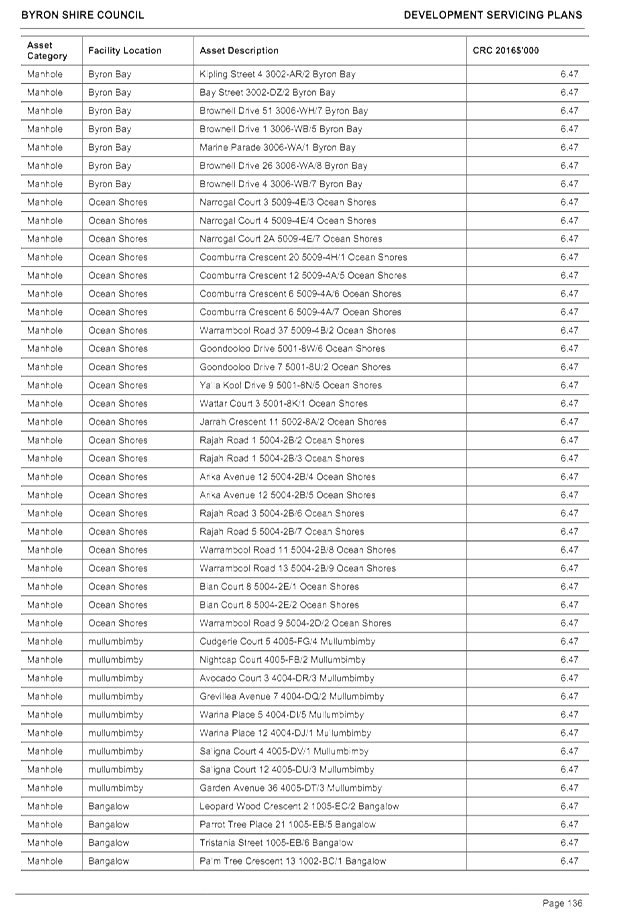
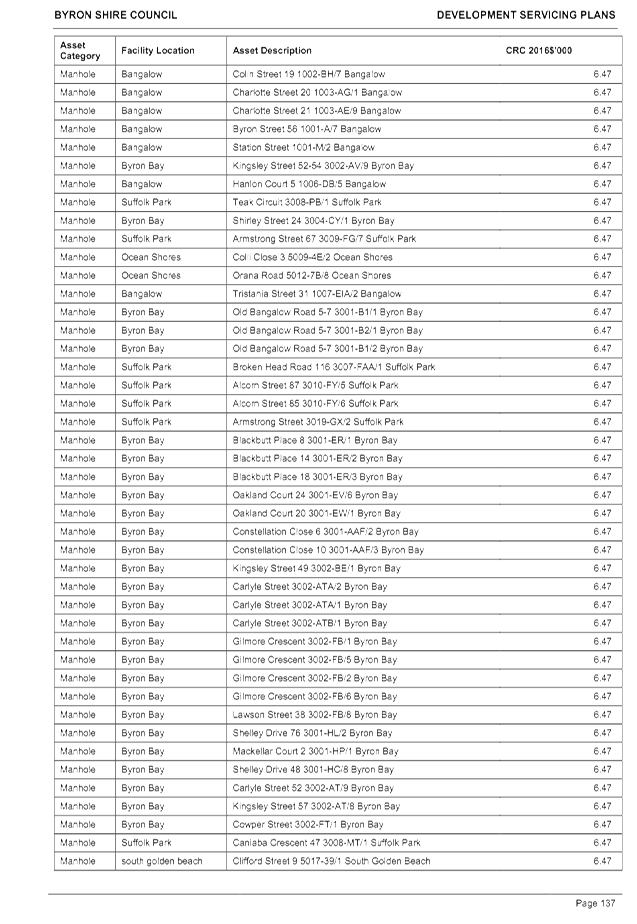
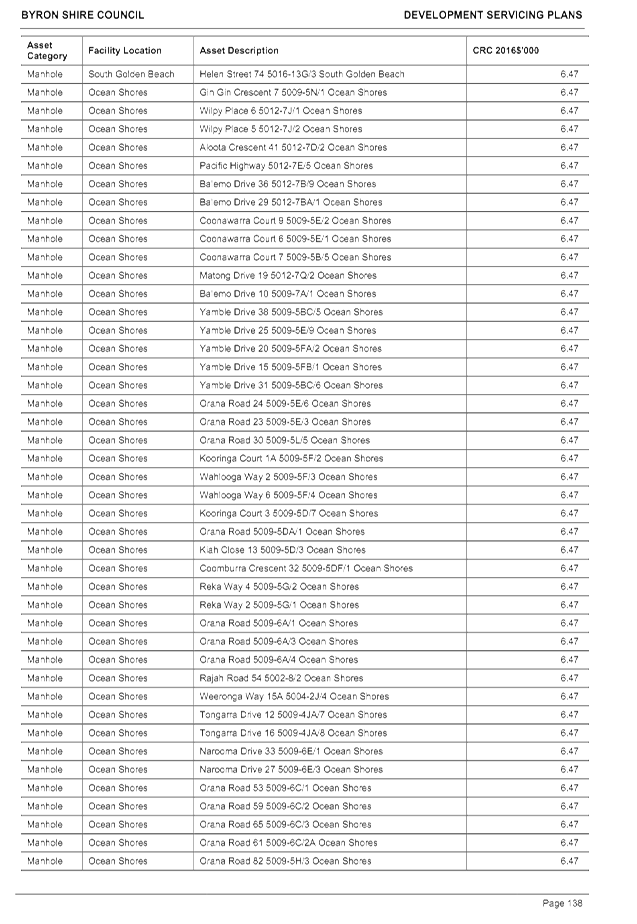
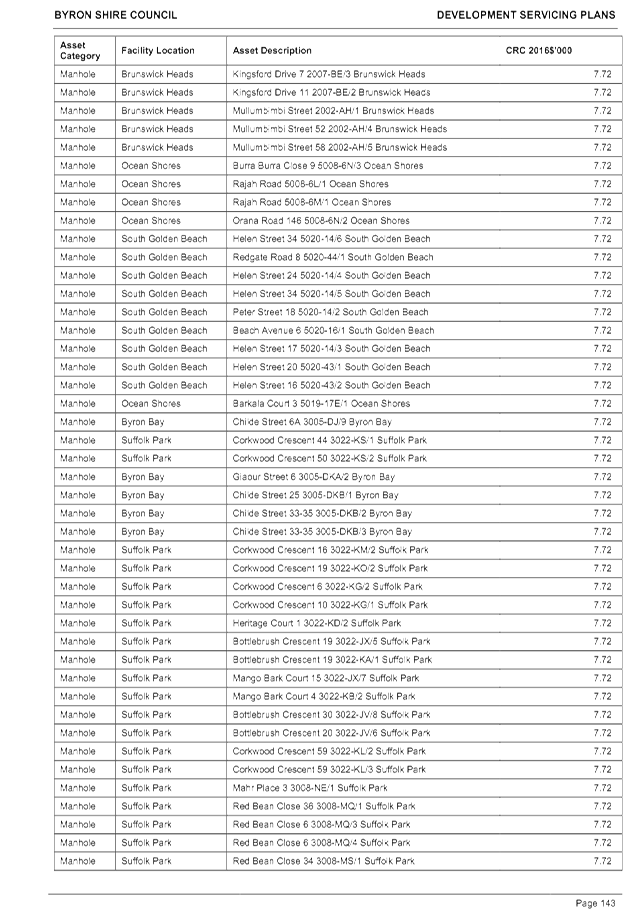
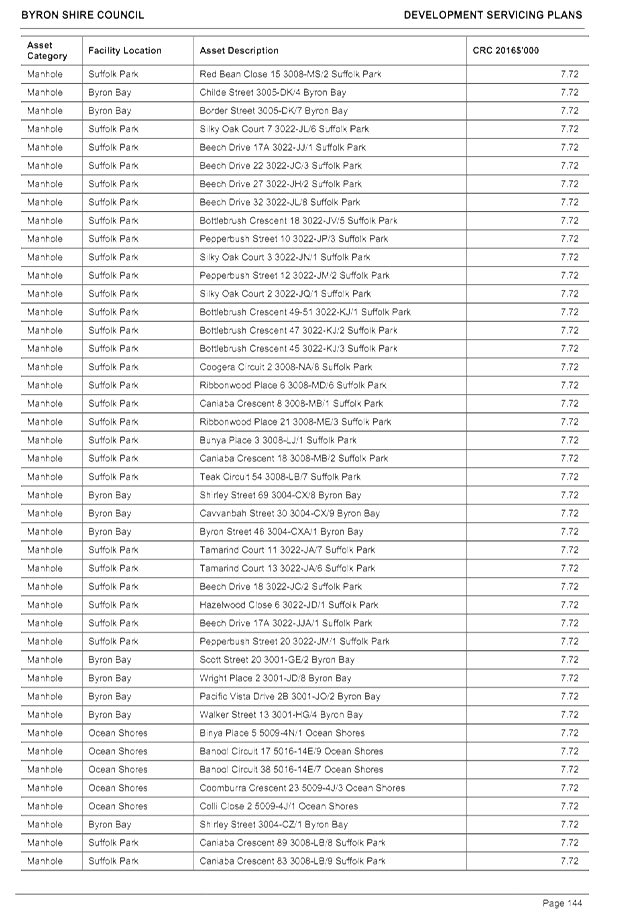
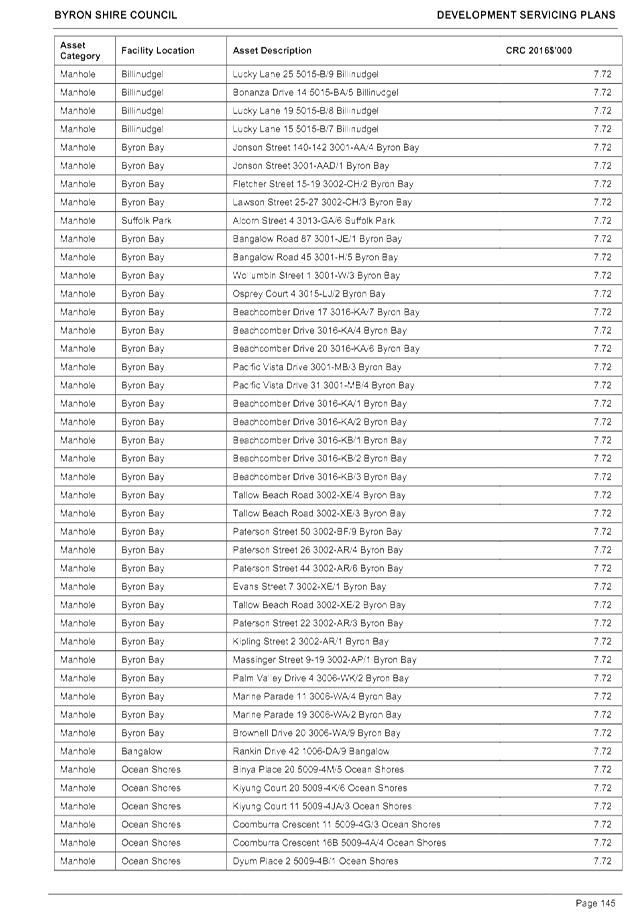
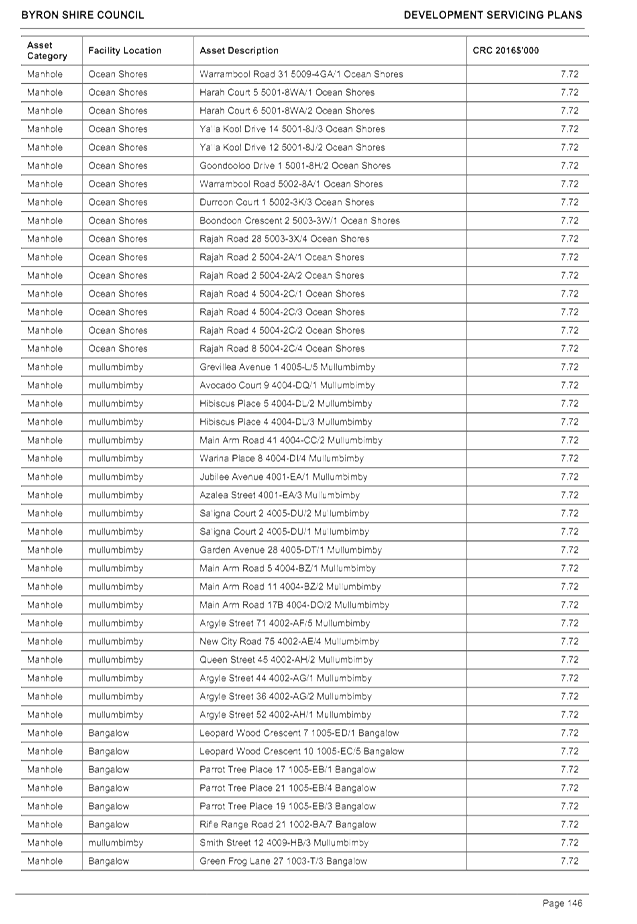
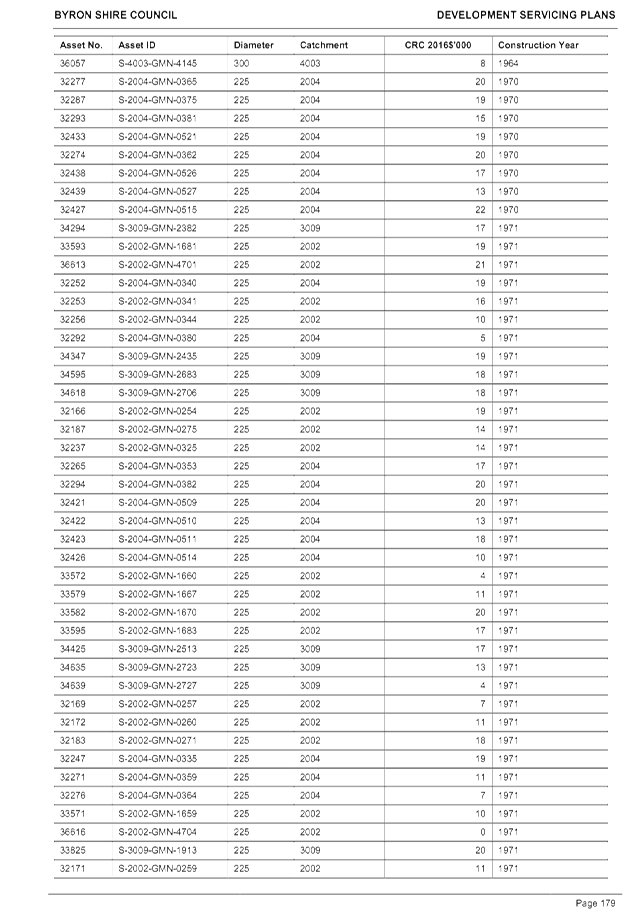
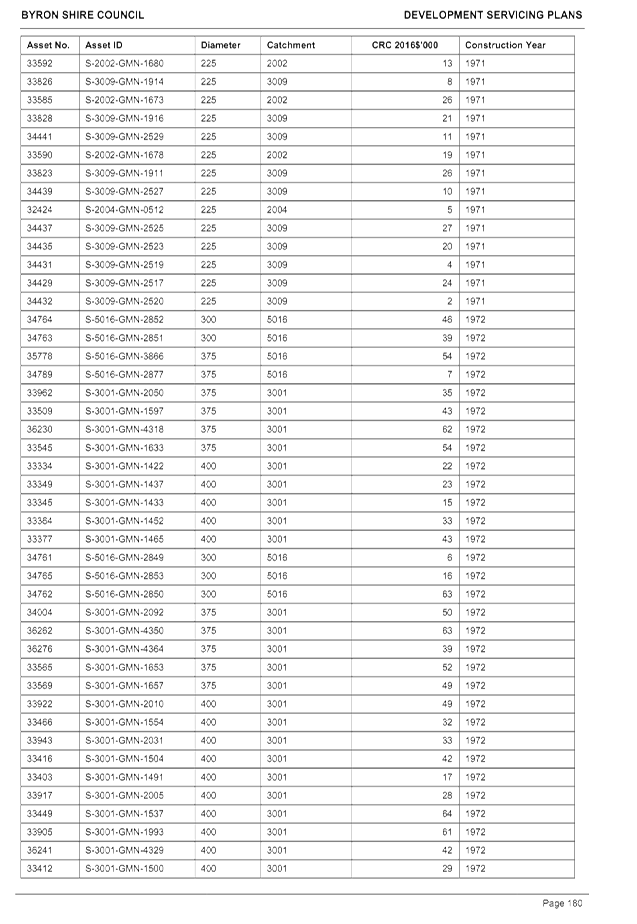
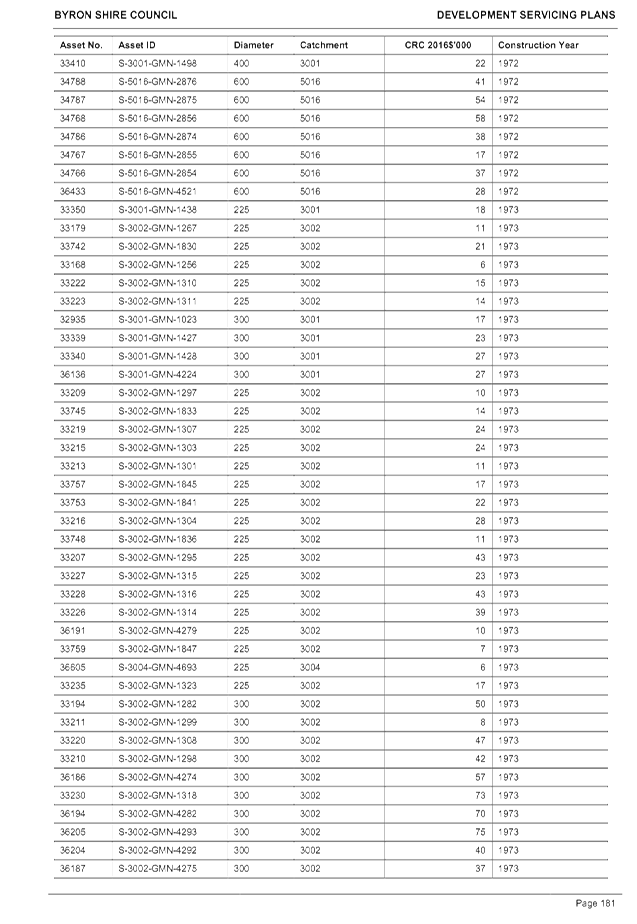
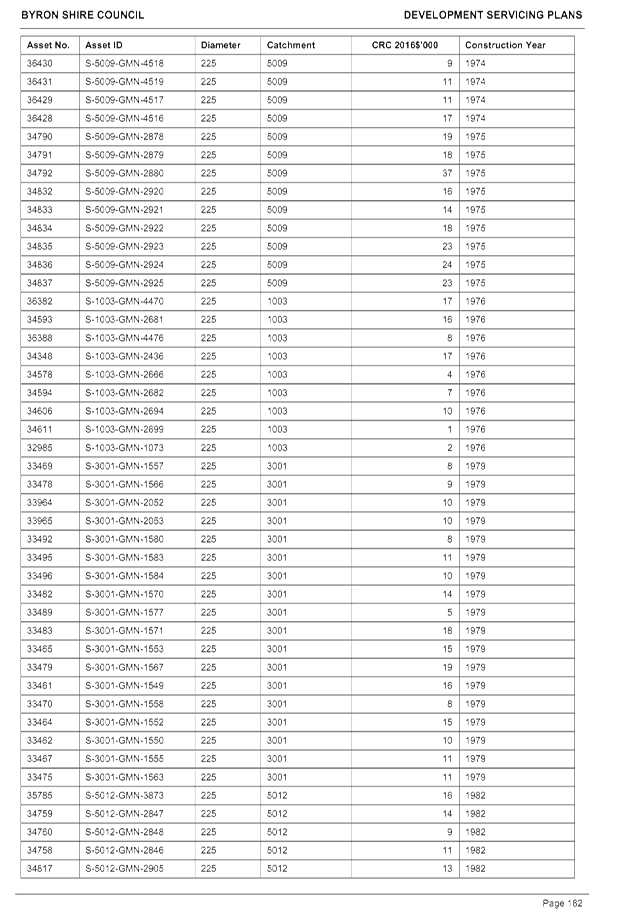
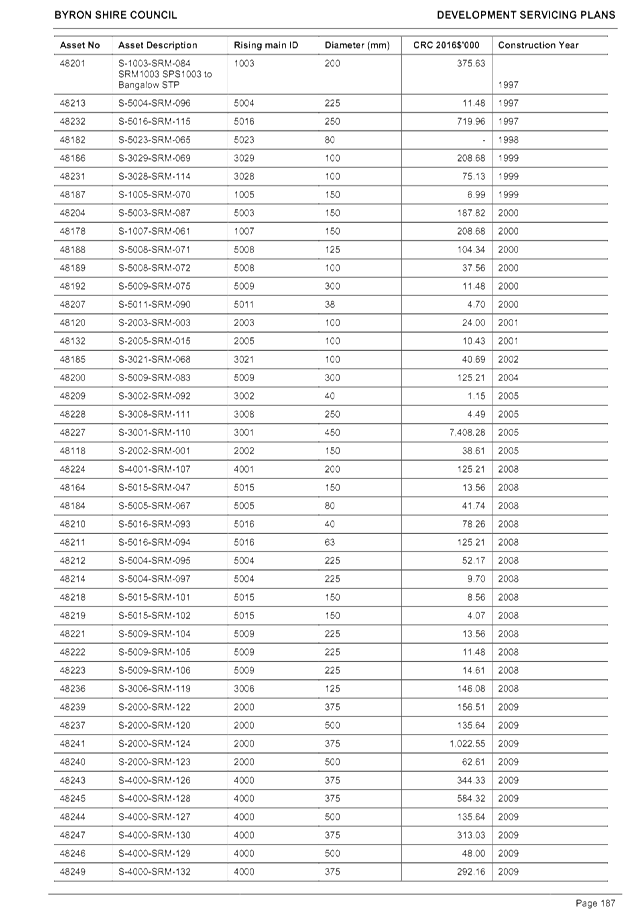
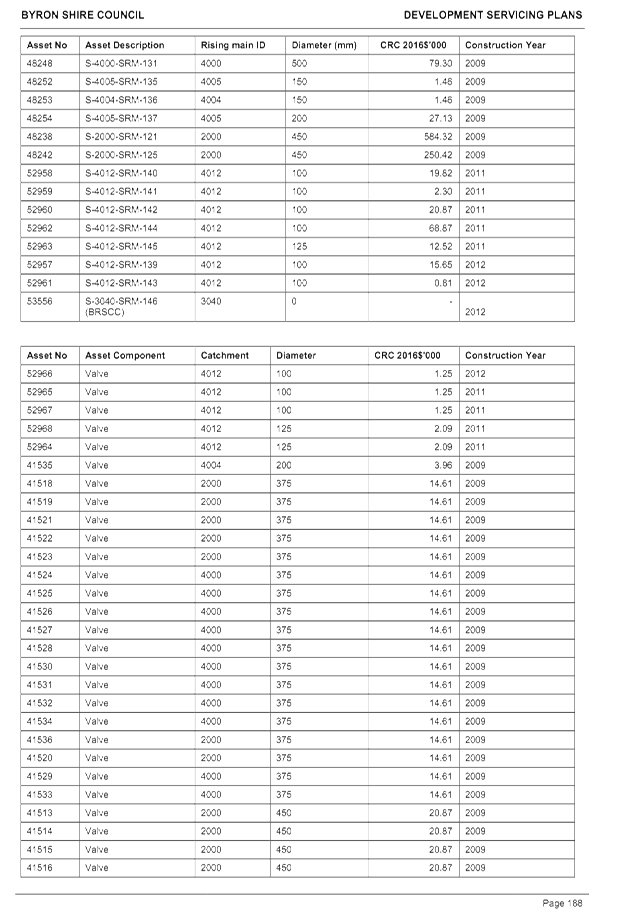
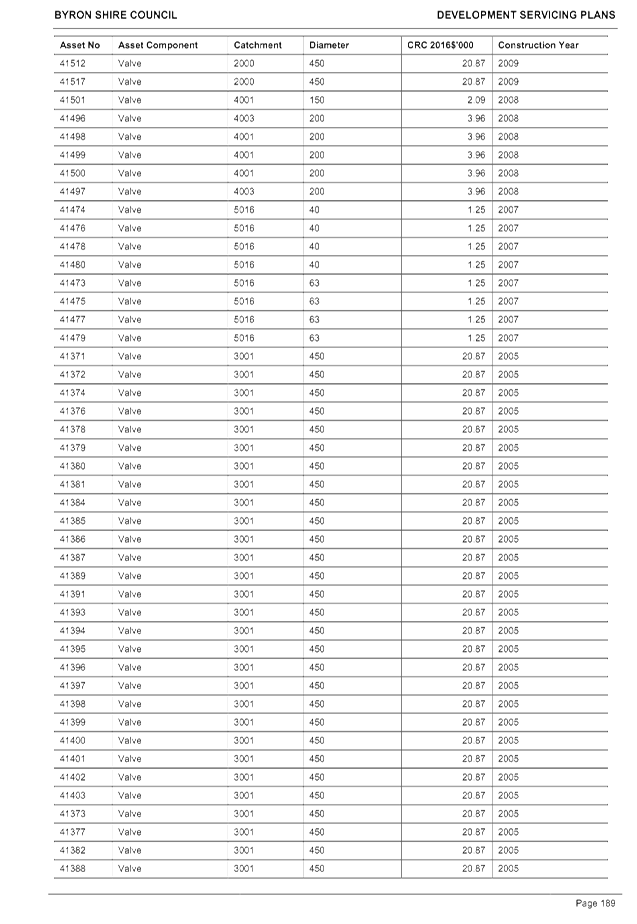
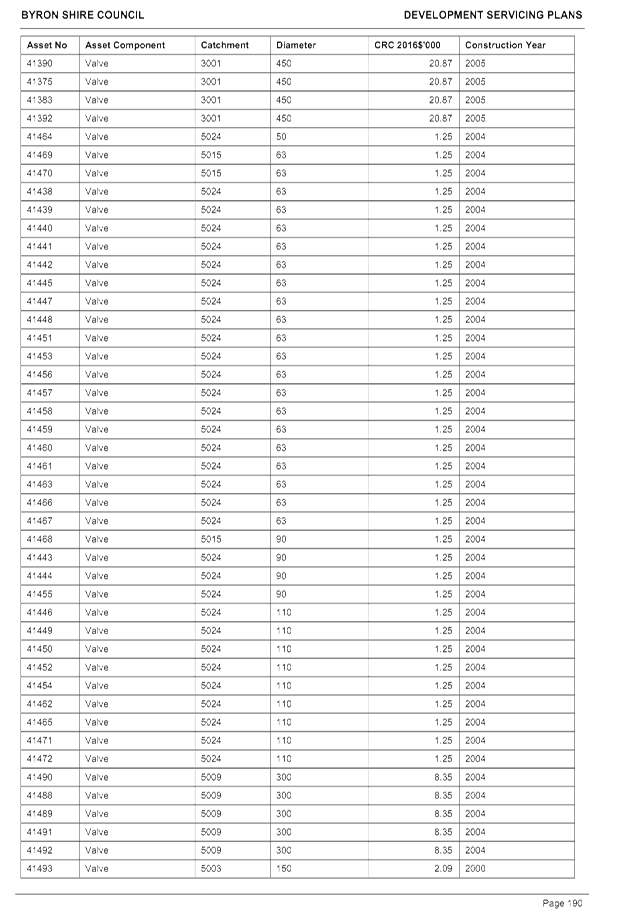
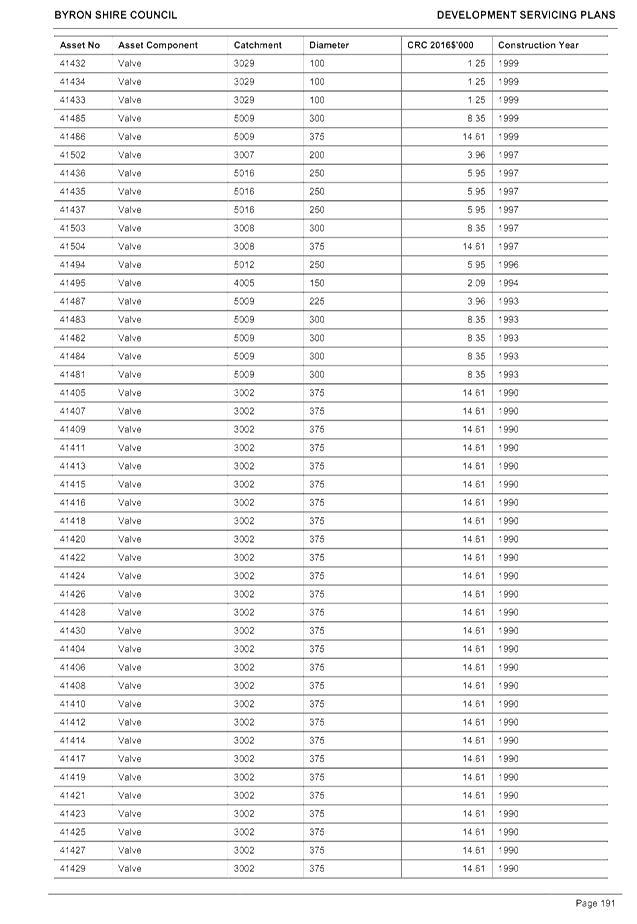
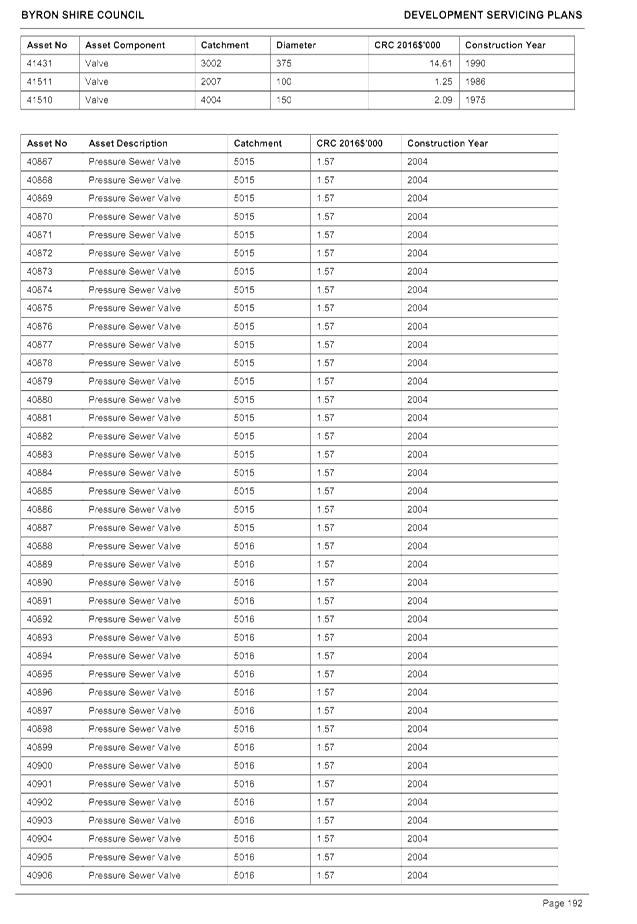
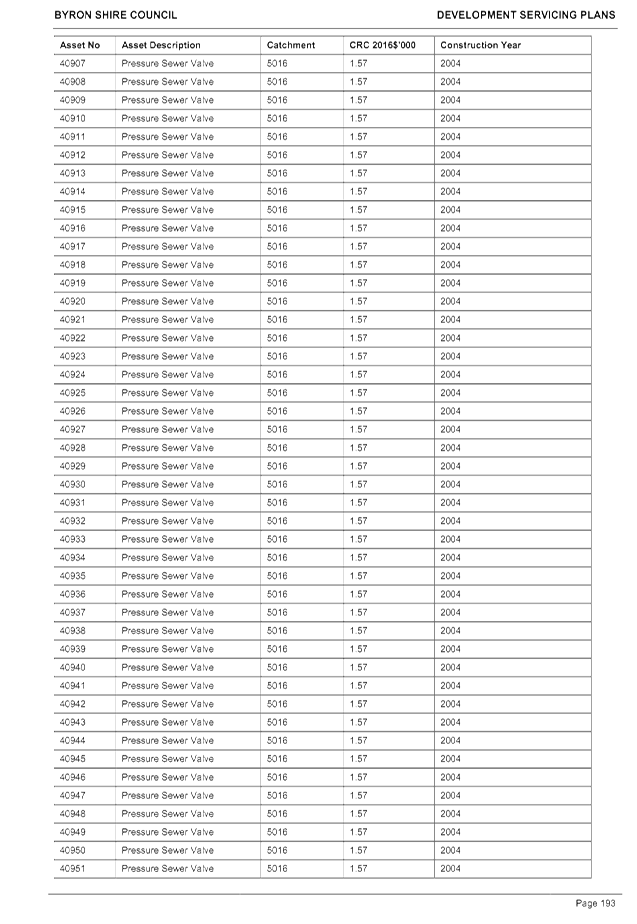
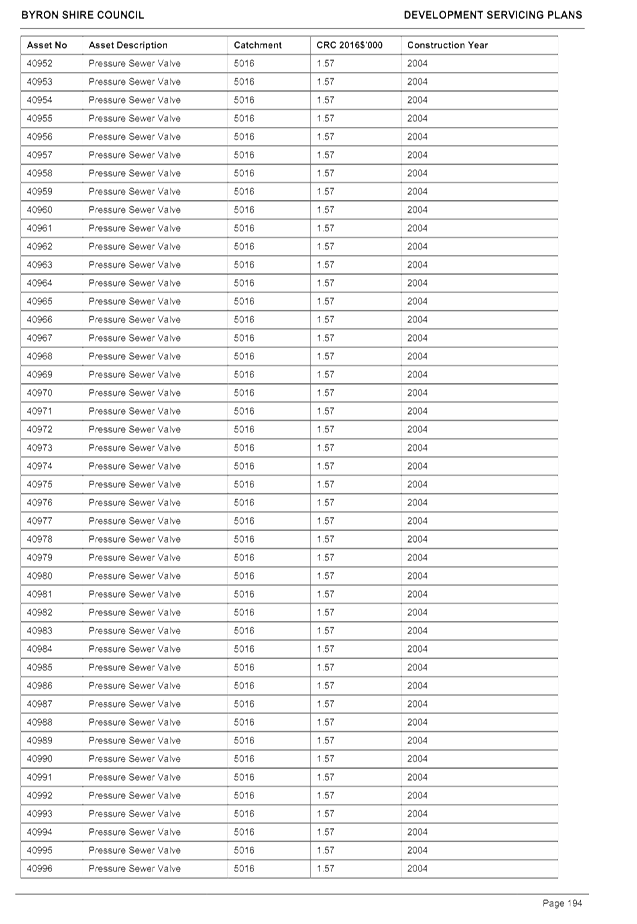
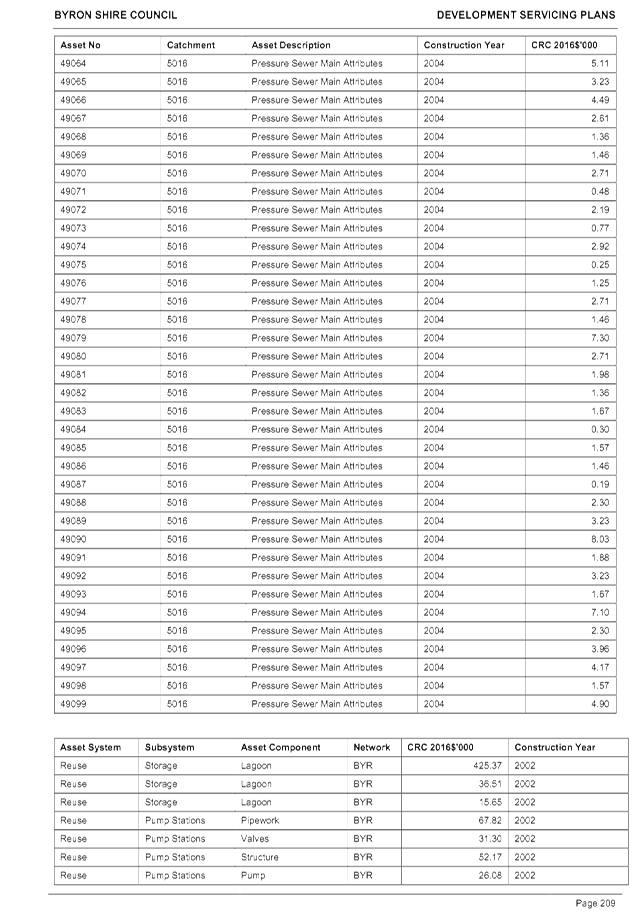
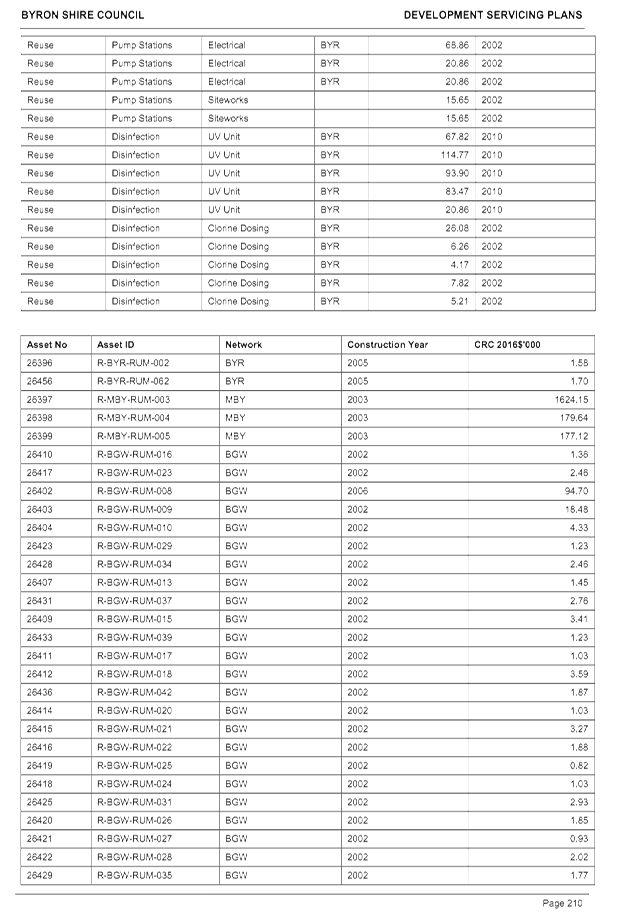
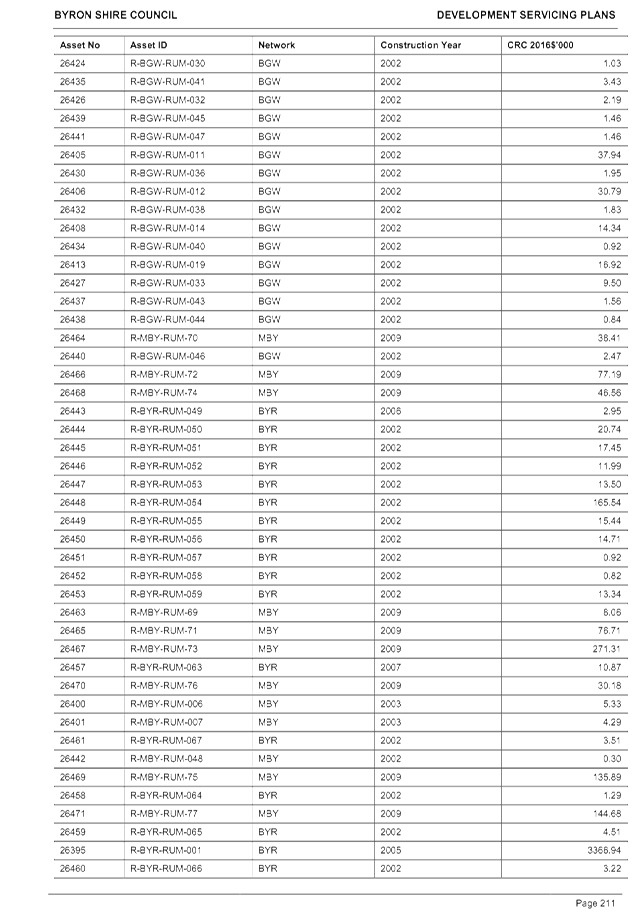
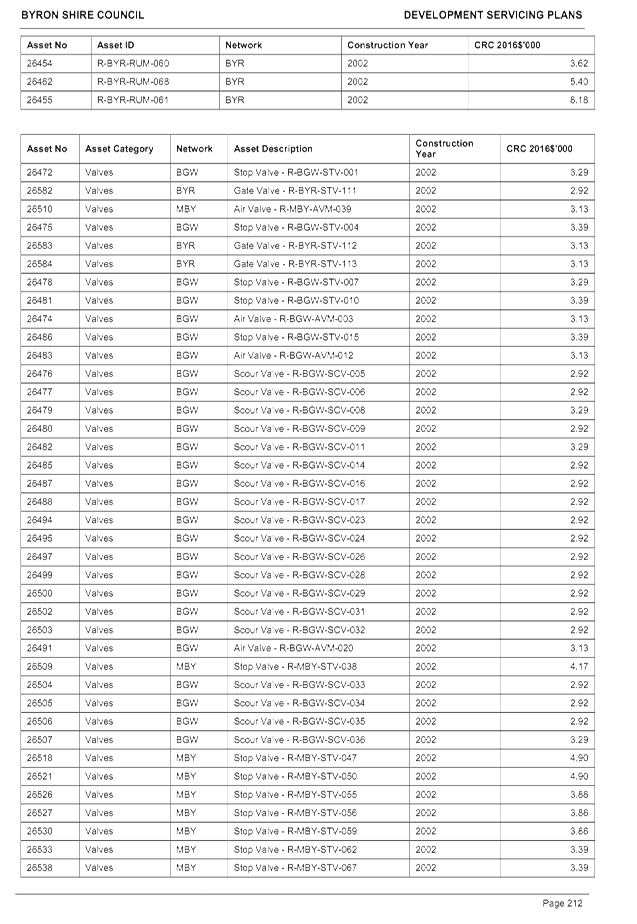
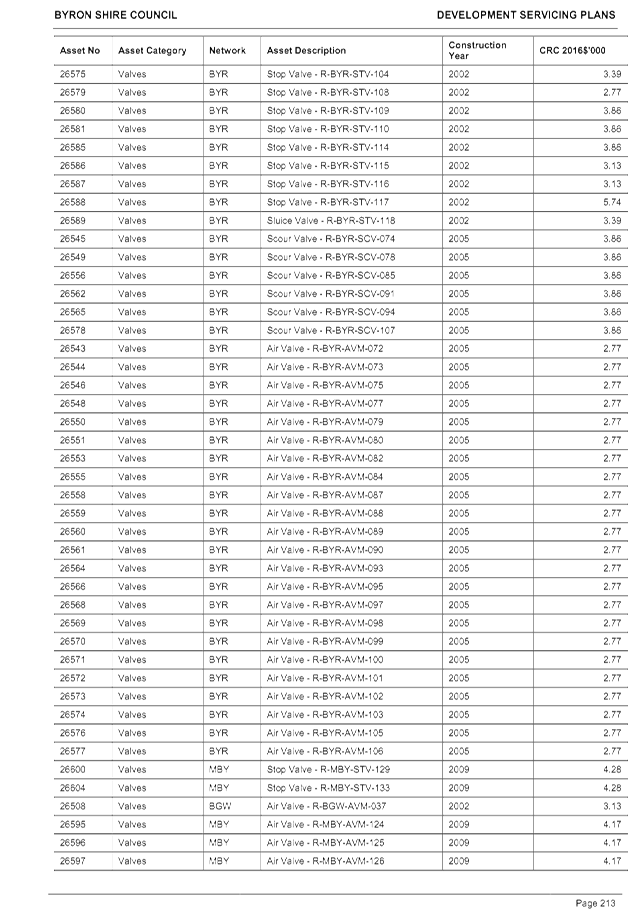
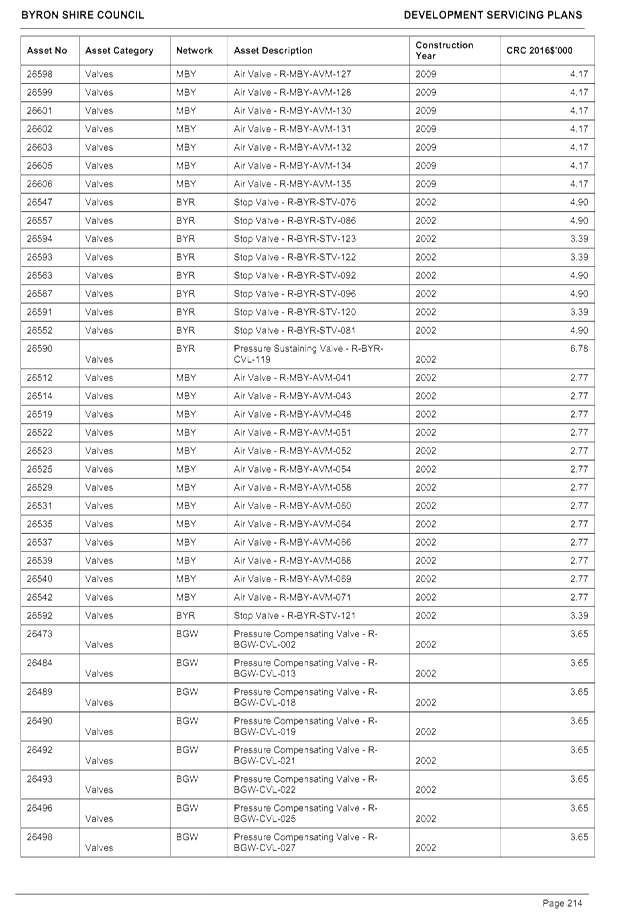
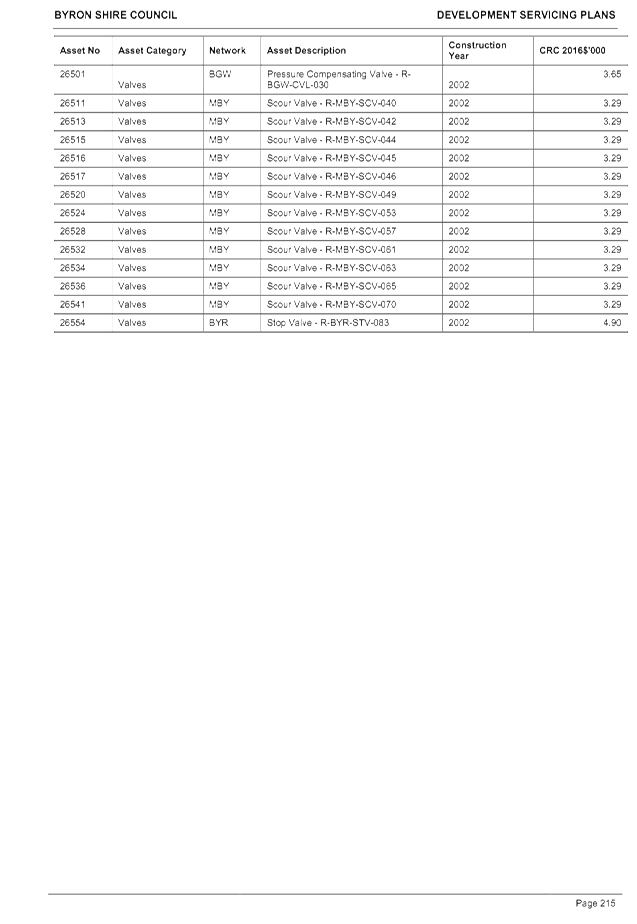
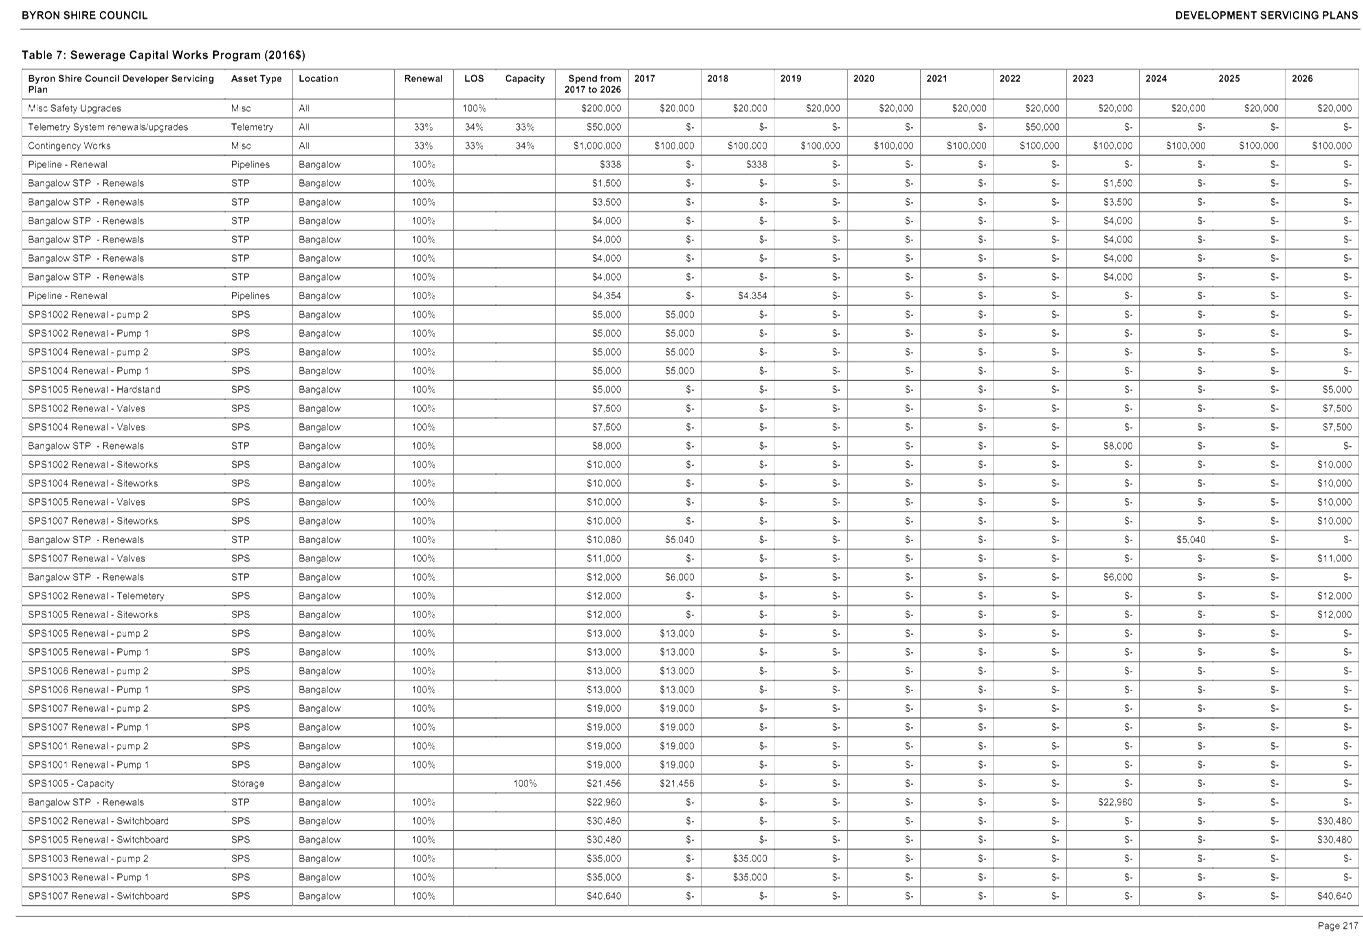
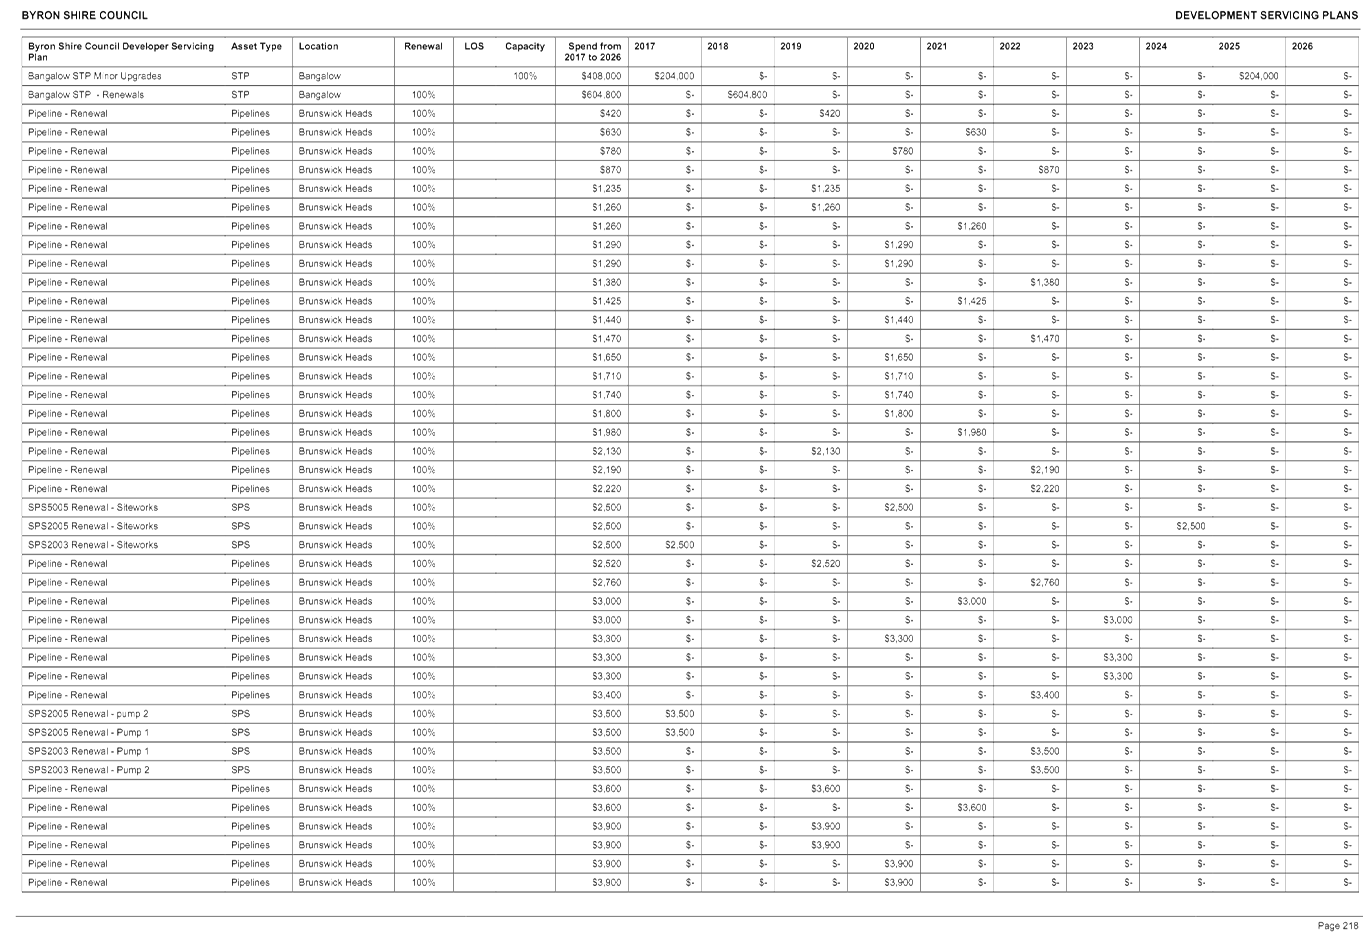
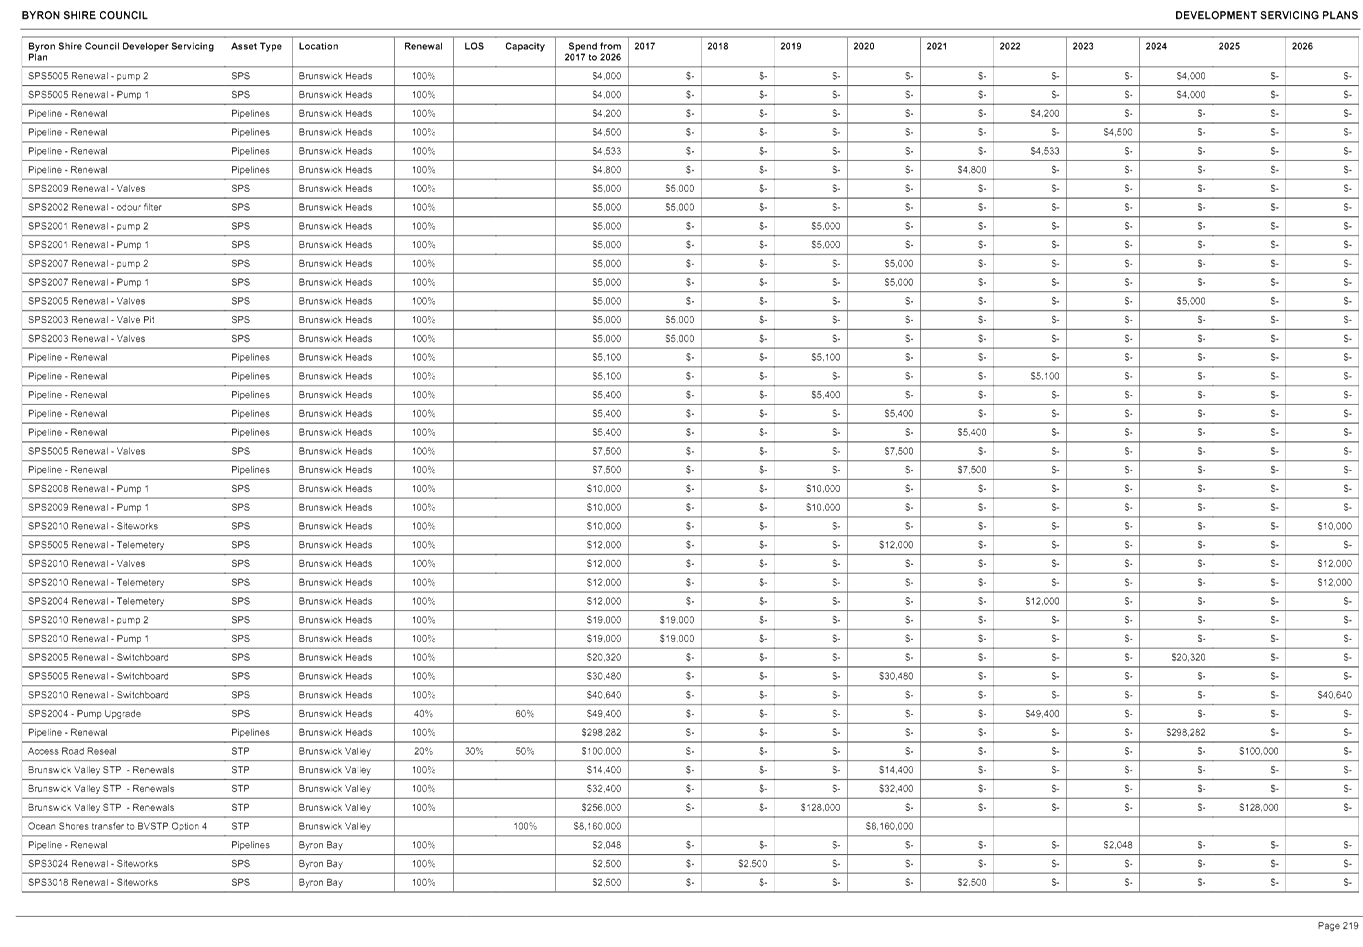
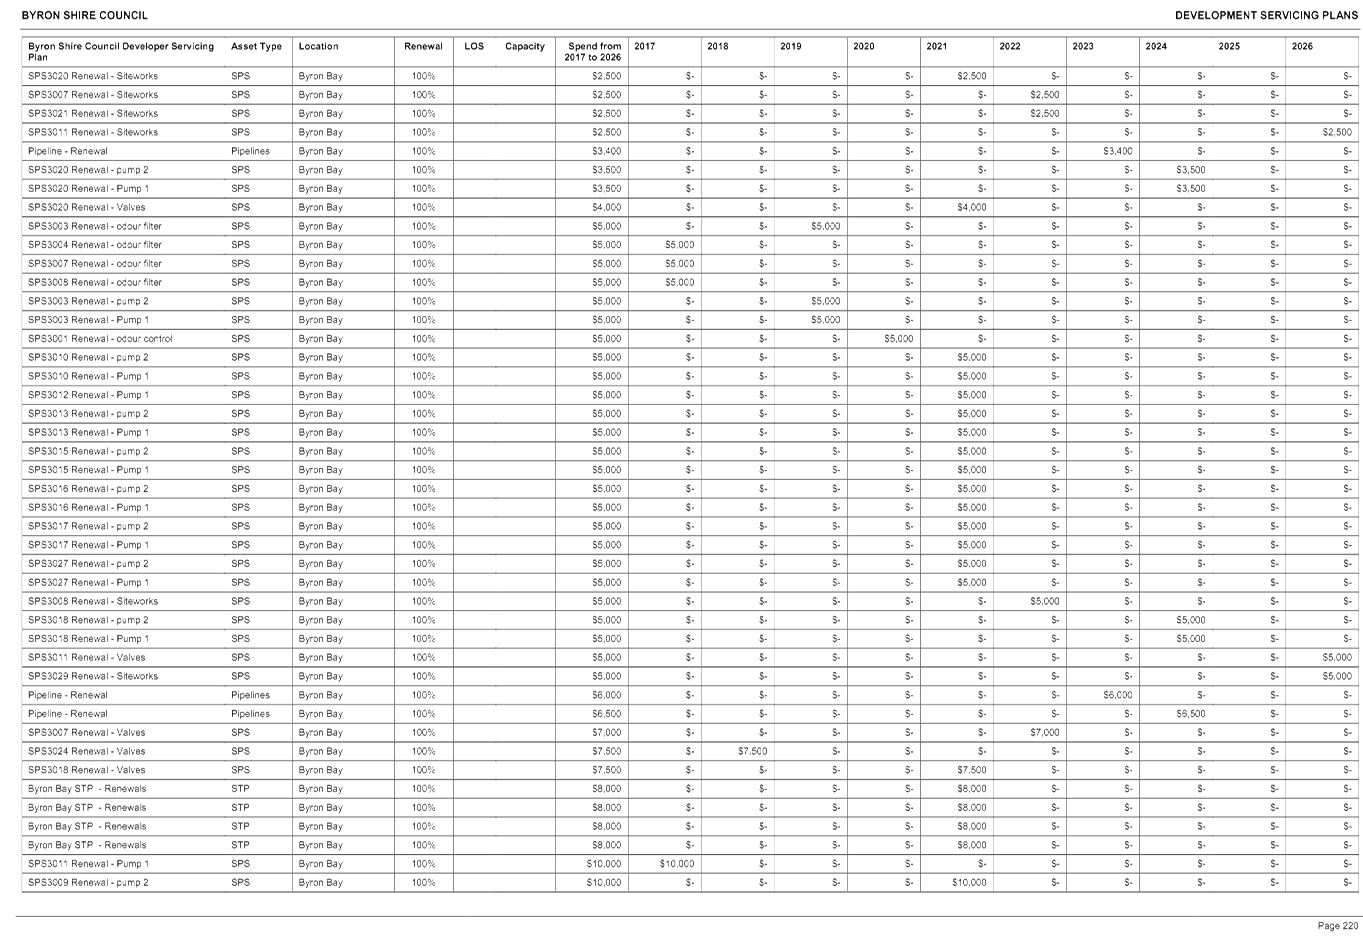
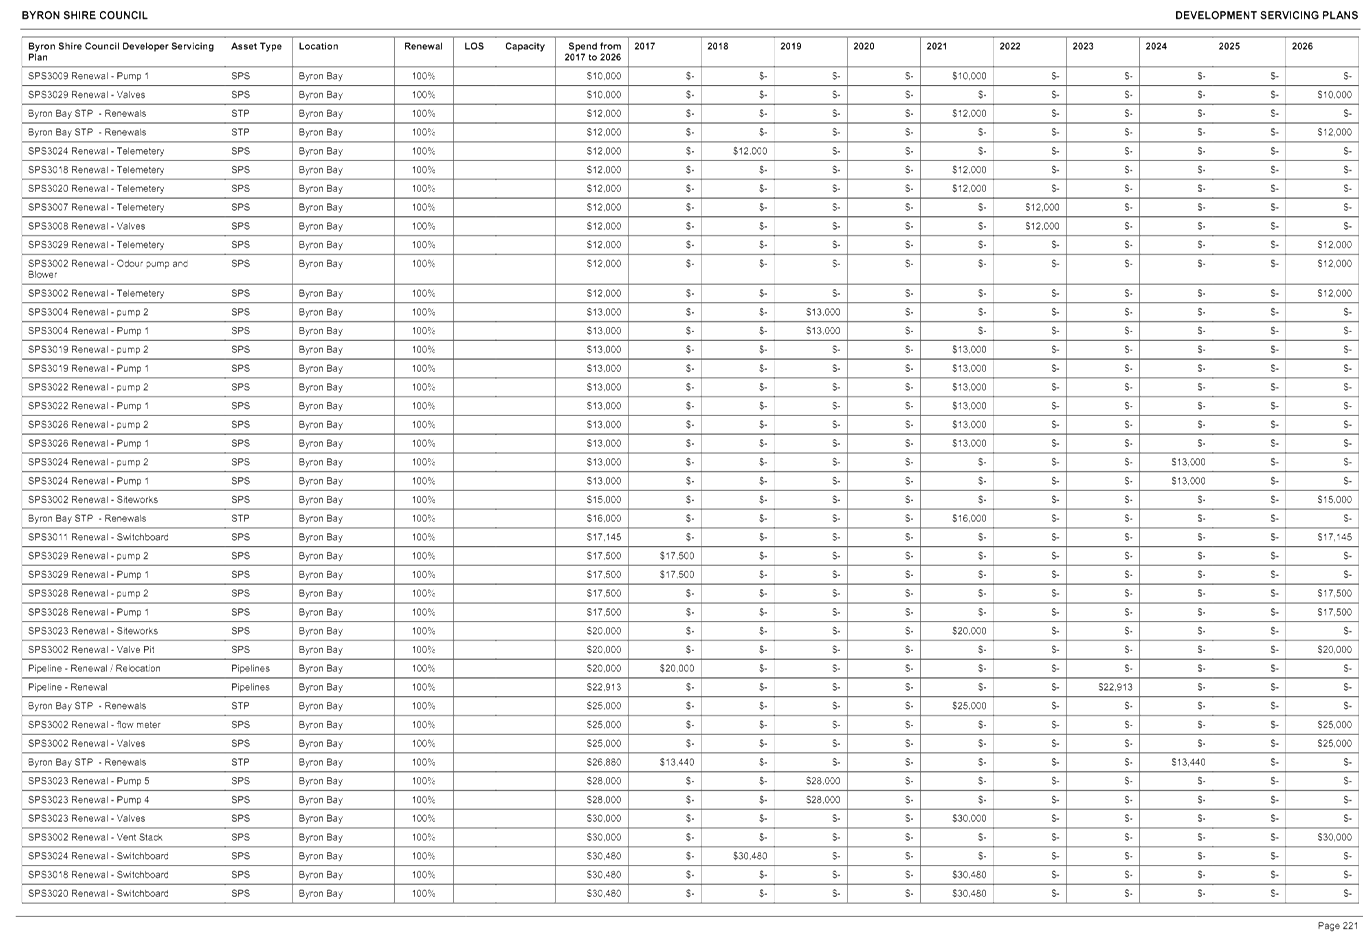
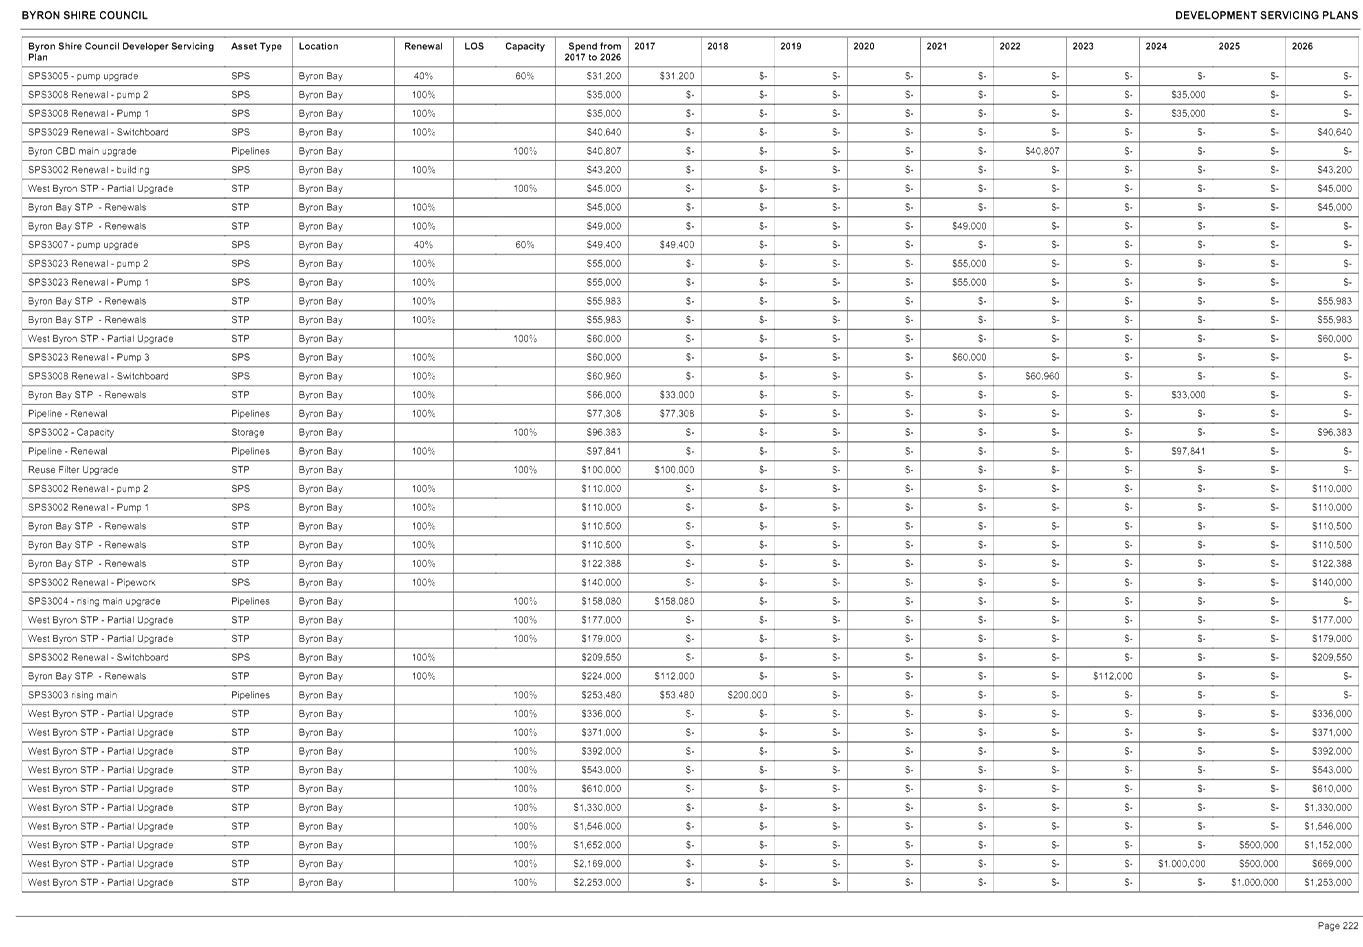
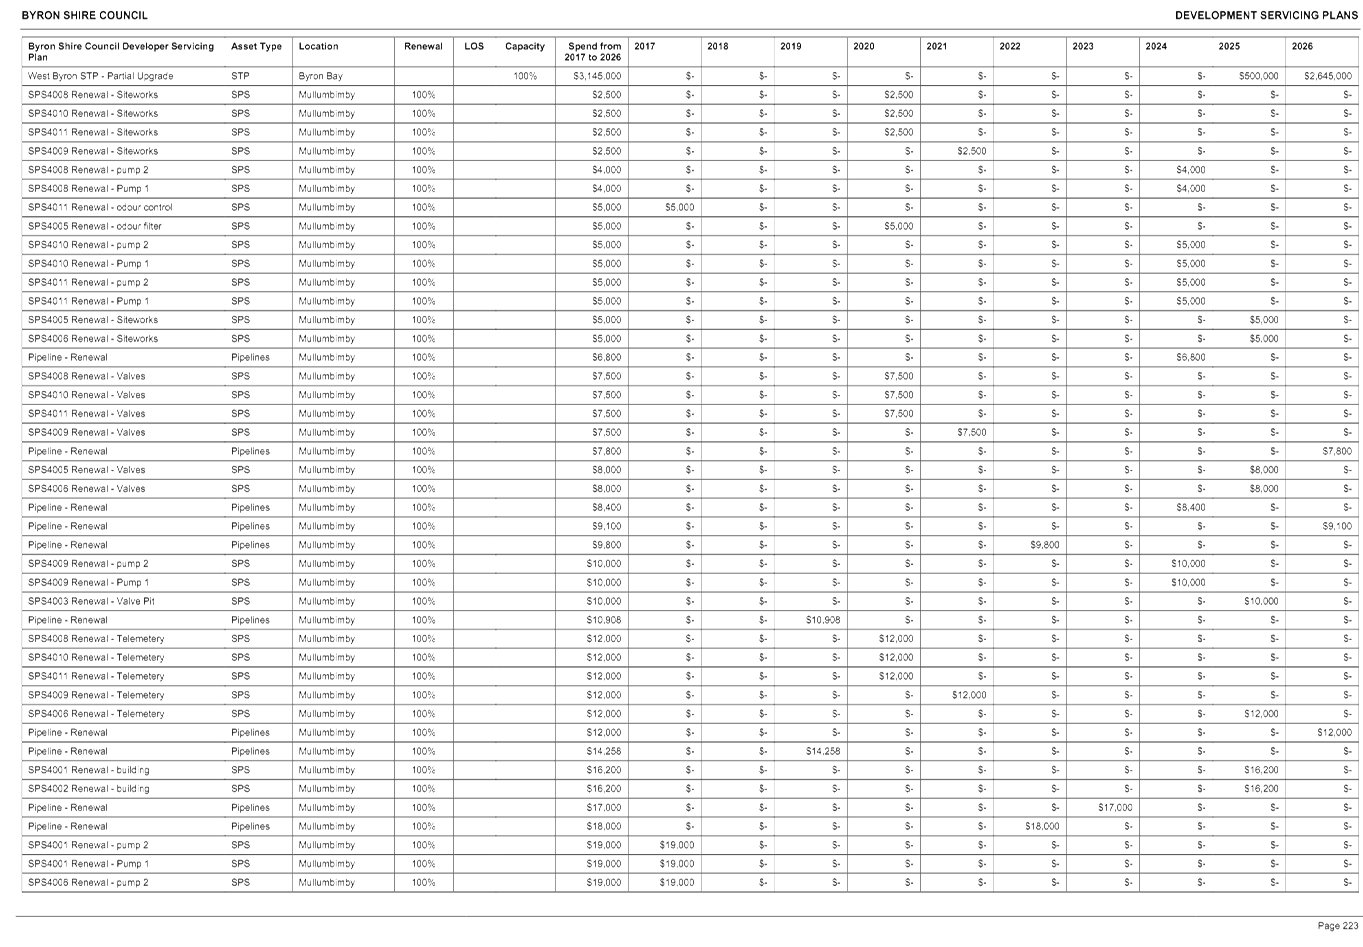
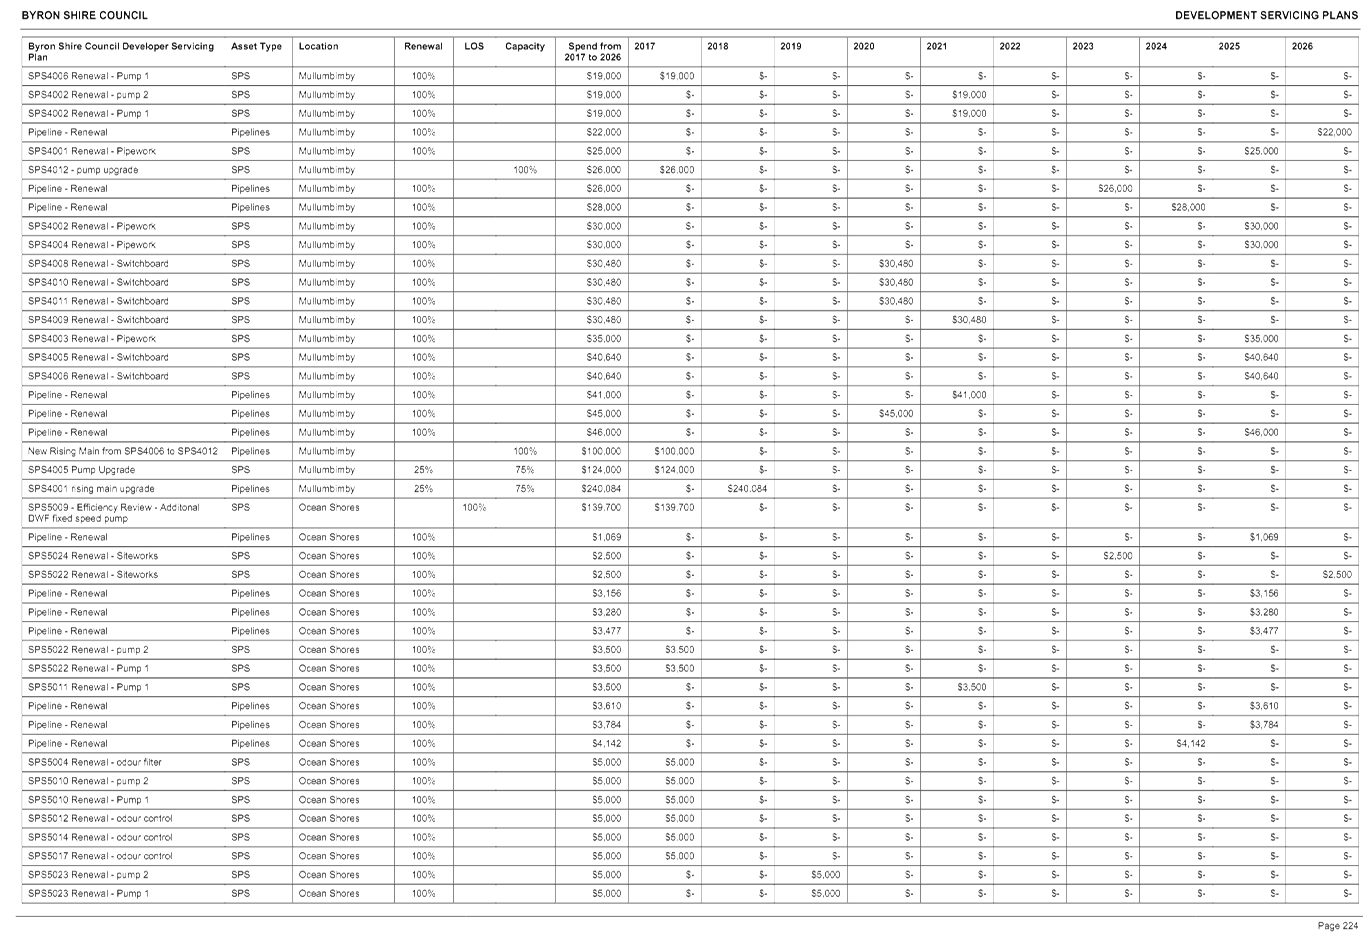
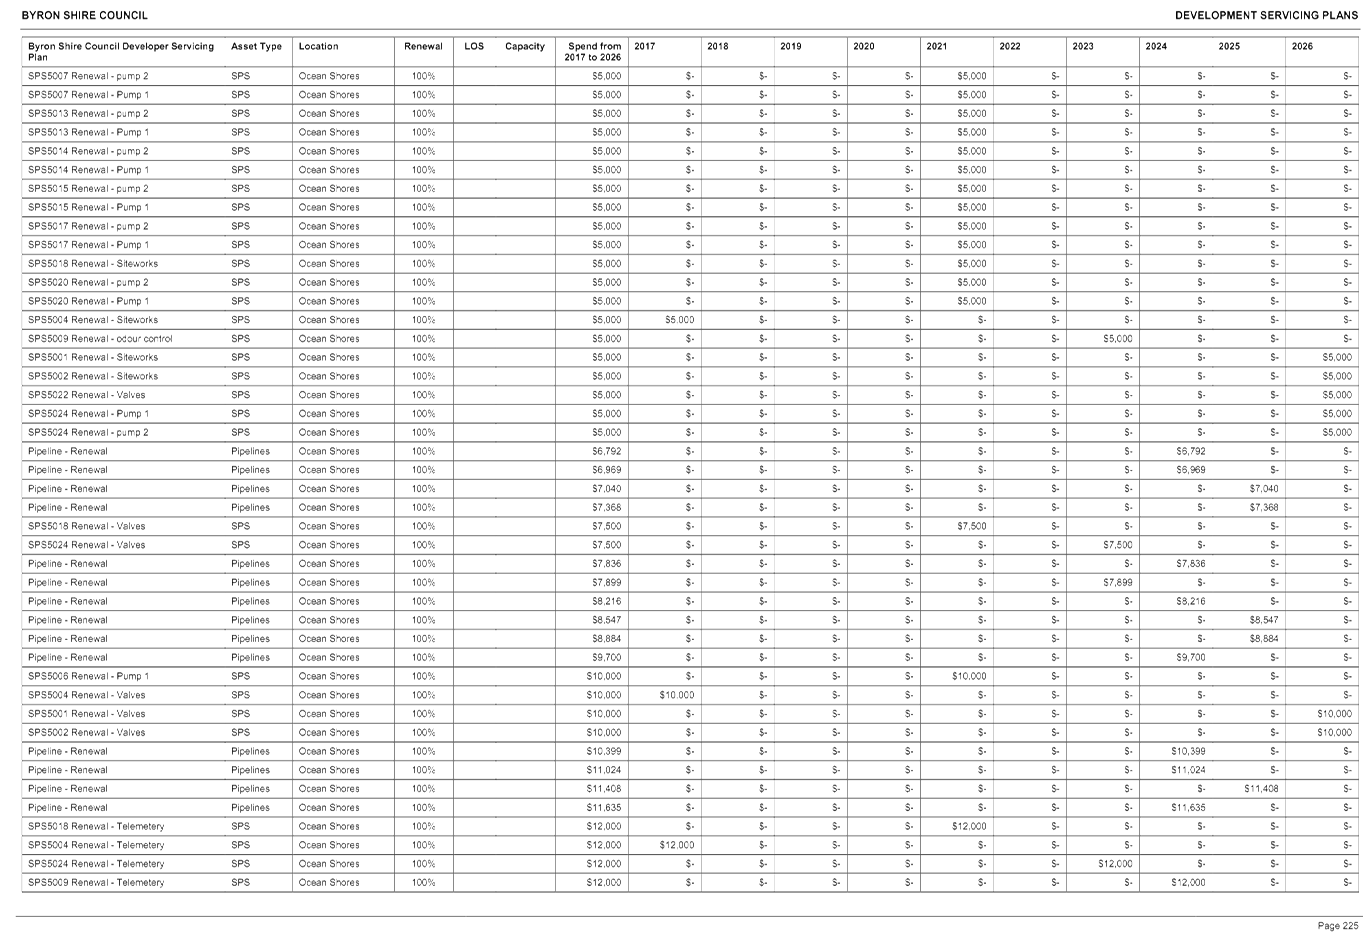
1... Byron Developer Servicing Plan Water Supply and Sewerage Rev 0. 262
Attachment
2... Byron DSP Background Document Rev 0........................................... 287


In person: 70-90 Station Street, Mullumbimby NSW
Postal Address: PO Box 219 Mullumbimby NSW 2482
Office Hours: 9.00am to 4.00pm Mon-Fri
Switchboard: 8.30am to 4.30pm Mon-Fri
Phone: 02 6626 7000
Fax: 02 6684 3018
Email: council@byron.nsw.gov.au
Web: www.byron.nsw.gov.au
Emergency After Hours 02 6622 7022
TABLE OF CONTENTS
INTRODUCTION.. 4
COMMUNITY
VISION.. 5
COMMUNITY
STRATEGIC PLAN – STRATEGIES AND OUTCOMES. 6
KEY
CAPITAL WORKS HIGHLIGHTS. 7
2016-2017
OPERATIONAL PLAN.. 8
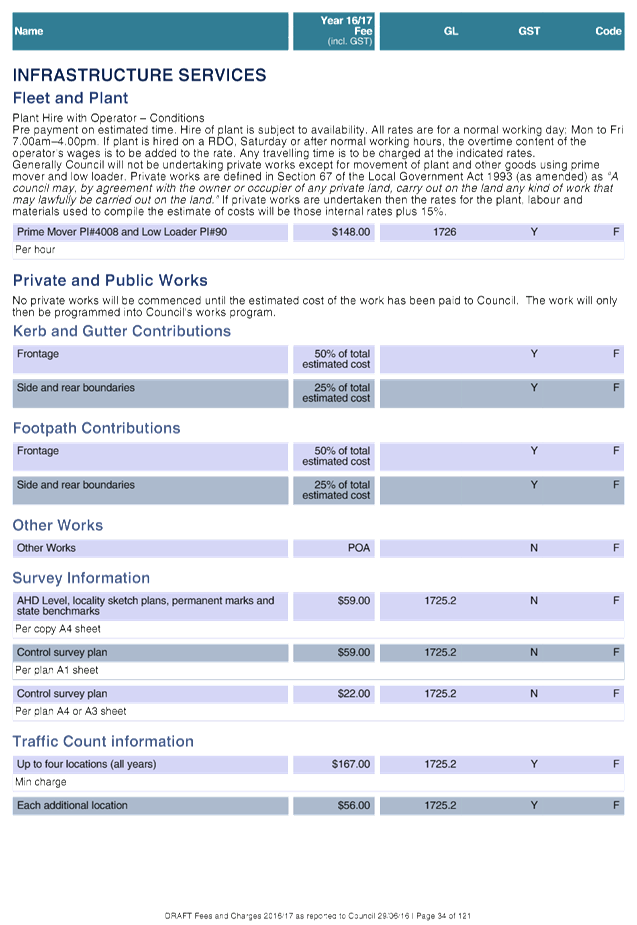
INFRASTRUCTURE SERVICES. 8
Supervision and Administration. 8
Asset Management Planning. 8
Projects and Commercial Development 9
Emergency Services and Floods. 10
Depot and Fleet Management 10
Local Roads and Drainage. 11
Roads and Maritime Services. 13
Quarries. 13
Open Space and Recreation. 13
The Cavanbah Centre. 15
Waste and Recycling Services. 15
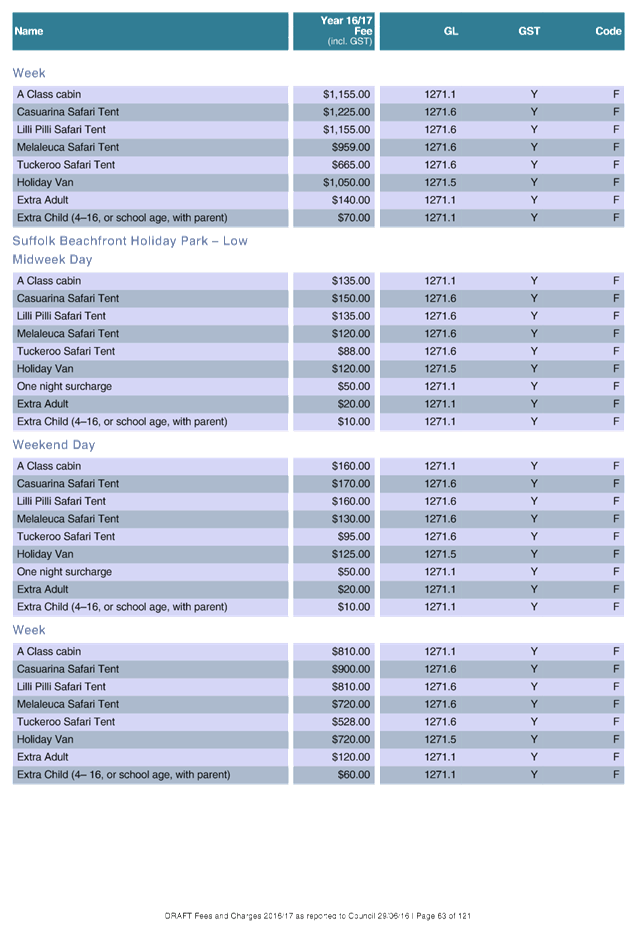
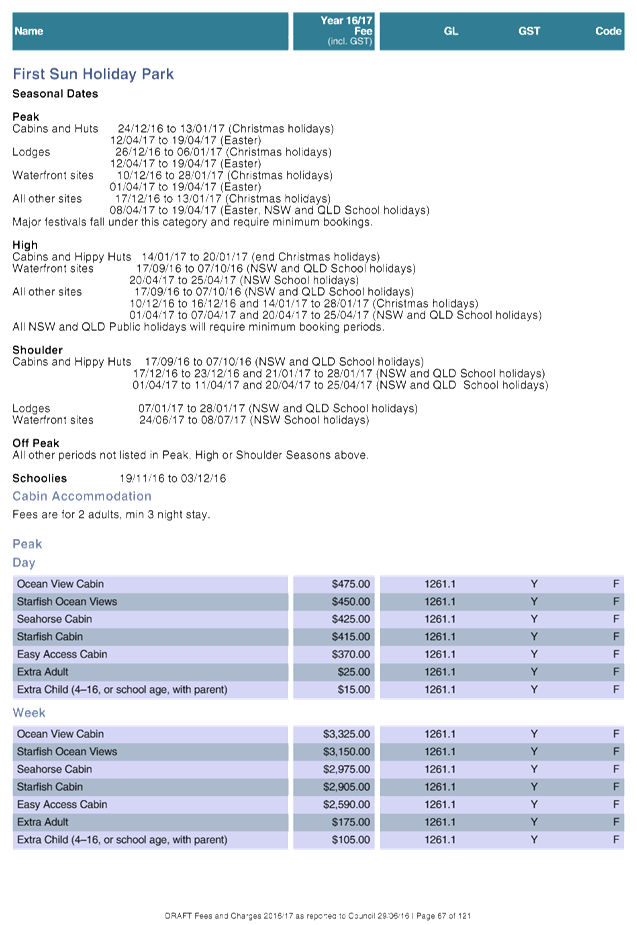
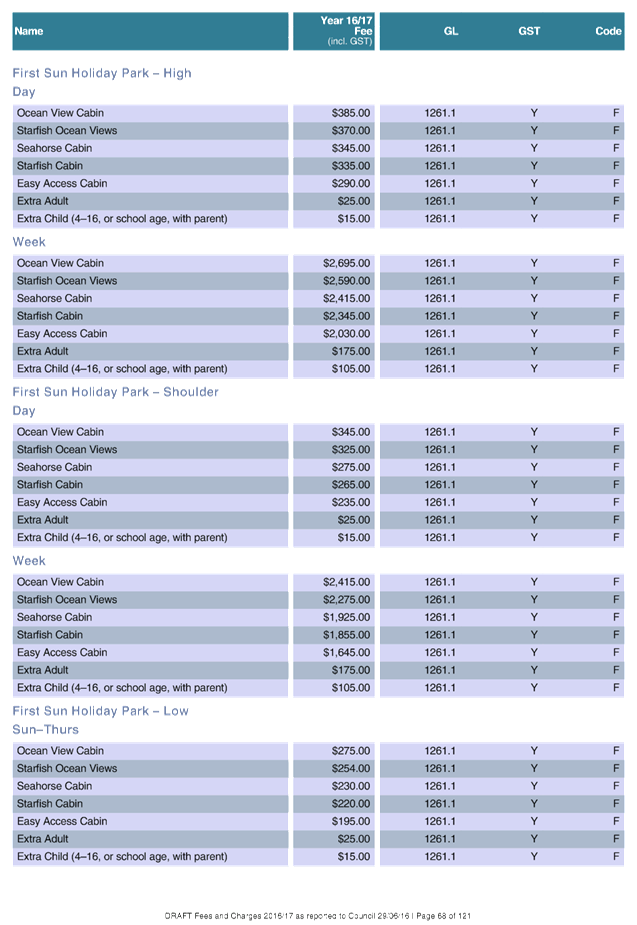
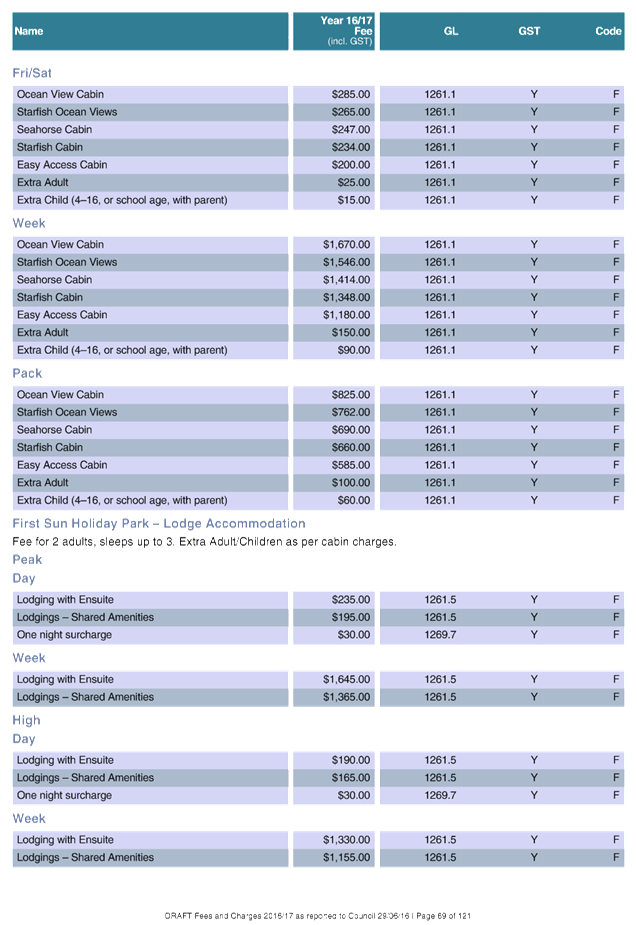
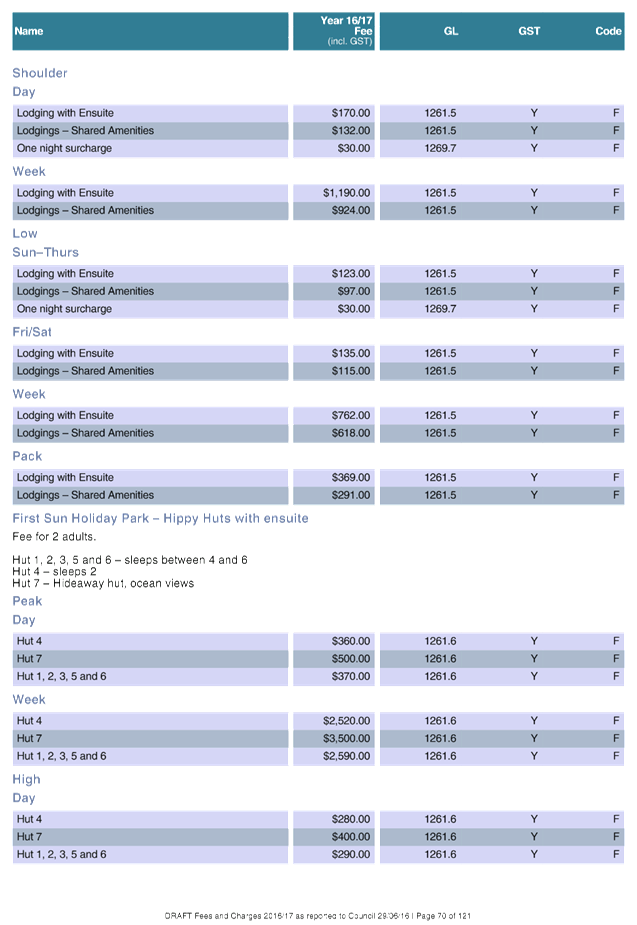
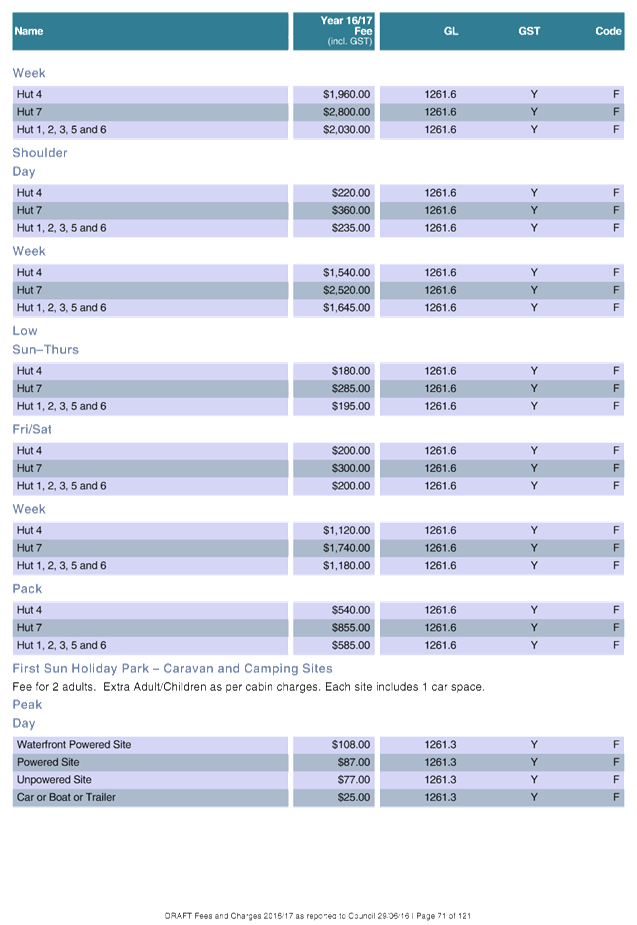
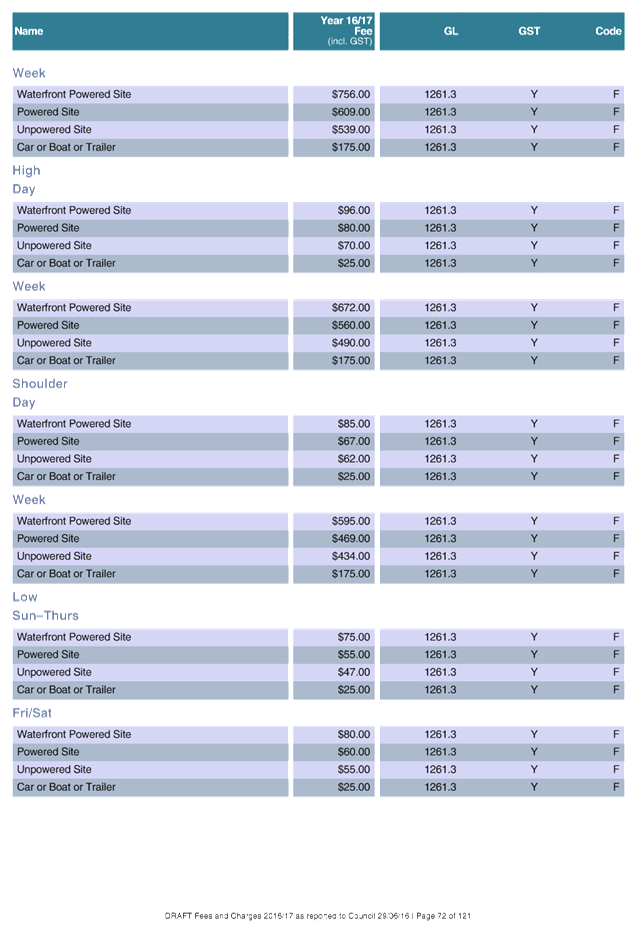
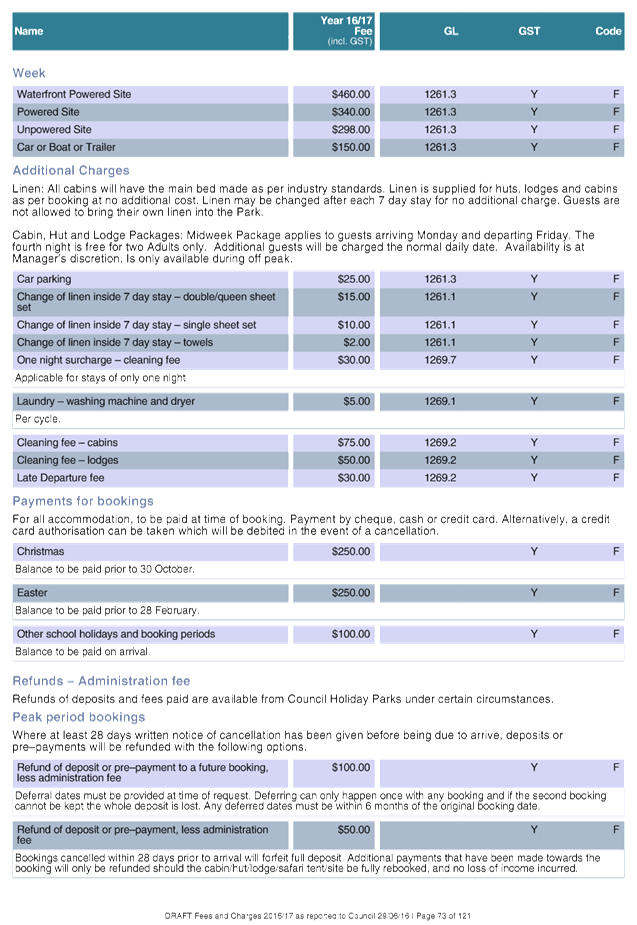
First Sun Holiday Park. 16
Suffolk Beachfront Holiday Park. 16
Facilities Management 17
Water Supplies. 17
Sewerage Services. 18
SUSTAINABLE ENVIRONMENT AND ECONOMY. 20
Development and Certification. 20
Environment and Compliance Services. 21
Planning Policy and Natural Environment 21
Economic Development 22
GENERAL MANAGER. 23
General Manager 23
People and Culture Services. 24
CORPORATE AND COMMUNITY SERVICES. 25
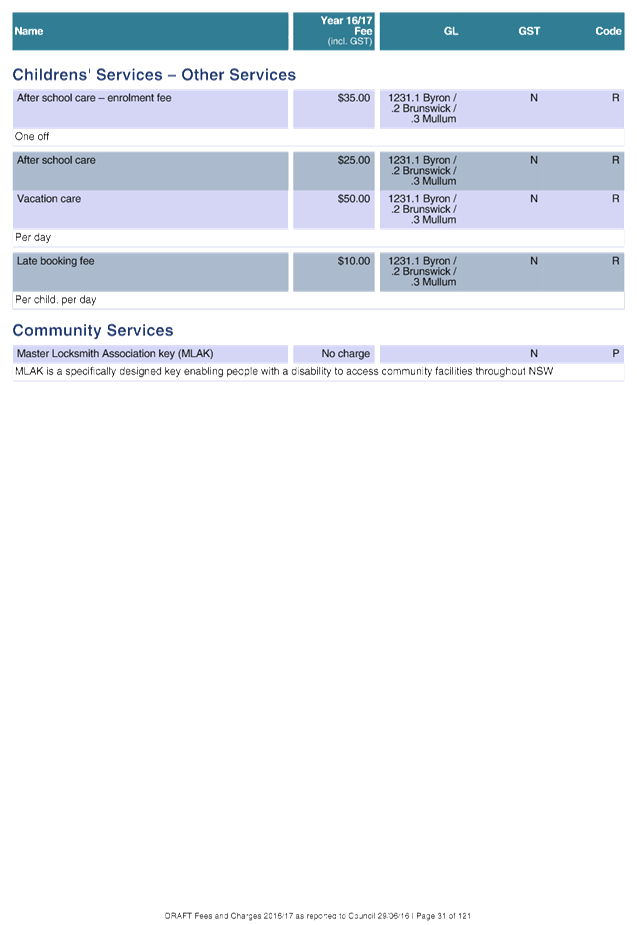
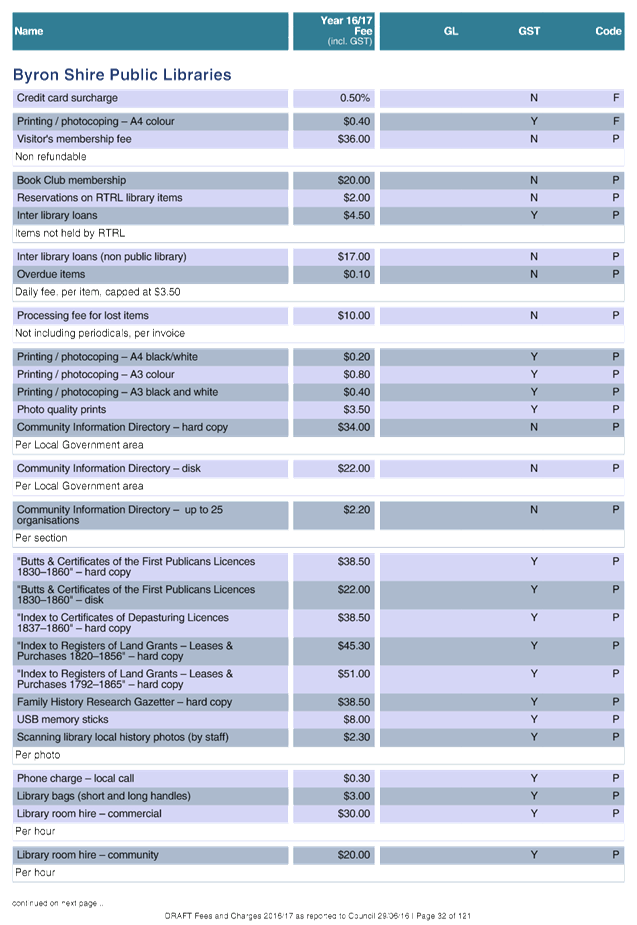
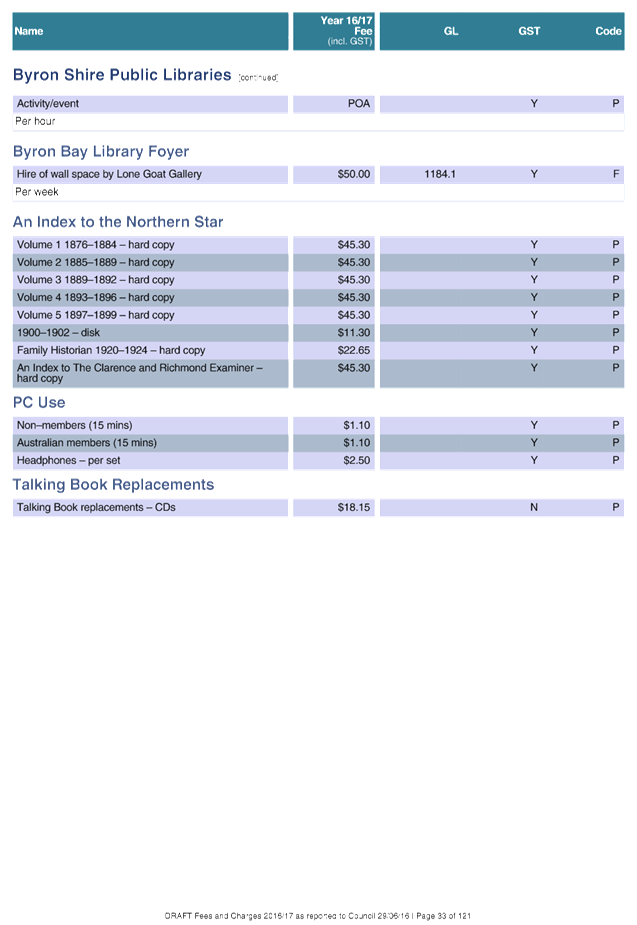
Public Libraries. 25
Children's Services - Other Children's
Services. 25
Children's Services –
Sandhill’s Childcare. 25
Community Development 26
Information Services. 26
Governance Services. 27
Councillor Services. 28
Financial Services. 28
2016-2017
BUDGET. 30
2016-2017
STATEMENT OF REVENUE POLICY. 35
RATING STATEMENT. 35
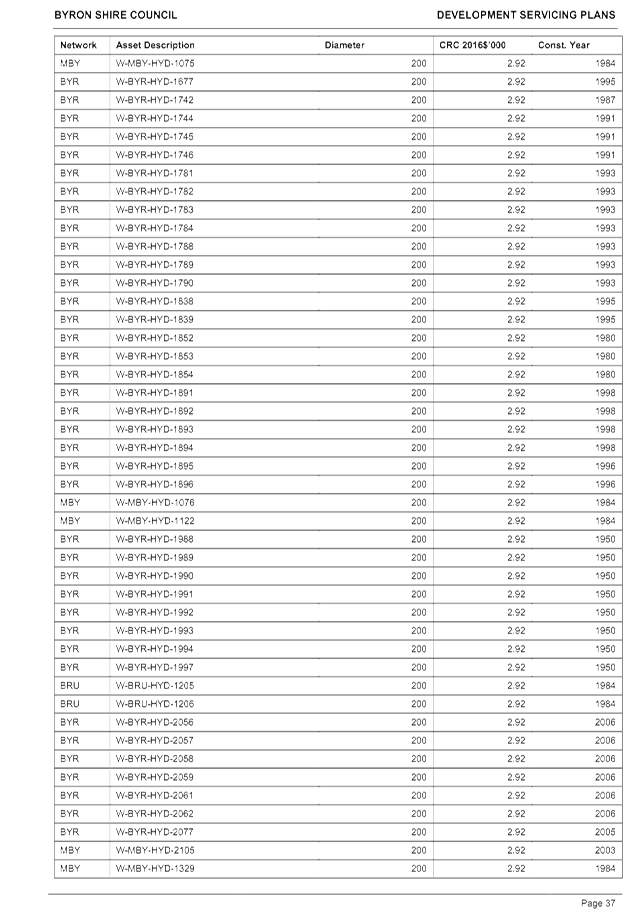
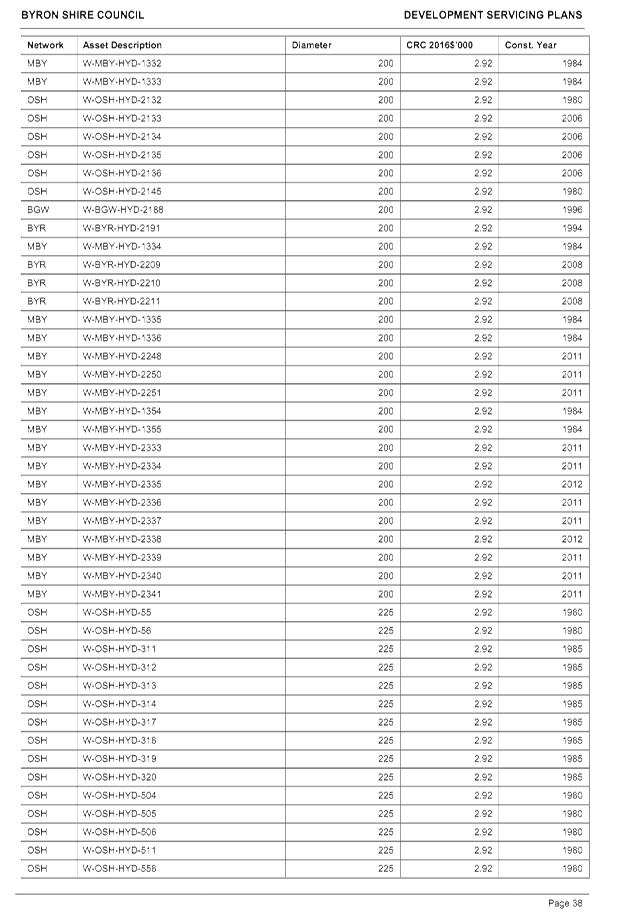
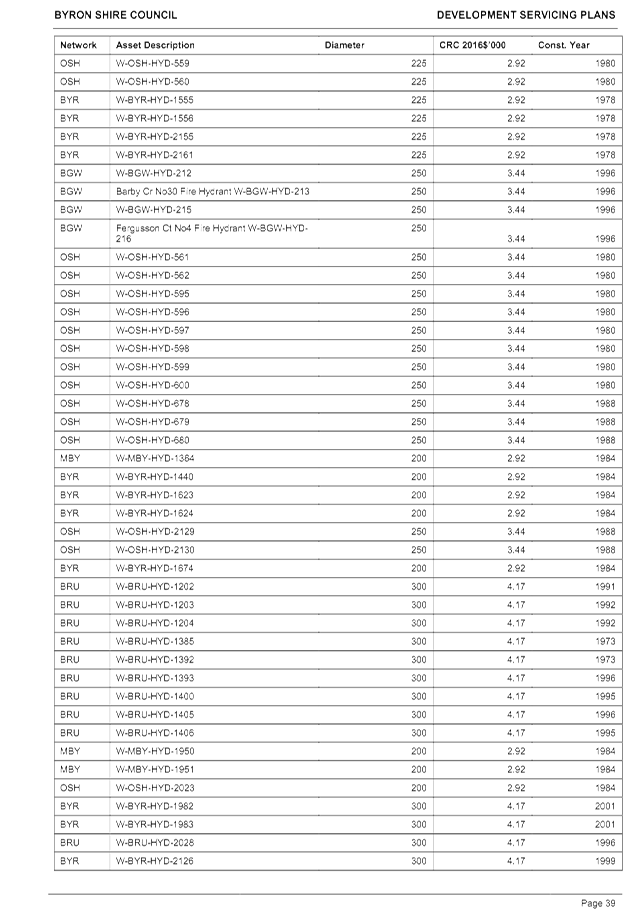
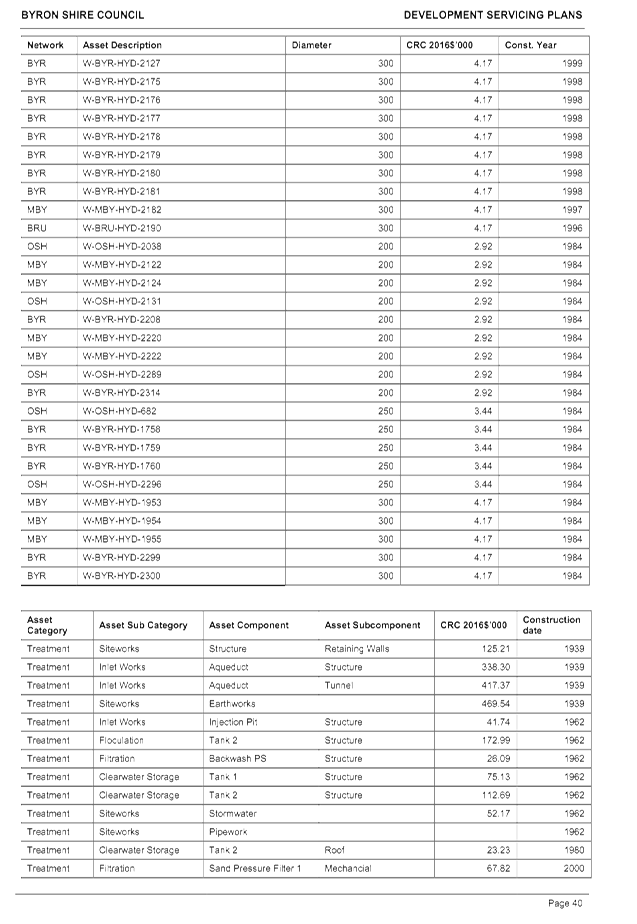
STATEMENT OF ORDINARY RATES TO BE LEVIED.. 37
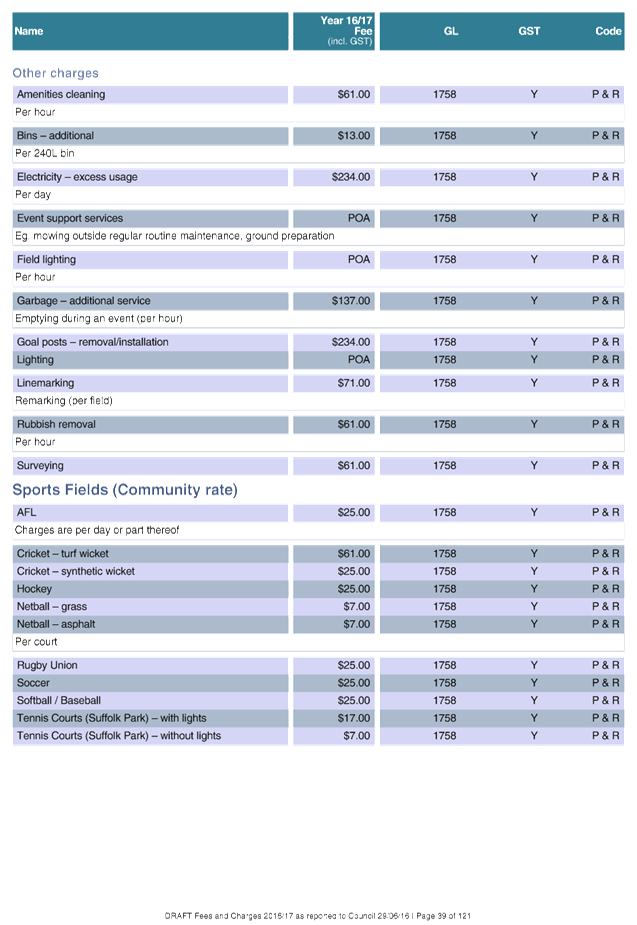
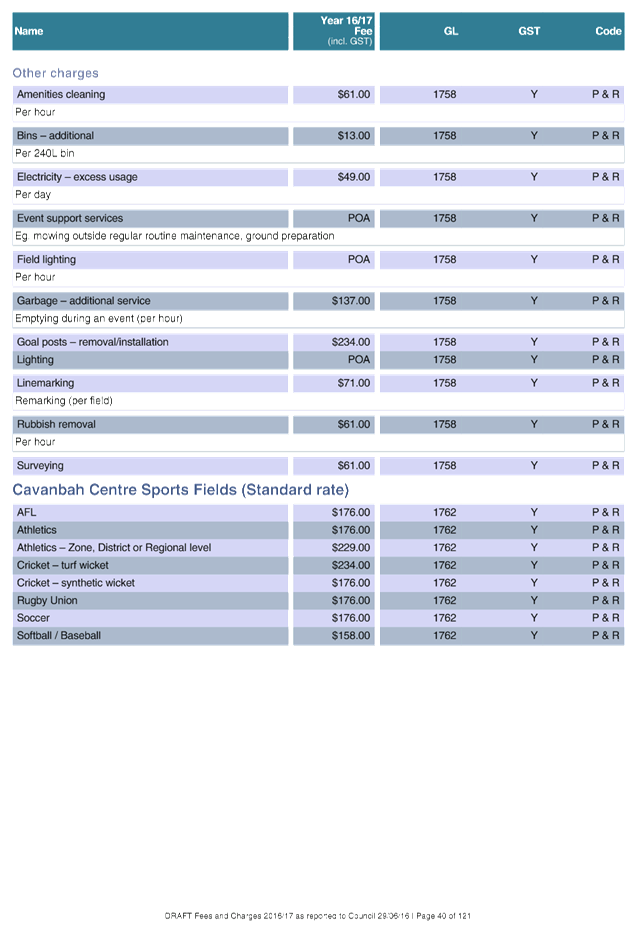
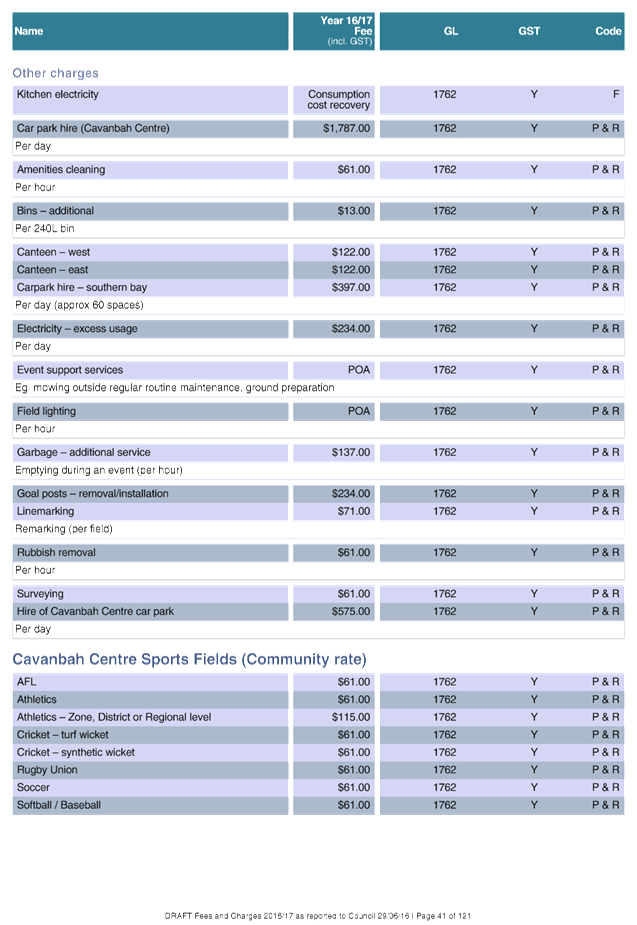
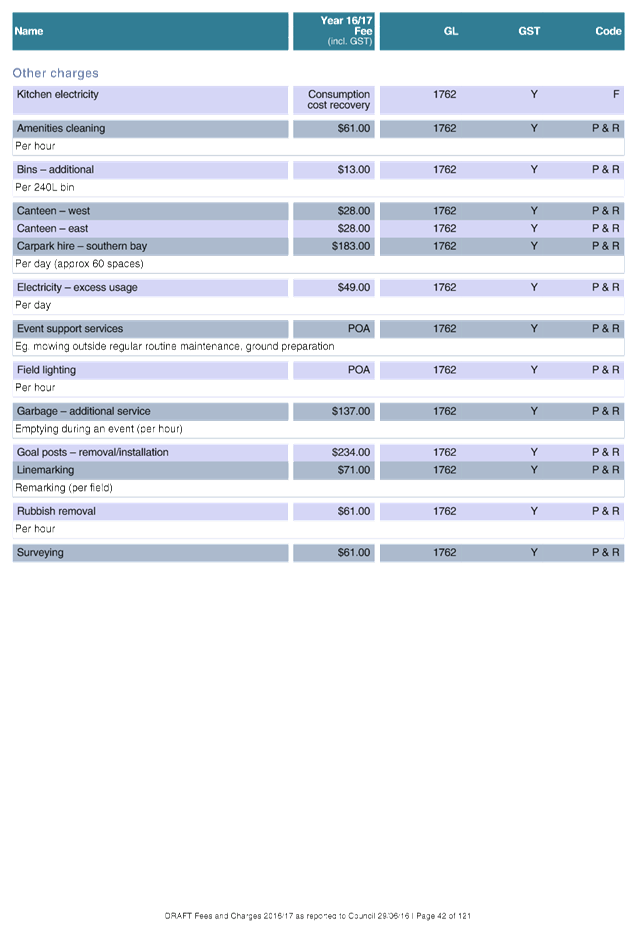
STATEMENT OF CHARGES TO BE LEVIED.. 40
BORROWINGS. 52
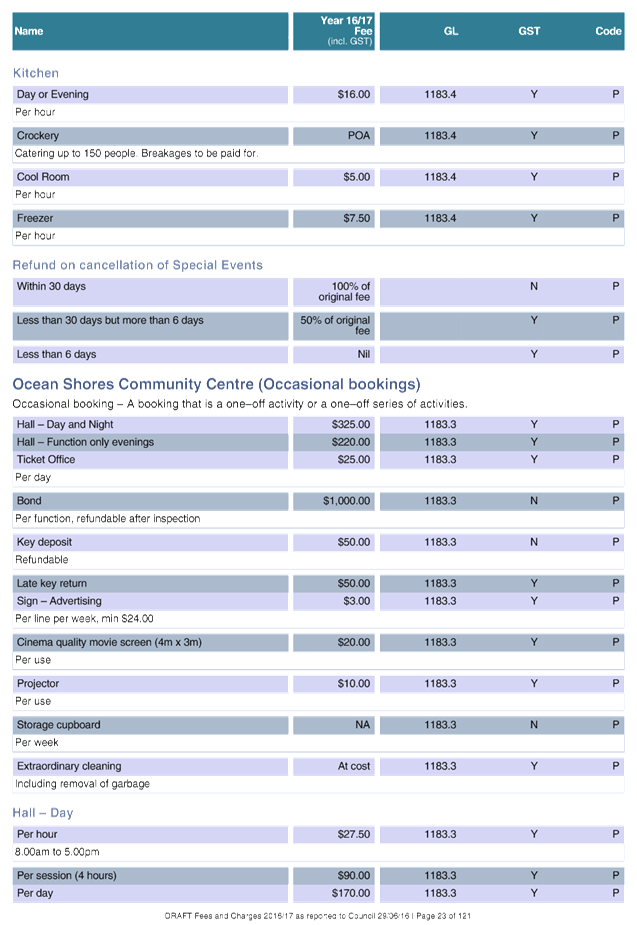
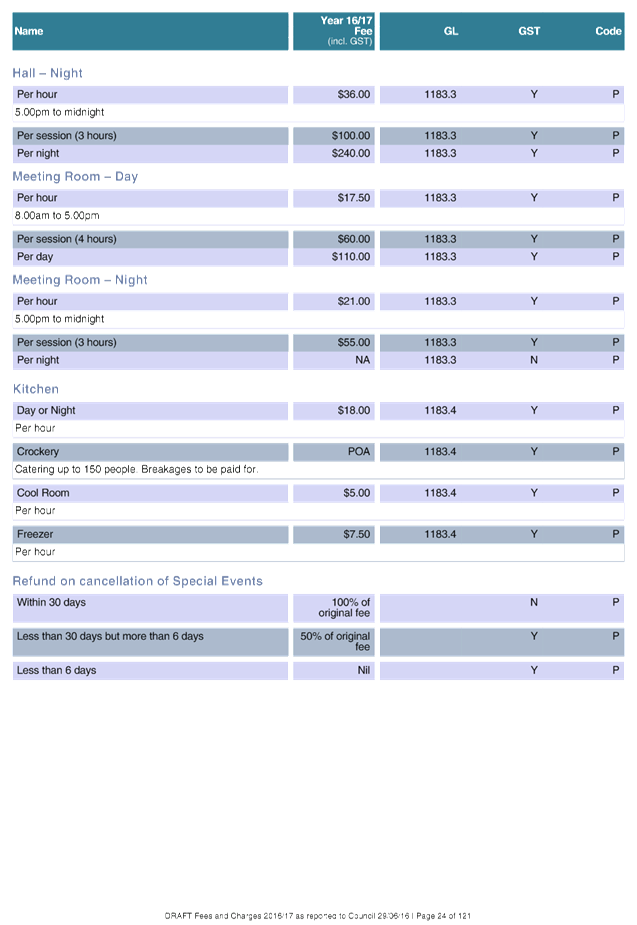
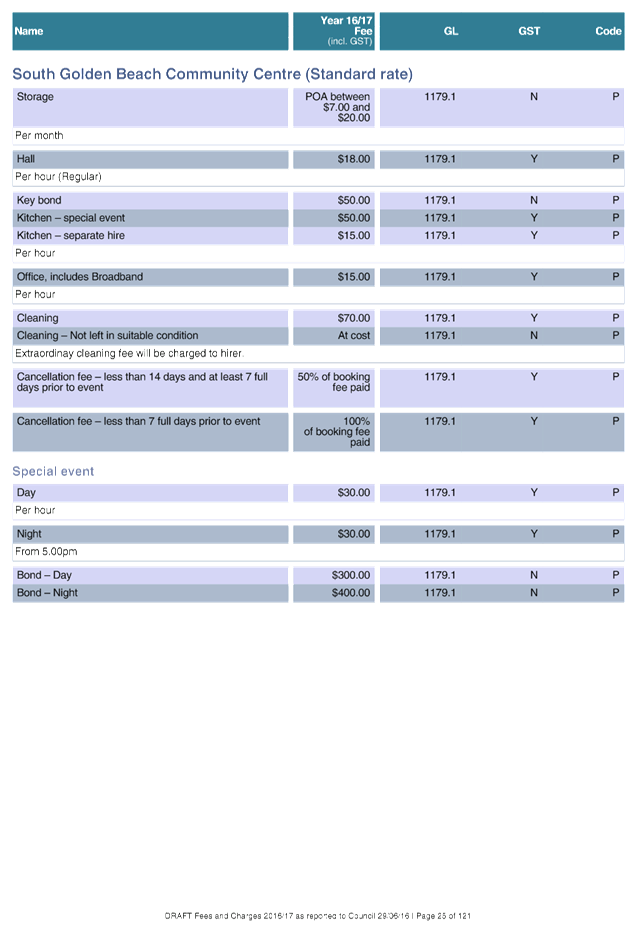
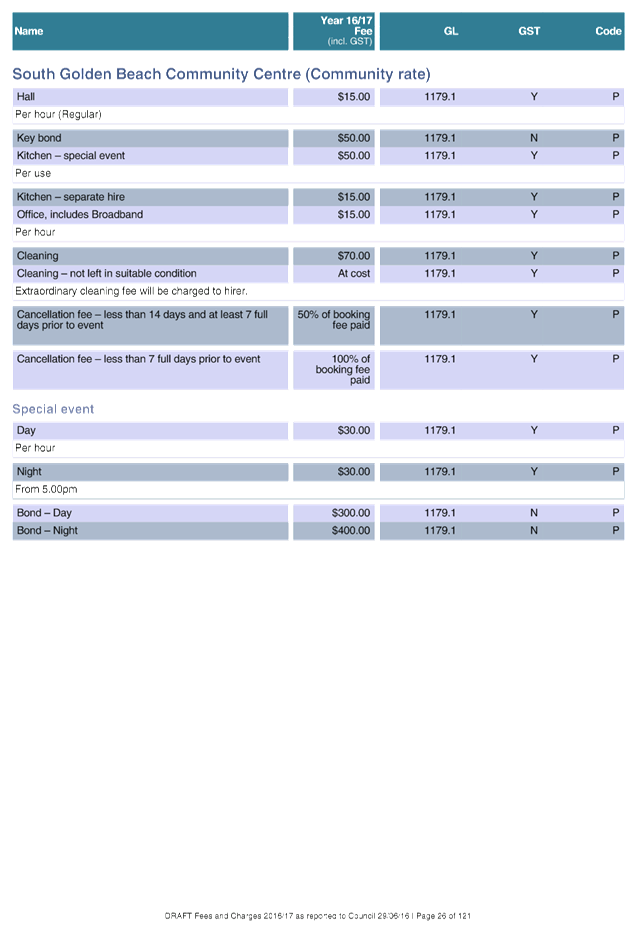
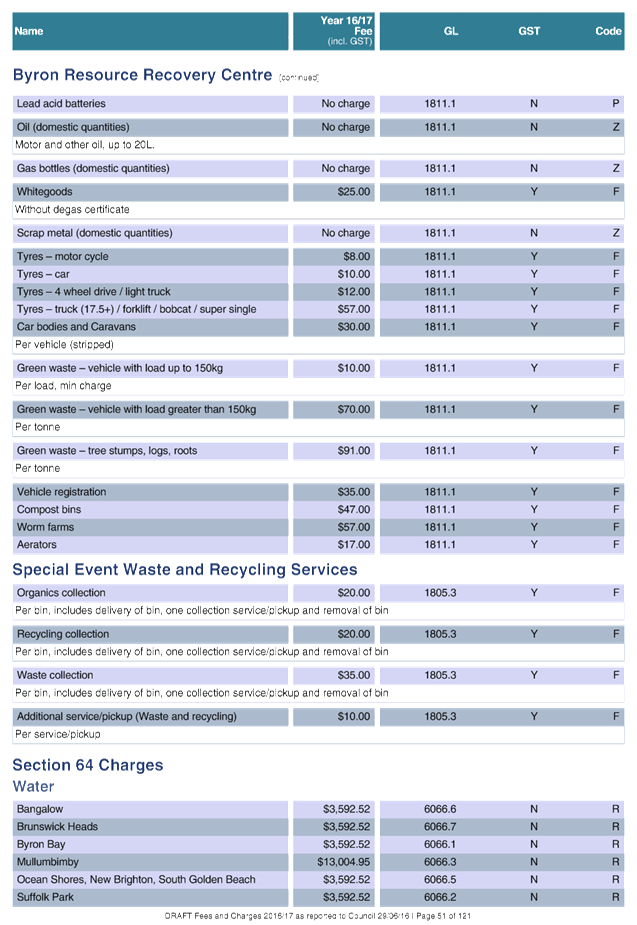
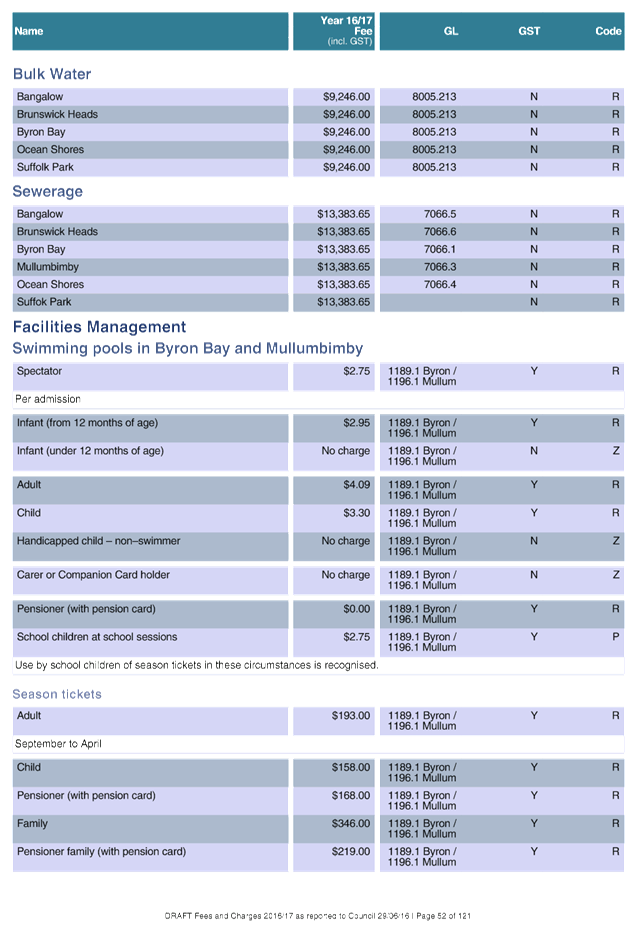
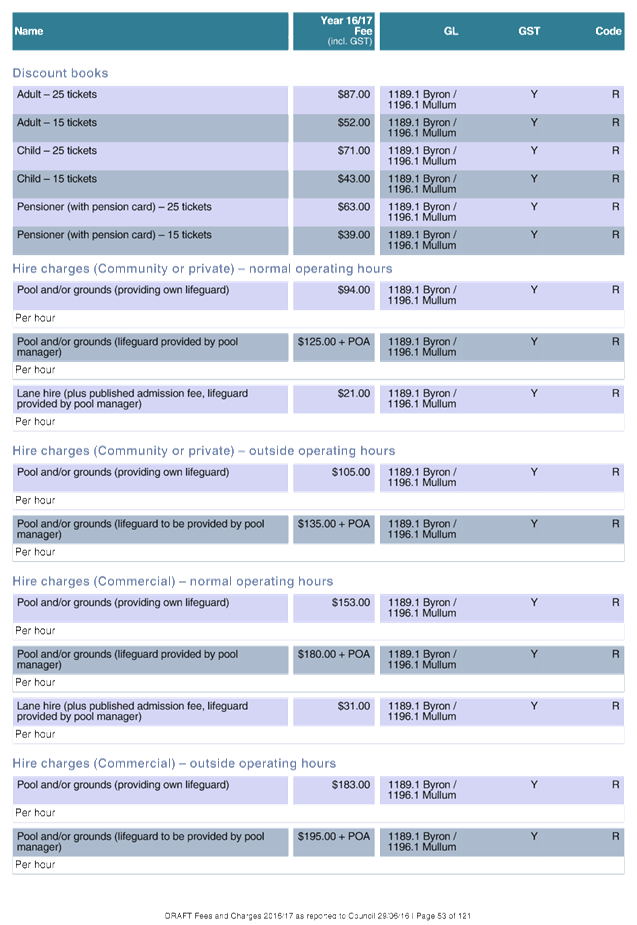
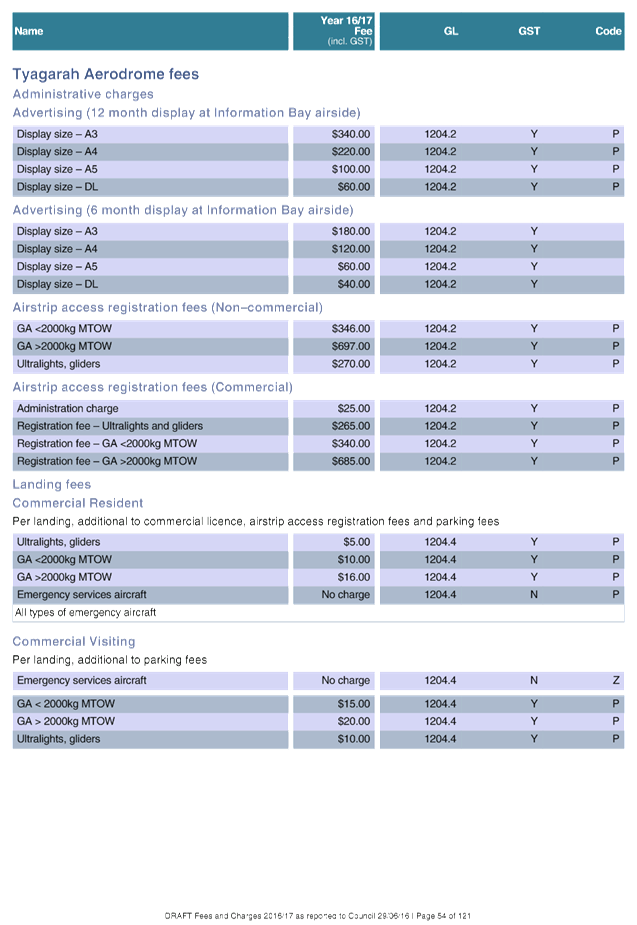
2016-2017 FEES AND CHARGES. 53
APPENDIX
1. 54
COMMUNITY STRATEGIC PLAN, DELIVERY PROGRAM AND OPERATIONAL PLAN
LINKAGES. 54
INTRODUCTION
Welcome to
Byron Shire Council’s Operational Plan 2016 - 2017.
The
Operational Plan 2015 - 2016 is one part of the suite of Byron Shire
Council’s Integrated Planning and Reporting documents. These documents
are linked together by a matrix of actions that details how the
community’s long term aspirations and outcomes will be achieved.
Long Term Byron
Shire Council Community Strategic Plan 2022
(10 years) Developed
in consultation with the Byron Shire community, the long term community
aspirations for the future direction of Byron Shire have been captured as
Community Outcomes within the Community Strategic Plan (CSP). Long Term
Strategies have been included and they outline how the Community Outcomes will
be achieved.
Medium Term Delivery
Program
(4 years) The
four year program details the Key Activities that Council will undertake in
order to work towards achieving the Community Outcomes of the CSP.
Short Term Operational
Plan
(annual) The
Operational Plan lists actions Council will undertake in the coming 12 month
period. The Operational Plan also includes the Statement of Revenue Policy (the
annual budget and fees and charges).
In
addition, this suite of documents is underpinned by Council’s Resourcing
Strategy which consists of a Long Term Financial Plan, Asset Management Plan
and Workforce Plan. These documents outline how Council has considered, in the
medium to long term, the Shire’s finances, assets and workforce to
achieve the Community Strategic Plan outcomes.
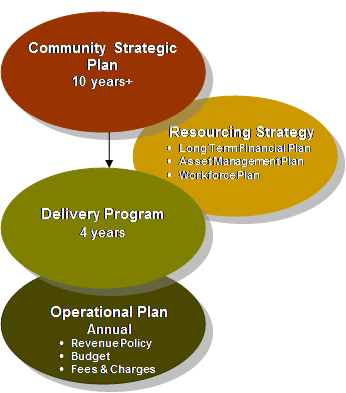
Byron Shire
Council’s Integrated Planning and Reporting Framework is captured in the
diagram below:
Integrated Planning and Reporting
Framework
 4 years
4 years
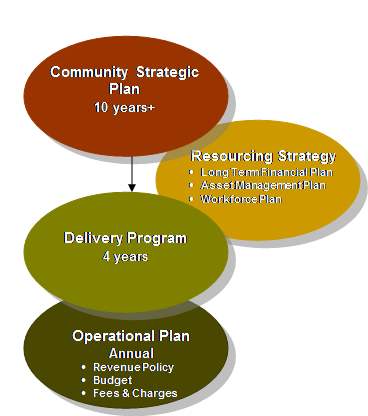
Byron
Shire Council’s integrated planning documents are built around five key
themes - Corporate Management, Economy, Society and Culture, Environment, and
Community Infrastructure.
Each key theme contains several outcomes
which are all underpinned with 17 strategies.
The Operational Plan details the actions
Council will undertake during 2016-2017 to deliver on the long term strategies
contained in the Community Strategic Plan.
COMMUNITY VISION
The
community’s vision is linking together our people, our place and our
purpose - it’s about the future of our whole community.
The
community’s vision is captured in the 10-year Community Strategic Plan
developed collaboratively between the community and Council in 2012.
The vision
defines a sustainable direction for our Shire, and sets out the strategic
direction for our future.
COMMUNITY STRATEGIC
PLAN – STRATEGIES AND OUTCOMES

CM1 Effective
governance, business, project and financial management
CM2 Informed
and engaged community
CM3 Effective
partnerships with all levels of government
CM4 Community
compliance with statutory requirements

EC1 A
diverse economic base and support for local businesses
EC2 A
sustainable tourism industry that respects and promotes our natural environment
and community values
EC3 The
development of a diverse range of arts and creative industries

SC1 Support
communities to achieve equitable access to an appropriate range and level of
whole of life services such as healthcare, education and housing
SC2 Achieve
active participation in local and regional community life
SC3 Respect
and understanding of Aboriginal heritage and wider cultural diversity

EN1 Protect
and enhance the natural environment
EN2 Sustainable
towns, villages and rural settlements that:
a) respect
our natural environment
b) create an
inclusive social environment and
c) integrate
harmoniously with the character of local areas.
EN3 A
low carbon community that integrates:
a) food
security
b) renewable
energy
c) climate
change
d) non-renewable
resource constraints, including peak oil and
e) economic and
social prosperity and resilience

CI1 Planning
for the future
CI2 Provision
of essential services
CI3 Renew
and maintain existing infrastructure
C14 Develop new infrastructure
KEY CAPITAL WORKS HIGHLIGHTS
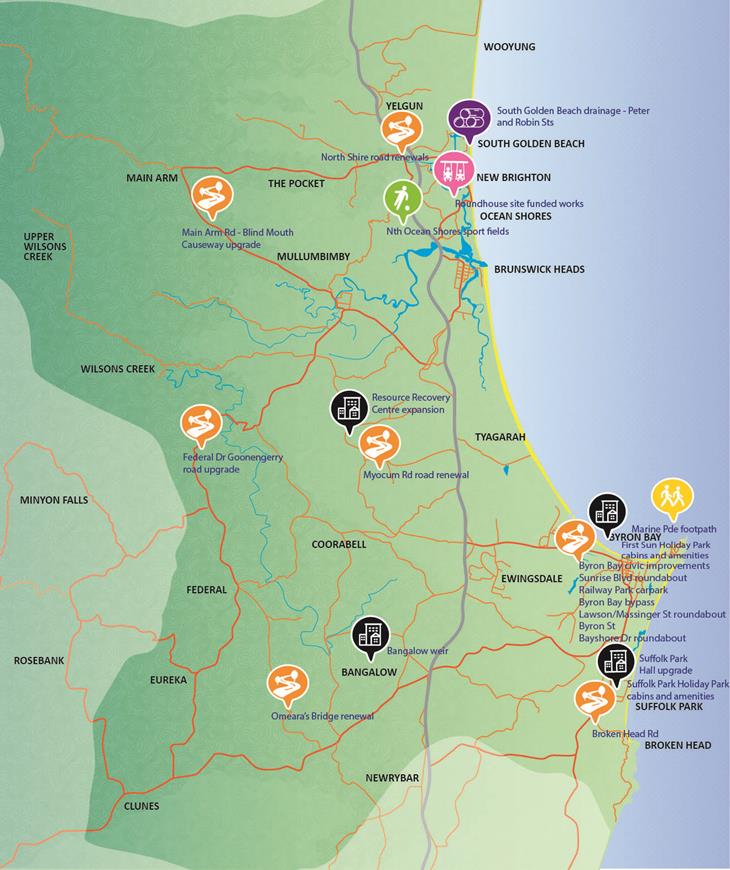
2016-2017 OPERATIONAL PLAN
INFRASTRUCTURE SERVICES
Responsible Executive: Director Infrastructure Services
|
Total Budget:
|
Operating
Revenue
|
Capital
Revenue1
|
Operating
Expenditure
|
Capital
Expenditure2
|
|
$42,615,500
|
$17,191,000
|
$57,512,900
|
$52,124,600
|
1. Capital
Revenue excludes transfers from Reserves.
2. Capital
Expenditure excludes loan principal repayments and transfers to Reserves.
Supervision and Administration
Responsible
Officer: Director
Infrastructure Services
Budget
2016-2017
|
Operating
Revenue
|
Capital Revenue
|
Operating Expenditure
|
Capital Expenditure
|
|
$0
|
$0
|
$178,300
|
$0
|
Actions
2016-2017
|
Action Statement
|
Measures
|
Target
|
Delivery Plan Link
|
|
1
|
Deliver the Operating Maintenance and Capital Works Programs
|
Complete Works
|
90%
|
51
|
|
|
|
|
|
Asset Management Planning
Responsible
Officer: Manager
Major Projects and Asset Management
Budget
2016-2017
|
Operating Revenue
|
Capital Revenue
|
Operating Expenditure
|
Capital Expenditure
|
|
$0
|
$0
|
$121,100
|
$1,353,000
|
Capital
Works Program 2016-2017
|
Capital Item
|
Budget ($)
|
|
Locality:
Various
|
|
|
Lot
12 Bayshore Drive Byron Bay Remediation
|
913,300
|
|
Implement
Station St Mullumbimby Subdivision
|
220,000
|
|
Tyagarah
Airfield Development and Subdivision
|
50,000
|
|
Lot
22 Mullumbimby South Development
|
60,000
|
|
Depot
Relocation
|
10,000
|
|
Surplus
Property Sales
|
100,000
|
Actions
2016-2017
|
Action Statement
|
Measures
|
Target
|
Delivery Plan Link
|
|
2
|
Prepare infrastructure reports for the Financial Statements and
NSW Fit for Future program
|
Reports to Government including the Special Schedule 7 report
|
Completed on time
|
10, 24, 51
|
|
3
|
Develop levels of service for infrastructure to support
investment.
|
Adopted levels of service
|
Mar-17
|
24, 51, 52
|
|
4
|
Progress the outcomes of Asset Management Audits to improve
performance.
|
Scheduled audit outcomes completed
|
Jun-17
|
24, 51, 52
|
|
5
|
Improve the level and integration of asset information to better
assist decision making and focus infrastructure investment.
|
Independently audited databases and systems are assessed as
satisfactory.
|
Jun-17
|
24, 51
|
|
6
|
Revalue water and sewer assets in accordance with the Local
Government Accounting Code
|
Valuations completed
|
Jun-17
|
10, 24, 51
|
|
7
|
Creatively develop new and revised funding strategies for better
community outcomes.
|
Development charging plans continue to reflect community
priorities
|
Jun-17
|
24, 51
|
|
8
|
Actively work with government and industry leaders to improve
asset management performance.
|
Report local, state and federal asset benchmark data within
legislative timeframes, 100%
|
On time
|
10, 16, 18
|
|
9
|
Engage with the community on the challenges of asset management
|
Community Infrastructure Advisory Committee meetings held
quarterly.
|
Jun-17
|
24,51,52
|
Projects and Commercial Development
Responsible Officer: Manager Major Projects and Asset Management
Budget 2016-2017
|
Operating Revenue
|
Capital Revenue
|
Operating Expenditure
|
Capital Expenditure
|
|
$0
|
$0
|
$238,100
|
$0
|
Actions
2016-2017
|
Action Statement
|
Measures
|
Target
|
Delivery Plan Link
|
|
10
|
Develop the Myocum Quarry Transfer Station and Resource Recovery
Centre in line with the waste disposal strategy
|
Preferred option adopted
|
Jun-17
|
16
|
|
11
|
Deliver the Byron Bay Bypass Project which is a two lane road
from Shirley Street in the north to Browning Street in the south
|
Construction completed in accordance with the contract
|
Jun-17
|
50
|
|
12
|
Progress the development of Stage 2 of the Byron Bay Bypass
|
Feasibility assessment completed
|
Jun-17
|
50
|
|
13
|
Progress the replacement of O'Meara's Bridge
|
Adopted solution implemented
|
Jun-17
|
18, 47
|
|
14
|
Complete the sports field and infrastructure on the northern
section of Lot 5 Shara Boulevard
|
Construction completed
|
Sep-16
|
27
|
|
15
|
Progress the future use of the South Byron Sewage Treatment
Plant site and the integrated remediation.
|
Future use determined and implementation progressed.
|
Jun-17
|
24
|
|
16
|
Complete the Brunswick Heads Sewage Treatment Plant site
remediation to secure the site for a potential future use
|
Remediation completed
|
Jun-17
|
24
|
|
17
|
Progress the Mullumbimby Sewage Treatment Plant site remediation
to secure the site for a potential future use
|
Detailed remediation plan completed
|
Jun-17
|
24
|
|
18
|
Complete the remediation of Lot 12 Bayshore Drive Byron Bay and
implement the adopted future use.
|
Remediation completed, future use determined and progressed.
|
Jun-17
|
24
|
|
19
|
Complete the Station Street Mullumbimby subdivision project to
provide funds for important community initiatives
|
Subdivision completed
|
Dec-16
|
24
|
|
20
|
Progress the Tyagarah subdivision to provide funds for important
community initiatives
|
Rezoning completed
|
Jun-17
|
24
|
|
21
|
Progress Lot 22 Mullumbimby South development to establish a
future use that best serves the needs of the community
|
Future use adopted
|
Jun-17
|
24
|
|
22
|
Progress Valances Road Mullumbimby development
|
Implement the outcome of the Rural Land Use Strategy
|
Jun-17
|
24
|
|
23
|
Progress Lot 4 Mullumbimby development project
|
Implement the outcome of the Rural Land Use Strategy
|
Jun-17
|
24
|
|
24
|
Implement the Fletcher Street Byron Bay property development to
provide a long term source of funds for the community
|
Implement the adopted future use
|
Jun-17
|
24
|
|
25
|
Progress the evaluation of alternative sites for the Bayshore
Drive Works Depot
|
Assessment completed
|
Jun-17
|
24
|
|
26
|
Complete Lot 16 Dingo Lane Myocum property sale with a view to
repaying loans
|
Sale completed
|
Dec-16
|
24
|
|
27
|
Progress the implementation of adopted Byron Bay Town Centre
Master plan works
|
Works progressed
|
Jun-17
|
39, 40
|
|
28
|
Complete the Suffolk Park Hall Upgrade
|
Works completed
|
Jun-17
|
47
|
Emergency Services and Floods
Responsible
Officer: Manager
Works
Budget
2016-2017
|
Operating Revenue
|
Capital Revenue
|
Operating Expenditure
|
Capital Expenditure
|
|
$226,300
|
$0
|
$831,300
|
$0
|
Actions
2016-2017
|
Action Statement
|
Measures
|
Target
|
Delivery Plan Link
|
|
29
|
Emergency Management
|
Plan
LEMC Meetings
|
Complete, 30/06/2017
Attended, as Scheduled
|
53
|
|
30
|
Flood Risk Management Study and Plan for North Byron
|
Plan, adopted
|
30-Jun-17
|
53
|
Depot and Fleet Management
Responsible
Officer: Manager
Works
Budget 2016-2017
|
Operating Revenue
|
Capital Revenue
|
Operating Expenditure
|
Capital Expenditure
|
|
$554,900
|
$0
|
$752,300
|
$1,042,000
|
Capital
Works Program 2016-2017
|
Capital Item
|
Budget ($)
|
|
Plant
and Equipment
|
|
|
4x2
16,000 kg GVM TIPPER with weighing system
|
85,000
|
|
Sweeper
/ Truck
|
300,000
|
|
Ride
on Mechanical Street Sweeper
|
110,000
|
|
Small
Plant Replacements
|
47,000
|
|
Motor
Vehicle Replacements
|
500,000
|
Actions
2016-2017
|
Action Statement
|
Measures
|
Target
|
Delivery Plan Link
|
|
31
|
Improve utilisation of heavy and light fleet
|
Utilisation report for previous financial year
|
Completed,
30-Oct-16
|
51
|
|
|
|
|
|
Local Roads and Drainage
Responsible
Officer: Manager
Works
Budget
2016-2017
|
Operating Revenue
|
Capital Revenue
|
Operating Expenditure
|
Capital Expenditure
|
|
$2,964,300
|
$14,555,000
|
$12,496,700
|
$27,107,400
|
Capital
Works Program 2016-2017
|
Capital Item
|
Budget ($)
|
|
Carparking
|
|
|
Locality:
Byron Bay
|
|
|
Lawson
St South Carpark - extension of carpark to Railway Park
|
210,000
|
|
Locality:
Various
|
|
|
Parking
Studies for Bangalow, Brunswick Heads and Mullumbimby
|
35,000
|
|
Road
Pavement Renewals
|
|
|
Locality: Rural North
|
|
|
Myocum Rd Segment 545.10 CH0.6-1.04km
|
600,000
|
|
Myocum Road
|
400,000
|
|
Bridges
|
|
|
Locality: Rural North
|
|
|
Main Arm Road - Blind Mouth causeway upgrade - construction
|
780,100
|
|
Locality: Byron Bay
|
|
|
Belongil Creek Bridge Works
|
|
|
Locality: Various
|
|
|
Bridge works subject to future bridge inspections
|
184,100
|
|
Locality: Rural South
|
|
|
O'Meara's Bridge Renewal
|
350,000
|
|
James Bridge Renewal
|
85,000
|
|
Footpaths/Kerb and Gutter Works
|
|
|
Locality: Various
|
|
|
Access ramps and footpaths Works
|
65,600
|
|
Replacement of damaged Kerb and Gutter Shire Wide as per
inspection Report
|
22,500
|
|
Replacement of damaged Footpaths Shire Wide as per inspection
Report
|
90,000
|
|
Locality: Byron Bay
|
|
|
Marine Parade Footpath at Wategos
|
395,000
|
|
Marvel St, Byron Bay - northern side Tennyson St to Middleton St
|
60,000
|
|
Locality: Bangalow
|
|
|
Leslie Street to Station St, Bangalow - footpath and stairs /
ramps across railway line
|
20,000
|
|
Locality: Ocean Shores
|
|
|
Rajah Road/Orana Road, Ocean Shores – Shopping Centre to
Wirree Drive
|
30,000
|
|
Drainage
|
|
|
Locality: Byron Bay
|
|
|
Burns Street Open Drain Maintenance
|
1,000
|
|
Lilly Pilly Drain Maintenance (use Levy as this funded the
wetland)
|
1,000
|
|
Bangalow Road - resolve stormwater flooding of backyard
|
50,000
|
|
Bay lane overland flow path and system application
|
10,000
|
|
Locality: Ocean Shores
|
|
|
South Golden Beach Street Drainage Upgrade - Peter Street
|
203,000
|
|
South Golden Beach Street Drainage Upgrade - Robin Street
|
179,000
|
|
South Golden Beach Street Drainage Upgrade - Helen Street (east)
|
15,000
|
|
South Golden Beach Street Drainage
Upgrade
|
15,000
|
|
Locality: Mullumbimby
|
|
|
8 Jubilee Ave - resolve flooding in front yard and nature strip
|
10,000
|
|
Locality: Brunswick Heads
|
|
|
Massey Green Caravan Park Stormwater infrastructure renewal
|
15,000
|
|
Locality: Bangalow
|
|
|
Bangalow Wetland Maintenance
|
2,000
|
|
Leslie Street - prevent flooding under house
|
55,000
|
|
Locality: Various
|
|
|
Minor urgent works
|
10,000
|
|
Reseal/Renewal Program
|
|
|
Locality: Various
|
|
|
Shire-wide Road Reseal Program
|
|
|
Goonengerry Road
|
209,200
|
|
Eureka Road
|
211,900
|
|
Coolamon Scenic Drive (South)
|
137,000
|
|
Broken Head Reserve Road
|
91,900
|
|
Rural Roads Program
|
|
|
Federal Drive, Goonengerry, pavement upgrade
|
730,000
|
|
Locality: Rural North
|
|
|
Grays Lane, Tyagarah, pavement upgrade
|
50,000
|
|
Settlement Rd
|
30,000
|
|
Coolamon Scenic Drive - Land Acquisition
|
100,000
|
|
Locality: Rural South
|
|
|
Rifle Range Road Intersection Upgrade at Lismore Road
|
54,800
|
|
Broken Head Road
|
600,000
|
|
Urban Roads Program
|
|
|
Locality: Byron Bay
|
|
|
Byron Bay Bypass
|
11,950,000
|
|
Lawson/Massinger Street, Byron Bay, roundabout and drainage and
kerb & gutter
|
1,131,900
|
|
Byron Bay Bypass Stage 2 investigations
|
250,000
|
|
Byron St
|
645,000
|
|
Locality: Ocean Shores
|
|
|
Beach Avenue, South Golden Beach
|
307,200
|
|
The Esplanade, New Brighton
|
216,000
|
|
Orana Road, Ocean Shores
|
1,040,000
|
|
River Street, New Brighton
|
466,800
|
|
Coomburra Crescent, Ocean Shores
|
658,800
|
|
Orana Road Ocean Shores
|
133,600
|
|
Locality: Suffolk Park
|
|
|
Clifford Street intersection with Broken Head Road, Suffolk
Park, traffic control upgrade*
|
1,400,000
|
|
Locality: Byron Bay
|
|
|
Bayshore and Ewingsdale Roundabout*
|
2,700,000
|
|
Parking Implementation
|
100,000
|
*subject
to securing grant funding
Actions
2016-2017
|
Action Statement
|
Measures
|
Target
|
Delivery Plan Link
|
|
32
|
Improve the condition of local road and drainage assets by
undertaking renewal, upgrade, enhancement and new projects
|
Capital Works Program
|
Complete, 100%
|
51
|
|
|
|
|
|
Roads and Maritime Services
Responsible
Officer: Manager
Works
Budget
2016-2017
|
Operating Revenue
|
Capital Revenue
|
Operating Expenditure
|
Capital Expenditure
|
|
$659,800
|
$311,000
|
$1,005,900
|
$371,000
|
Capital
Works Program 2016-2017
|
Capital Item
|
Budget ($)
|
|
Locality: Various
|
|
|
Regional REPAIR Program
Broken Head Rd 763 - pavement reconstruction 5045m south of
Clifford St - approximately 400m long
|
311,000
|
|
Ewingsdale Road
|
60,000
|
Actions
2016-2017
|
Action Statement
|
Measures
|
Target
|
Delivery Plan Link
|
|
33
|
Maintain access to Regional Road Block Grant funds
|
Annual Regional Road Return
|
Complete
|
17, 18, 48
|
|
34
|
Maintain access to Regional Road REPAIR Program grants
|
Grant applications
|
Submitted
|
17, 18, 48
|
Quarries
Responsible
Officer: Manager
Works
Budget
2016-2017
|
Operating Revenue
|
Capital Revenue
|
Operating Expenditure
|
Capital Expenditure
|
|
$338,700
|
$0
|
$353,700
|
$0
|
Actions
2016-2017
|
Action Statement
|
Measures
|
Target
|
Delivery Plan Link
|
|
35
|
Completion of all mandatory returns to NSW State Government
departments
|
Submission of annual material
production quantities.
Submission of annual environmental testing results
|
By due dates
By due dates
|
3.21
|
|
|
|
|
|
Open Space and Recreation
Responsible
Officer: Manager
Open Spaces and Resource Recovery
Budget
2016-2017
|
Operating Revenue
|
Capital Revenue
|
Operating Expenditure
|
Capital Expenditure
|
|
$833,900
|
$325,000
|
$5,571,100
|
$2,501,700
|
Capital
Works Program 2016-2017
|
Capital Item
|
Budget ($)
|
|
Locality:
Byron Bay
|
|
|
Civic Improvements Byron Bay Town Centre
|
450,000
|
|
Byron Bay Town Centre Upgrade - Landscape/Precinct Plan
|
53,000
|
|
Upgrade Pathway lights from Apex Park to Clarkes Beach
|
60,000
|
|
Belongil Beach Access Upgrade
|
20,000
|
|
Apex Park Upgrade (Sprinklers and Turf Management)
|
50,000
|
|
Locality: Mullumbimby
|
|
|
Pine Ave sports ground Play equipment and shade sail
|
47,000
|
|
Pine Avenue Soccer Fields - replace fencing
|
30,000
|
|
Heritage Park upgrade
|
57,000
|
|
Heritage Park boat ramp upgrade
|
30,000
|
|
Locality: Brunswick Heads
|
|
|
Brunswick Heads Recreation Ground 6 Bay Storage Shed adjacent to
Carpark
|
37,000
|
|
Brunswick Heads Recreation Ground Carpark Reconstruction
|
5,000
|
|
South Beach Tennis Court
|
26,000
|
|
Sports Ground Storage Sheds*
|
100,000
|
|
Locality: Bangalow
|
|
|
Solar lighting around walking track
|
5,000
|
|
Bangalow Railway Park site rationalisation
|
30,000
|
|
Sports field electrical upgrades
|
25,000
|
|
Bangalow Weir
|
176,000
|
|
Locality: Ocean Shores
|
|
|
Fern Beach Play unit & sail
|
41,000
|
|
Installation of 2 x Grandstands at Tom Kendall Oval
|
8,000
|
|
Shara Boulevard Sports Fields Development
|
733,000
|
|
Revised Plan of Management - all sporting fields shire wide
|
15,000
|
|
Outdoor Exercise Equipment
|
105,000
|
|
North Shire Works Funded from Roundhouse
|
332,700
|
|
Locality: Various
|
|
|
Public Bubblers
|
40,000
|
|
Federal Tennis Court Surface Replacement
|
26,000
|
*subject
to securing grant funding
Actions
2016-2017
|
Action Statement
|
Measures
|
Target
|
Delivery Plan Link
|
|
36
|
Improve amenity of iconic open space
|
Level of Service Maintenance Plans for all parks that have LOS
of 1
|
Developed and Implemented
|
40
|
|
37
|
Improve amenity of town centres
|
Landscape plans for all towns and village main streets
Level of Service Maintenance Plans
|
Developed and Implemented
Developed and Implemented
|
40
|
|
38
|
Promote volunteerism through beautify day events across the
shire
|
Beautify days delivered
|
4
|
40
|
The Cavanbah Centre
Responsible
Officer: Manager
Open Spaces and Resource Recovery
Budget
2016-2017
|
Operating Revenue
|
Capital Revenue
|
Operating Expenditure
|
Capital Expenditure
|
|
$328,800
|
$0
|
$837,900
|
$50,000
|
Capital
Works Program 2016-2017
|
Capital Item
|
Budget ($)
|
|
Locality:
Byron Bay
|
|
|
Market
Infrastructure
|
35,000
|
|
Floor
Tiles
|
15,000
|
Actions
2016-2017
|
Action Statement
|
Measures
|
Target
|
Delivery Plan Link
|
|
39
|
Deliver Capital Work Program
|
Works Program
|
Completed, 90%
|
35
|
|
40
|
Maximise utilisation and sustainability of facility
|
Income Sources
Income
|
Increased
Increased
|
35
|
Waste and Recycling Services
Responsible
Officer: Manager
Open Spaces and Resource Recovery
Budget
2016-2017
|
Operating Revenue
|
Capital Revenue
|
Operating Expenditure
|
Capital Expenditure
|
|
$7,275,100
|
$0
|
$6,493,200
|
$538,500
|
Capital
Works Program 2016-2017
|
Capital Item
|
Budget ($)
|
|
Locality: Rural North
|
|
|
BWRF - EPS Recycling
|
40,000
|
|
BWRF - Cardboard Recycling
|
45,000
|
|
BWRF - Resource Recovery Centre Master Plan
|
82,000
|
|
BWRF -Public Place Recycling Enclosures
|
30,000
|
|
Minor Capital
|
50,000
|
|
Resource Recovery Centre Rehabilitation - Leachate System
|
80,000
|
|
Resource Recovery Centre Upgraded Expansion
|
150,000
|
|
Development of New Landfill Capacity
|
13,400
|
|
WASIP – Sustainable leachate Management
|
48,100
|
Actions
2016-2017
|
Action Statement
|
Measures
|
Target
|
Delivery Plan Link
|
|
41
|
Maintain Contract Management Plan for Waste and Resource
Recovery Collection Contract 2014-0011
|
Contractor KPIs
|
KPIs achieved
|
46, 56
|
|
42
|
Maintain compliance with the Federal Government’s
Emissions Reduction Fund contract conditions for the Myocum Landfill Gas
Carbon Farming Initiative Project
|
Compliance
|
Required allocation of ACCUs delivered
|
22, 45
|
|
43
|
Implement Revised Waste Disposal Strategy
|
Implementation
|
Yr 1 strategy objectives complete
|
16, 46, 55, 56
|
|
44
|
Implement Revised Resource Recovery Management Strategy
|
Implementation
|
Yr 1 strategy objectives complete
|
16, 46, 55, 56
|
|
45
|
Implement Revised Resource Recovery Education Plan
|
Implementation
|
Yr 1 plan objectives complete
|
16, 46, 55, 56
|
|
46
|
Continue membership and participation in North East Waste
regional waste management programs and initiatives
|
Participation
|
Maintained
|
16, 46, 55, 56
|
First Sun Holiday Park
Responsible
Officer: Manager
Open Spaces and Resource Recovery
Budget
2016-2017
|
Operating Revenue
|
Capital Revenue
|
Operating Expenditure
|
Capital Expenditure
|
|
$2,994,200
|
$0
|
$2,483,000
|
$672,000
|
Capital
Works Program 2016-2017
|
Capital Item
|
Budget ($)
|
|
Locality: Byron Bay
|
|
|
Cabins
|
200,000
|
|
Lodgings
|
60,000
|
|
Safari
Tents
|
50,000
|
|
BBQs,
Signs, Minor works
|
75,000
|
|
Amenities/Camp
Kitchen Refurbishment
|
230,000
|
|
Laundry
Refurbishment
|
50,000
|
|
Turf
Upgrade Management
|
7,000
|
Actions
2016-2017
|
Action Statement
|
Measures
|
Target
|
Delivery Plan Link
|
|
47
|
Increase
accommodation facilities and upgrade amenities to ensure public satisfaction
of guests and economic benefit to Byron Shire.
|
Revenue
|
Increase
|
31
|
|
|
|
|
|
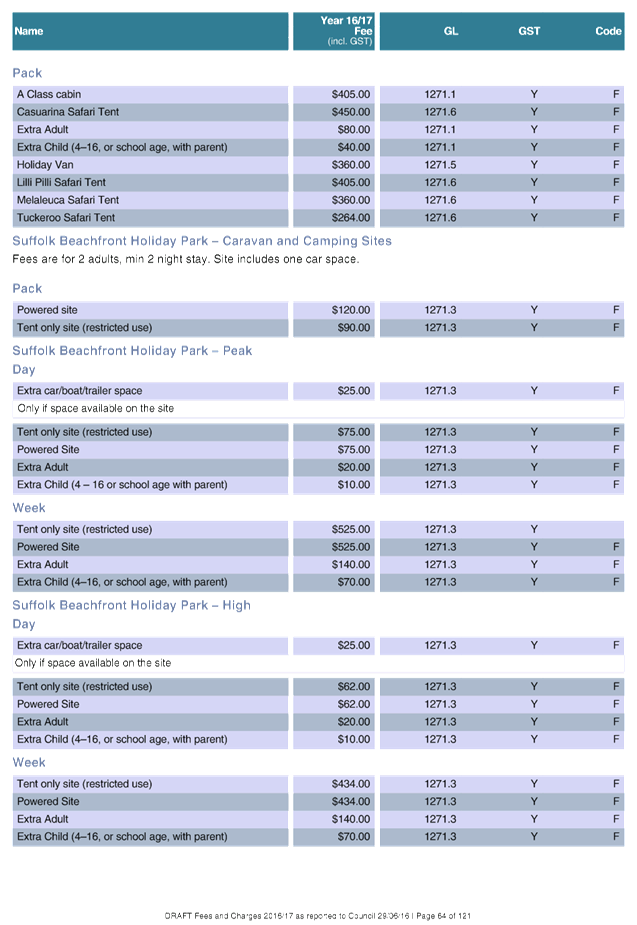
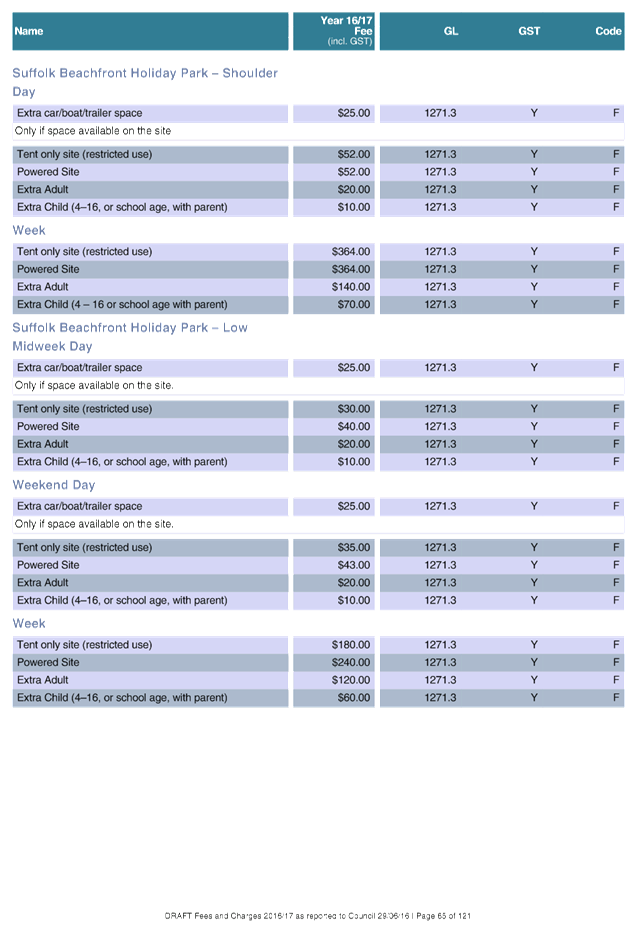
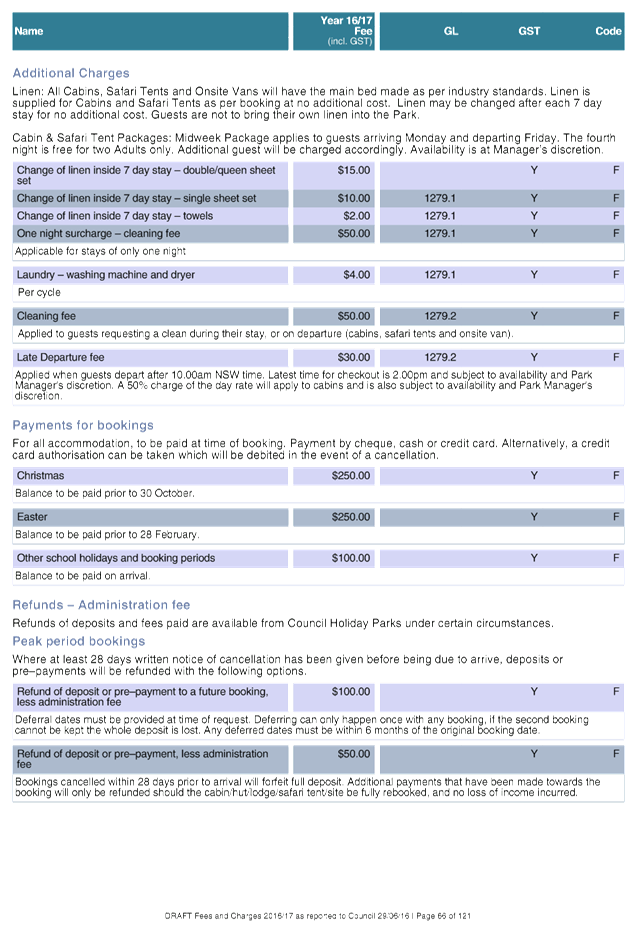
Suffolk Beachfront Holiday Park
Responsible
Officer: Manager
Open Spaces and Resource Recovery
Budget
2016-2017
|
Operating Revenue
|
Capital Revenue
|
Operating Expenditure
|
Capital Expenditure
|
|
$925,900
|
$0
|
$947,300
|
$990,000
|
Capital
Works Program 2016-2017
|
Capital Item
|
Budget ($)
|
|
Locality: Suffolk Park
|
|
|
Cabins
|
540,000
|
|
Safari
Tents
|
50,000
|
|
Amenities
Block Replacement
|
350,000
|
|
BBQs,
Signs, Minor works
|
50,000
|
Actions
2016-2017
|
Action Statement
|
Measures
|
Target
|
Delivery Plan Link
|
|
48
|
Increase
accommodation facilities and upgrade amenities to ensure public satisfaction
of guests and economic benefit to Byron Shire.
|
Revenue
|
Increase
|
31
|
|
|
|
|
|
Facilities Management
Responsible
Officer: Manager
Utilities
Budget
2016-2017
|
Operating Revenue
|
Capital Revenue
|
Operating Expenditure
|
Capital Expenditure
|
|
$963,700
|
$0
|
$2,729,400
|
$658,100
|
Capital
Works Program 2016-2017
|
Capital Item
|
Budget ($)
|
|
Locality:
Byron Bay
|
|
|
Byron
Bay Pool Improvements
|
70,200
|
|
Railway Park Toilet Block Refurbishment
|
50,000
|
|
Byron
Bay Library
|
50,000
|
|
Locality:
Mullumbimby
|
|
|
Mullumbimby
Pool Improvements
|
21,600
|
|
Mullumbimby
Administration Centre – minor capital works program
|
31,600
|
|
Mullumbimby
Administration Centre - Carpet Replacement Program
|
53,400
|
|
Mullumbimby
Administration Centre - Chambers Air conditioning upgrade contribution
|
20,000
|
|
Locality:
Suffolk Park
|
|
|
Suffolk
Park Hall Upgrade
|
300,000
|
|
Locality:
Various
|
|
|
Public
Toilet Special Rate Variations – Renewal Program
|
61,300
|
Actions
2016-2017
|
Action Statement
|
Measures
|
Target
|
Delivery Plan Link
|
|
49
|
Deliver Capital Work Program
|
Works Program
|
Completed 90%
|
22, 34, 40
|
|
|
|
|
|
Water Supplies
Responsible
Officer: Manager
Utilities
Budget
2016-2017
|
Operating Revenue
|
Capital Revenue
|
Operating Expenditure
|
Capital Expenditure
|
|
$9,075,400
|
$600,000
|
$8,361,100
|
$9,324,900
|
Capital
Works Program 2016-2017
|
Capital Item
|
Budget ($)
|
|
Locality: Bangalow
|
|
|
Bangalow
Reservoir Construction
|
571,400
|
|
Locality:
Brunswick Heads
|
|
|
Miscellaneous
Reservoir Renewals
|
30,000
|
|
Locality:
Mullumbimby
|
|
|
Argyle
Street South Side Water main Renewal
|
30,000
|
|
Mullumbimby
- Tincogan St Capacity Upgrade
|
300,000
|
|
Locality:
Ocean Shores
|
|
|
North/South
Ocean Shores Fire Main Upgrade
|
1,923,000
|
|
South
Ocean Shores Fire Main Upgrade
|
700,000
|
|
Reservoir
Renewals
|
155,900
|
|
Locality:
Byron Bay
|
|
|
Coopers
Shoot Reservoir - Additional Storage/Land Purchase
|
4,234,600
|
|
Miscellaneous
Reservoir Renewals
|
155,000
|
|
South
Byron pipelines capacity upgrade
|
200,000
|
|
Recycled
Waste Water from West Byron to Byron Foreshore res 15-616
|
525,000
|
|
Fletcher
Street Development Planning
|
250,000
|
|
Locality:
Various
|
|
|
Demand
Management
|
20,000
|
|
Miscellaneous
Extensions Water Reticulation System
|
200,000
|
|
Meter
Replacement Program
|
30,000
|
Actions
2016-2017
|
Action Statement
|
Measures
|
Target
|
Delivery Plan Link
|
|
50
|
Upgrade of fire main capacity Ocean Shores
|
Pipeline design and construction complete
|
Jun-17
|
16, 20
|
|
51
|
Drought Management planning
|
Complete Regional plan and align Mullumbimby Plan
|
Jun-17
|
16, 20
|
|
52
|
Develop agreements for community art to be incorporated into
asset maintenance
|
Number of art on water assets increased
|
Jun-17
|
29, 37
|
Sewerage Services
Responsible
Officer: Manager
Utilities
Budget
2016-2017
|
Operating Revenue
|
Capital Revenue
|
Operating Expenditure
|
Capital Expenditure
|
|
$15,474,500
|
$1,400,000
|
$14,112,500
|
$7,516,000
|
Capital
Works Program 2016-2017
|
Capital Item
|
Budget ($)
|
|
Locality:
Bangalow
|
|
|
Bangalow
- Pump Station Renewals
|
206,000
|
|
Pipe
Renewals / Upgrades (Moved $50,000 Reserve funds $50,000 S64
funds from 2015/16 December Review)
|
306,000
|
|
Locality:
Byron Bay
|
|
|
STP
Upgrade
|
500,000
|
|
South
Byron STP Redevelopment/ Remediation
|
100,000
|
|
South
Byron STP Demolition/Removal
|
250,000
|
|
Recycled
Waste Water from West Byron to Byron Foreshore Res 15-616
|
525,000
|
|
Locality:
Brunswick Heads
|
|
|
Vallances
Rd Subdivision
|
130,000
|
|
Vallances
Rd nursery demolition
|
550,000
|
|
Lot
4 Mullumbimby Development
|
30,000
|
|
STP
- detailed site contamination study
|
1,841,000
|
|
Pump
Station Renewals
|
128,000
|
|
Locality:
Mullumbimby
|
|
|
Azalea
Street Sewer Replacement / Upgrade
|
850,000
|
|
Pump
Station Renewals
|
106,000
|
|
Mullumbimby
STP Site Remediation
|
100,000
|
|
Locality:
Ocean Shores
|
|
|
Pipe
Renewals / Upgrades - Bindarra Cl/Orana Rd/Kiah Cl
|
254,000
|
|
Pump
Renewals
|
390,000
|
|
Miscellaneous
Pump Station Upgrades
|
160,000
|
|
Ocean
Shores STP Upgrade Project
|
620,000
|
|
Locality:
Various
|
|
|
Demand
Management
|
20,000
|
|
Miscellaneous
Works
|
200,000
|
|
Telemetry
System Software Upgrade
|
50,000
|
|
Sewerage
System Capacity Planning
|
200,000
|
Actions
2016-2017
|
Action Statement
|
Measures
|
Target
|
Delivery Plan Link
|
|
53
|
Obtain Council project approval on future of the Ocean Shores Sewage
Treatment Plant
|
Council resolution of project approval
|
Jun-17
|
45, 51
|
|
54
|
Implement a whole of Council response in the management of the
Belongil catchment
|
No of plan / strategy actions implemented
|
Jun 17
|
22, 44
|
SUSTAINABLE ENVIRONMENT AND ECONOMY
Responsible Executive: Director Sustainable Environment Economy
|
Total Budget:
|
Operating
Revenue
|
Capital
Revenue1
|
Operating
Expenditure
|
Capital
Expenditure2
|
|
$4,196,500
|
$1,817,000
|
$9,474,200
|
$0
|
1. Capital
Revenue excludes transfers from Reserves.
2. Capital
Expenditure excludes loan principal repayments and transfers to Reserves.
Development and Certification
Responsible
Officer: Manager
Sustainable Development
Budget
2016-2017
|
Operating Revenue
|
Capital Revenue
|
Operating Expenditure
|
Capital Expenditure
|
|
$2,182,800
|
$1,817,000
|
$4,756,800
|
$0
|
Actions
2016-2017
|
Action Statement
|
Measures
|
Target
|
Delivery Plan Link
|
|
55
|
Provide efficient, objective and comprehensive development
assessment
|
Development applications determined within 40 days of lodgement
|
At least 60%
|
21
|
|
56
|
Provide efficient, objective and comprehensive development
certification service
|
Construction certificates processed with 28 working days
Complying development certificates processed within 20 working
days
Building certification inspections undertaken within 2 days of
notification
|
At least 80%
At least 80%
At least 80%
|
21
|
|
57
|
Provide guidance and education in planning policies and advice
to the public and stakeholders
|
Provide development industry forum / newsletter
|
At least 1 forum or newsletter provided
|
20, 22
|
|
58
|
Simplify the provision of consistent and accurate flooding
information provided to the development community / public.
|
Review the way that flood data and information is provided to
the development community and public.
|
Commence a review of the provision of flood information.
|
22
|
|
59
|
Provide a Local Heritage Advisory service
|
Grant conditions meet
|
Heritage Services provided in accordance with grants funding.
|
22
|
Environment and Compliance Services
Responsible
Officer: Manager
Sustainable Development
Budget
2016-2017
|
Operating Revenue
|
Capital Revenue
|
Operating Expenditure
|
Capital Expenditure
|
|
$1,792,400
|
$0
|
2,267,300
|
$0
|
Actions
2016-2017
|
Action Statement
|
Measures
|
Target
|
Delivery Plan Link
|
|
60
|
Respond to enquiries concerning public health and safety
|
Customer Service Requests responded to within 25 days of
lodgement
|
At least 85%
|
19
|
|
61
|
Implement effective regulatory and compliance services and
programs to maximise the public health and safety of the community
|
Food business inspections undertaken in accordance with Food
Authority category requirements.
Onsite Sewerage Management Program implemented to Plan
Liquor licence applications responded to in accordance with
Council's Policy and the Liquor Act.
Companion Animals Management Plan reviewed
Suitable impounded animals rehoused
|
At least 90%
Plan Implemented
At least 80%
Commence review of the plan
At least 70%
|
19
|
Planning Policy and Natural Environment
Responsible
Officer: Manager Environmental and Economic Planning
Budget
2016-2017
|
Operating Revenue
|
Capital Revenue
|
Operating Expenditure
|
Capital Expenditure
|
|
$221,300
|
$0
|
$1,864,000
|
$0
|
Actions
2016-2017
|
Action Statement
|
Measures
|
Target
|
Delivery Plan Link
|
|
62
|
Update vegetation mapping in line with legislative requirements
|
Vegetation Mapping
|
Reported to Council
|
42, 43
|
|
63
|
Finalise the Rural Land Use Strategy and commence
implementation of priority actions
|
Plan
Actions
|
Complete
Commenced
|
22, 25, 38
|
|
64
|
Finalise the Residential Strategy and commence implementation
of priority actions
|
Plan
Actions
|
Completed
Commenced
|
22, 25, 38
|
|
65
|
Review Byron DCP 2014 to a performance outcome focused plan (Resolutions
14-315 & 15-604)
|
DCP Review
|
Commenced
|
22, 38
|
|
66
|
Develop an Economic and Employment Strategy for general and
heavy industries. (Resolution 13-127)
|
Project Plan
|
Developed
|
22, 38
|
|
67
|
Continue staged review of Biodiversity Conservation Strategy
|
Project Plan
|
Milestones,
Met
|
42, 43
|
|
68
|
Finalise the Coastal Zone Management Plan
for the Byron Bay Embayment and commence
implementation of priority actions
|
Plan
Actions
|
Complete
Commenced
|
44
|
|
69
|
Progress the Bangalow Place Activation Masterplan and
commence implementation of priority actions
|
Plan
Actions
|
Complete
Commenced
|
22, 25, 38
|
|
70
|
Progress the Mullumbimby Place Activation Masterplan and
commence implementation of priority actions
|
Plan
Actions
|
Complete
Commenced
|
22, 25, 38
|
|
71
|
Progress the Byron Bay Town Centre Masterplan and commence
implementation of priority actions
|
Plan
Actions
|
Complete
Commenced
|
22, 25, 38
|
|
72
|
Implement priority actions in the Low Carbon Strategy
|
Year 2 projects
|
Commenced
|
46
|
Economic Development
Responsible
Officer: Economic
Development Coordinator
Budget
2016-2017
|
Operating
Revenue
|
Capital Revenue
|
Operating
Expenditure
|
Capital
Expenditure
|
|
$0
|
$0
|
$586,100
|
$0
|
Actions
2016-2017
|
Action Statement
|
Measures
|
Target
|
Delivery Plan Link
|
|
73
|
Continue implementation of Byron Shire Tourism Management Plan
|
Beautify Byron Fund
Business Sustainability Program
Visitor Services Strategy
|
Implemented
Implemented
Implemented
|
15, 28, 30, 31
|
|
74
|
Commence implementation of Byron Shire Economic Development
Strategy
|
Business Retention Survey
|
Complete and Reported to Council
|
16, 18, 25, 26,
|
|
75
|
Establish and undertake the Byron Bay Town Centre Place-making
Seed
|
Fund
|
Established
|
16, 17, 31, 32, 39, 40
|
GENERAL MANAGER
Responsible Executive: General Manager
|
Total
Budget:
|
Operating
Revenue
|
Capital
Revenue1
|
Operating
Expenditure
|
Capital
Expenditure2
|
|
$0
|
$0
|
$0
|
$0
|
1. Capital
Revenue excludes transfers from Reserves.
2. Capital
Expenditure excludes loan principal repayments and transfers to Reserves.
General Manager
Responsible
Officer: General Manager
Budget
2016-2017
|
Operating Revenue
|
Capital Revenue
|
Operating Expenditure
|
Capital Expenditure
|
|
$0
|
$0
|
$0
|
$0
|
Actions
2016-2017
|
Action Statement
|
Measures
|
Target
|
Delivery Plan Link
|
|
76
|
Continue to build organisational capacity to deliver effective
and focused community engagement
|
Key staff IAP2 accredited
Key staff having completed an introductory or a specialised IAP2 course
Community Engagement Framework and Tool Kit Developed
|
At least 2
At least 5
Complete
|
3, 5, 6, 14
|
|
77
|
Increase social and digital media presence and information
dissemination
|
Number of hits on web and social media sites
Subscribers across digital platforms
|
Increasing
Increasing
|
13
|
|
78
|
Continue program of building staff capacity to deliver high
quality customer service
|
Customer Service Framework Implementation
% administrative and technical staff having completed facilitated training
|
Commenced
80%
|
3,6
|
|
79
|
Identify and action opportunities to improve customer service
|
Voice of Customer Measurement Systems
Customer Satisfaction Survey Action Plan
|
Implemented
Endorsed
|
3, 13
|
|
80
|
Coordination of benchmarking and monitoring of organisational
performance improvements
|
Business and Management Effectiveness Survey
Effectiveness Action Plan updated to include 2015 results and 2016 Actions
|
Complete
Endorsed and implement-ation commenced
|
24
|
People and Culture Services
Responsible
Officer: Manager
People and Culture
Budget 2016-2017
|
Operating Revenue
|
Capital Revenue
|
Operating Expenditure
|
Capital
Expenditure
|
|
$0
|
$0
|
$0
|
$0
|
Actions
2016-2017
|
Action Statement
|
Measures
|
Target
|
Delivery Plan Link
|
|
81
|
Continue building leadership skills and capacity
|
Leadership Development Programs delivered to Team Leaders and
Supervisors
|
100%
|
24
|
|
82
|
Implementation of Balanced Scorecard Performance Planning
|
Balanced Scorecard system implementation to Manager level
4 quarterly reviews by Managers and Directors
Completion Rate for Balanced Scorecard Actions
|
1/7/2016
Complete
>90%
|
4, 6
|
|
83
|
Effective staff engagement
|
Workforce Survey Action Plan
Staff Suggestion and
Recognition and Reward Schemes programs
Indoor staff forums
Permanent Staff Turnover
Average days of workforce absenteeism per Equivalent Full Time Employment
|
Endorsed
2 each pa
At least 4 pa
<12.5%
<9 pa
|
6, 7
|
|
84
|
Effective injury management programs
|
Workers Compensation Premium (excluding impacts from State
Government formula changes or wages increases)
Return to work of injured workers
|
Reduced on 2015/16
80% in less than 10 days
|
8, 9
|
|
85
|
Implementation of Workforce Plan
|
Actions from Workforce Plan implemented
|
>2 pa
|
10, 11
|
CORPORATE AND COMMUNITY
SERVICES
Responsible Executive: Director Corporate and Community Services
|
Total Budget:
|
Operating
Revenue
|
Capital
Revenue1
|
Operating
Expenditure
|
Capital
Expenditure2
|
|
$25,951,800
|
$35,000
|
$5,685,700
|
$35,000
|
1. Capital
Revenue excludes transfers from Reserves.
2. Capital
Expenditure excludes loan principle repayments and transfers to Reserves.
Public Libraries
Responsible
Officer: Manager
Community Development
Budget
2016-2017
|
Operating Revenue
|
Capital Revenue
|
Operating Expenditure
|
Capital Expenditure
|
|
$60,000
|
$35,000
|
$1,826,500
|
$35,000
|
Capital
Works Program 2016-2017
|
Capital Item
|
Budget ($)
|
|
Locality: Brunswick Heads
|
|
|
Brunswick Heads Library – new purpose built circulation
desk
|
5,000
|
|
Brunswick Heads Library - awning over front entrance
|
30,000
|
Actions
2016-2017
|
Action Statement
|
Measures
|
Target
|
Delivery Plan Link
|
|
86
|
Manage Service Level Agreement with Richmond Tweed Regional
Library Service
|
Agreed Service Level
|
Met
|
34
|
|
|
|
|
|
Children's Services - Other Children's Services
Responsible
Officer: Manager
Community Development
Budget
2016-2017
|
Operating Revenue
|
Capital Revenue
|
Operating Expenditure
|
Capital Expenditure
|
|
$426,100
|
$0
|
$428,200
|
$0
|
Actions
2016-2017
|
Action Statement
|
Measures
|
Target
|
Delivery Plan Link
|
|
87
|
Improve operations of Out of Hours School Care and Vacation Care
services in Mullumbimby, Byron Bay and Brunswick Heads
|
National Quality Framework Rating
|
Maintained
|
47
|
|
|
|
|
|
Children's Services – Sandhill’s Childcare
Responsible
Officer: Manager
Community Development
Budget
2016-2017
|
Operating Revenue
|
Capital Revenue
|
Operating Expenditure
|
Capital Expenditure
|
|
$1,403,500
|
$0
|
$1,476,500
|
$0
|
Actions
2016-2017
|
Action Statement
|
Measures
|
Target
|
Delivery Plan Link
|
|
88
|
Improve service provision to provide quality accredited early
childhood education
|
National Quality Framework Rating
|
Maintained
|
47
|
|
89
|
Implement operational changes to the provision of Out of Hours
School Care and Vacation Care services in Mullumbimby, Byron Bay and
Brunswick Heads
|
National Quality Framework Rating
|
Maintained
|
47
|
|
90
|
Improve collaboration at regional level
|
Regional Forums Attended
|
2
|
47
|
Community Development
Responsible
Officer: Manager
Community Development
Budget
2016-2017
|
Operating Revenue
|
Capital Revenue
|
Operating Expenditure
|
Capital Expenditure
|
|
$133,600
|
$0
|
$1,450,000
|
$0
|
Actions
2016-2017
|
Action Statement
|
Measures
|
Target
|
Delivery Plan Link
|
|
91
|
Expand disability inclusion planning into the development of
Council's Delivery Program
|
Disability Inclusion is embedded in the Delivery Program
|
Completed
|
11
|
|
92
|
Establish regional working group including State and Federal
agencies to undertake baseline service analysis
|
Service Map
|
Completed
|
18
|
|
93
|
Implement actions from the Arakwal Memorandum of Understanding
|
Actions implemented, 4
|
Completed
|
37
|
Information Services
Responsible
Officer: Manager
Business Systems and Technology
Budget
2016-2017
|
Operating Revenue
|
Capital Revenue
|
Operating Expenditure
|
Capital Expenditure
|
|
$9,600
|
$0
|
$26,900
|
$0
|
Actions
2016-2017
|
Action Statement
|
Measures
|
Target
|
Delivery Plan Link
|
|
94
|
Implement prioritised actions from new (2016-2019) Information
Systems strategic plan within resource capability
|
Program delivery as per project plan
|
Milestones, met
|
3, 23
|
|
95
|
Finalise rollout of process mapping and documentation tools.
Train and support staff.
|
Process mapping and documentation tools
Staff surveyed to determine effectiveness of tools and training.
|
Rolled out
Staff trained
Completed
|
3, 23
|
Governance Services
Responsible
Officer: Manager
Governance Services
Budget
2016-2017
|
Operating Revenue
|
Capital Revenue
|
Operating Expenditure
|
Capital Expenditure
|
|
$10,300
|
$0
|
$243,300
|
$0
|
Actions
2016-2017
|
Action Statement
|
Measures
|
Target
|
Delivery Plan Link
|
|
96
|
Improve
strategic planning and integration of strategic planning and reporting framework
processes and plans
|
Workshop
sessions conducted
Community
2017-2027
Delivery
Program 2017-2021 and support Resource Strategy
Operational
Plan 2017-2018
|
2
Endorsed
Endorsed
Endorsed
|
10
|
|
97
|
Provide
quality investigations and response services for conduct complaints
management
|
Conduct
complaints managed within prescribed timeframes
Public
Interest Disclosures and conduct complaints reporting compliant
Annual
training programs for Councillors and staff
|
100%
100%
Conducted
|
3
|
|
98
|
Implement
the strategic procurement roadmap for improved procurement outcomes
|
Project
Milestones
Process
Improvements Implemented
Training
programs
|
Met
2
Conducted
|
24
|
|
99
|
Improve
enterprise wide risk management
|
Training
sessions and workshops held
Business
continuity plan
Toolkit
|
2
Implemented
Developed
|
24
|
|
100
|
Establish
long-term licences for commercial activities on owned and managed open space
crown reserves
|
Competitive
process
|
Called
|
24
|
|
101
|
Establish
long-term licences for sustainable community market policy
|
Competitive
process
|
Finalised
|
24
|
|
102
|
Improve
lease and license rental income
|
Notice
and advice provided to asset managers >180 days of agreement expiry
Notice
and advice provided to executive team >150 days of agreement expiry
Annual
rent reviews conducted
Invoices
raised consistent with agreement
Annual
database audit
Process
Improvements
|
100%
100%
100%
100%
Complete
2
|
24
|
|
103
|
Coordinate
and provide legal services and written advice within agreed timeframes to
support decision making processes
|
Council's
critical projects, 3 working days
Internally
provided, 7 working days
Externally
provided, 21 working days
|
95%
90%
90%
|
24
|
|
104
|
Improve
governance services for quality and robust framework
|
Implement
gap analysis action plan
|
Complete
|
24
|
Councillor Services
Responsible
Officer: Manager
Governance Services
Budget
2016-2017
|
Operating Revenue
|
Capital Revenue
|
Operating Expenditure
|
Capital Expenditure
|
|
$0
|
$0
|
$1,116,600
|
$0
|
Actions
2016-2017
|
Action Statement
|
Measures
|
Target
|
Delivery Plan Link
|
|
105
|
Process
Improvement initiatives
|
New
Councillor Calendaring System
Committee
Review
New
term Councillor equipment policy
|
Implemented,
September 2016
Completed
and Implemented, September 2016
Reviewed
and implemented, September 2016
|
12,
24
|
|
106
|
Coordinate and facilitate new
term Councillor training program
|
Training program
|
Developed and implemented
|
12, 24
|
Financial Services
Responsible
Officer: Manager
Finance
Budget
2016-2017
|
Operating Revenue
|
Capital Revenue
|
Operating Expenditure
|
Capital Expenditure
|
|
$23,908,700
|
$0
|
($882,300)
|
$0
|
Actions
2016-2017
|
Action Statement
|
Measures
|
Target
|
Delivery Plan Link
|
|
107
|
Identify and introduce targeted improvements to financial
performance reporting
|
Enhanced financial reporting tools
|
30-Jun-17
|
24
|
|
108
|
Implementation of improved E Services payment facilities for
Council utilising B-point contingent upon installation of Authority V6.11.
|
Integrated payment gateway with Council's contracted bank
reducing
Transaction costs
|
Established 30/6/2017
Reduced
|
24
|
|
109
|
Addition of water and sewerage assets to the Capital Value
Register (CVR) following revaluation of those assets in 2016/2017.
|
Assets added following revaluation
|
Completed,
30/6/2017
|
24
|
2016-2017 BUDGET
Byron Shire
Council has prepared the 2016-2017 Budget utilising the following parameters:
· Rate peg increase of 1.8% as
announced by the Independent Pricing and Regulatory Authority (IPART).
· Growth in rateable assessments of
1%.
· Indexation of operating expenditure
limited to 0.8% to assist in deriving a 1% efficiency gain.
· Provision for the 2.80% Award
increase from 1 July 2016 under the Local Government (State) Award 2014 for
Council staff.
· No new loan borrowings.
· Interest on investments around 3%
plus active management of the investment portfolio to maximise returns.
· Reflective of actions contained in
this Operational Plan.
As an
overall summary, Council’s Total 2016/2017 Budget is $127,496,700, made
up as follows:
· Operating expenditure (excluding
depreciation) $60,157,700
· Depreciation expense $12,515,100
· Capital works $52,159,600
· Debt repayment (loan principal)
$2,664,300
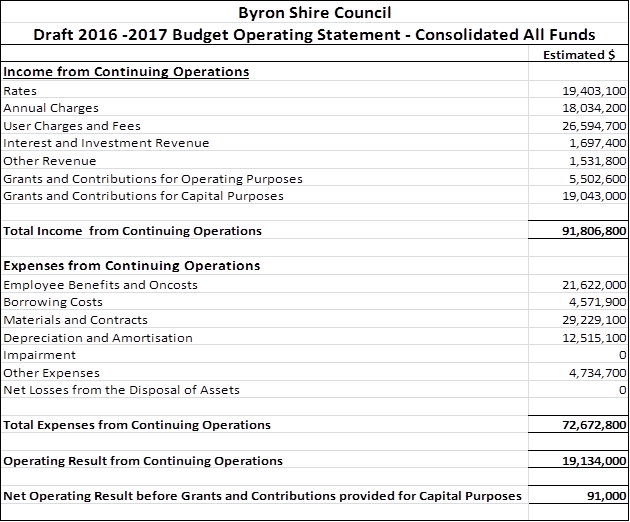
On a
Consolidated All Funds basis, Council is expecting a budget surplus in
2016/2017 of $91,000 as indicated by the following budgeted Operating
Statement:
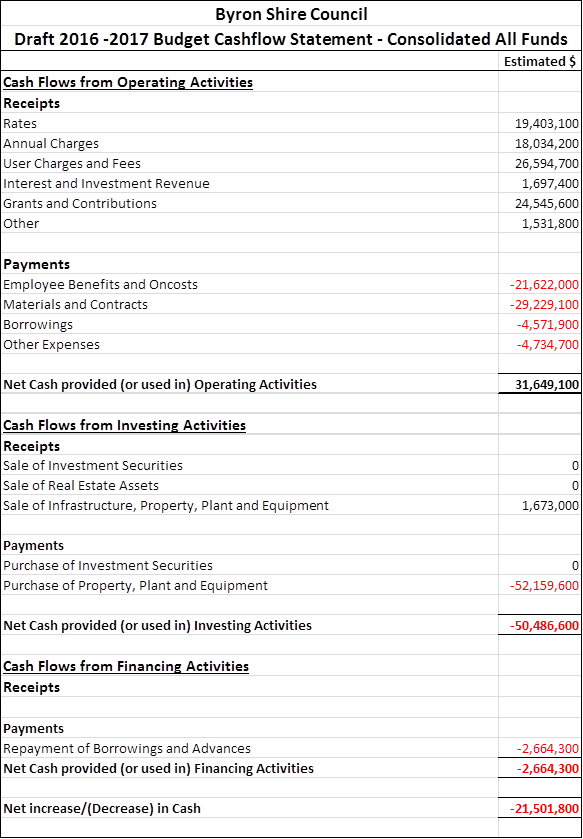
The
estimated movement in the cash position of the Council as indicated by the
2016/2017 Budget Estimates is indicated by the following budgeted Cashflow
Statement:
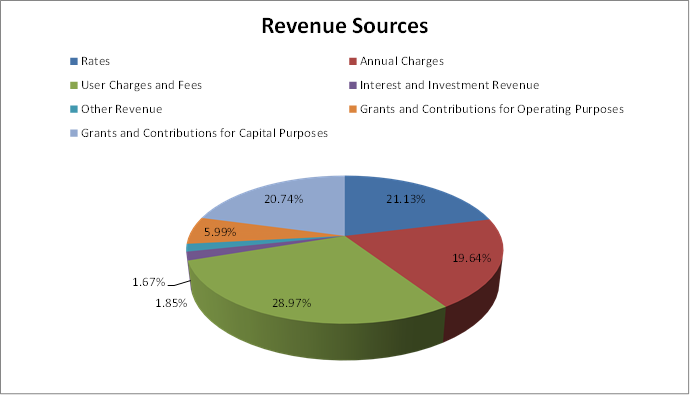
The revenue
sources within 2016/2017 Budget Estimates are proposed to come from the
following sources:
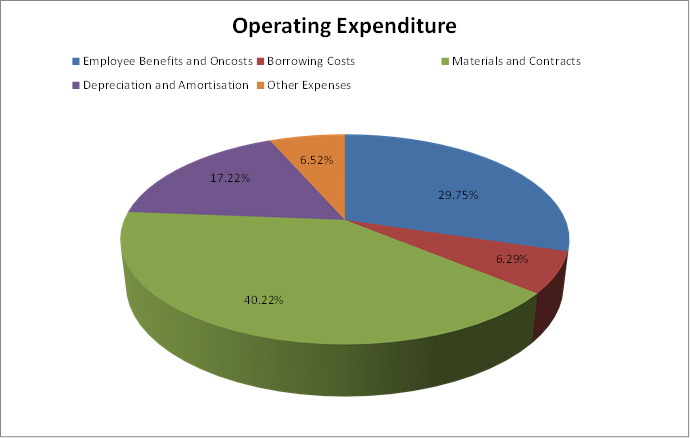
Operating
expenditure contained in the 2016/2017 Budget Estimates are proposed to be
allocated to the following expenditures:
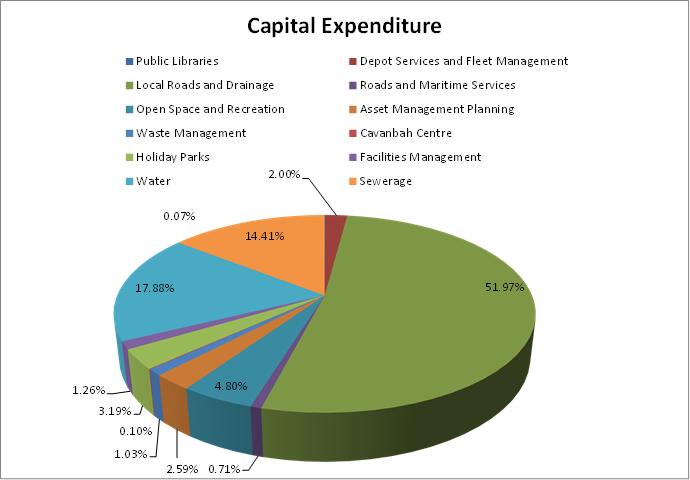
The
proposed Capital Works allocation included in the 2016/2017 Budget Estimates
are proposed to be expended in the following budget programs:
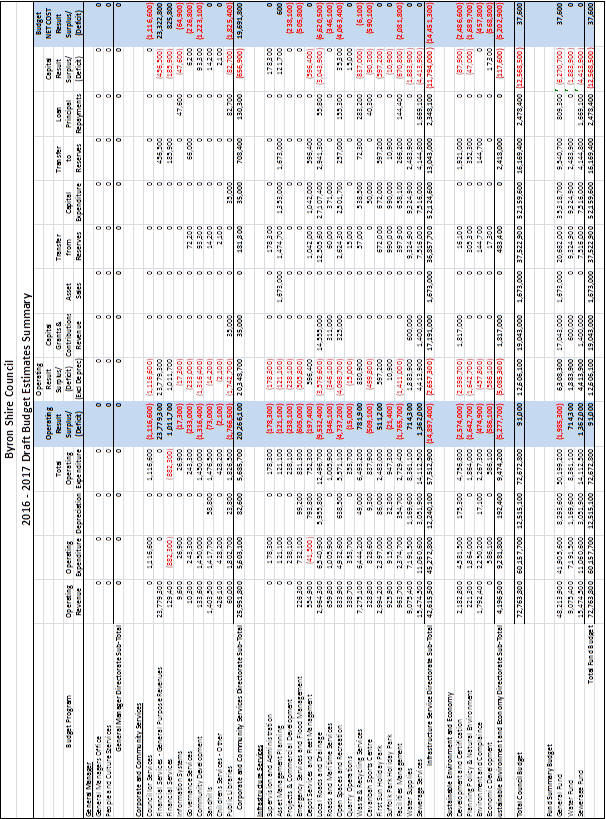
The
summarised 2016/2017 Budget Estimates by Budget Program and results for
Council’s General Funds, Water Fund and Sewerage Fund are detailed in the
table below:
2016-2017
STATEMENT OF REVENUE POLICY
RATING STATEMENT
Rating
Categories
Section 494
of the Local Government Act 1993 requires Council to make and levy ordinary
rates on all rateable land for the year 2016/2017.
In
accordance with the provisions of section 514 of the Act, all parcels of
rateable land in the Council’s area have been declared to be within one
or other of the following categories:
Ø Farmland
Ø Residential
Ø Business
Council has
determined the category / sub category for each parcel of rateable land is in
accordance with the definitions set out in Sections 515, 516, 517, 518, 519 and
529 of the Act.
Residential
(Section 516 LGA)
Section 516
of the Local Government Act 1993 (LGA), provides that:-
“Land
be categorised as ‘residential’ if it is a parcel of
rateable land valued as one assessment and:
(a) its dominant use is for
residential accommodation (otherwise than as a hotel, motel, guest house,
backpacker hostel or nursing home) or any other form of residential accommodation
(not being a boarding house or a lodging house) prescribed by the regulations,
or
(b) in the case of vacant
land, it is zoned or otherwise designated for use under an environmental
planning instrument (with or without development consent) for residential
purposes, or
(c) it is rural
residential land.”
Farmland (Section 515 LGA)
Section 515
of the LGA provides that: -
“(1) Land
is to be categorised as ‘farmland’ if it is a parcel of
rateable land valued as one assessment and its dominant use is for farming
(that is, the business or industry of grazing, animal feedlots, dairying, pig
farming, poultry farming, viticulture, orcharding, beekeeping, horticulture,
vegetable growing, the growing of crops of any kind, forestry, oyster farming,
or fish farming, within the meaning of the Fisheries Act and Oyster Farms 1935,
or any combination of those businesses or industries) which:
(a) has a significant and
substantial commercial purpose or character,
(b) is engaged in for the
purpose of profit on a continuous or repetitive basis (whether or not a profit
is actually made).
(2) Land
is not to be categorised as farmland if it is rural residential land.”
Business (Section 518 LGA)
Section 518
of the LGA provides that:-
“Land
is to be categorised as ‘business’ if it cannot be
categorised as ‘farmland’, ‘residential or
mining’”.
Rating
Sub-categories (Section 529 LGA)
In
accordance with Section 529 of the LGA, Council will continue to have a
sub-category of the ‘Business’ rating category. This sub-category
is called ‘Business Byron Bay CBD’ and is declared as a
‘centre of activity’ in accordance with this section of the Act.
Rate
Pegging
The rate
peg is determined by the Independent Pricing and Regulatory Tribunal (IPART)
each year and sets the maximum general income NSW councils can collect.
The Rate
Peg determines the maximum percentage amount by which a council may increase
its General Income for the year. The Rate Peg to apply to the 2016/2017
financial year will be 1.8%.
General
Income comprises income from ordinary rates and special rates. It does
not include income from waste management service charges, water and sewerage
service charges or stormwater management service charges.
It does not
necessarily mean that each separate rate assessment will increase by that
percentage, but it does mean that the total general income from all assessments
cannot exceed this figure.
Councils can, however, request the State Government to consider granting them a
special variation above the determined Rate Peg percentage. Council has not
applied for a special variation for 2016/17.
Valuations
Ordinary
rates are assessed on a rate in the dollar as a product of the land value
supplied by the Valuer General. The Valuation of Land Act requires the
Council to assess the rates on the most recent values provided by the Valuer
General.
Council
must make and levy a rate in respect to all parcels of rateable land which have
been furnished with a valuation under the Valuation of Land Act. Council
does not participate in the valuation of land for rating purposes.
For equity
purposes, the Valuer General provides Council with updated land valuations
every three years. Council will use these new land valuations for rating
purposes commencing from 2016/17. Any increase in land valuations do not result
in additional total revenue to Council. New land valuations simply redistribute
the rate burden between individual properties.
Current
Rating Structure
Council’s
present rating structure is based on ad valorem amounts subject to a minimum
amount. The ad valorem amounts are determined using fixed differentials
for the different rate categories with the residential category representing a
differential of 100%.
Council’s
intended action for the 2016/2017 rating year is to continue with the ad
valorem rating structure using differentials being subject to a minimum rate.
Rate
Reductions for Eligible Pensioners (Section 575 LGA)
Council
provides for rate reductions to eligible pensioners under Section 575 of the
Local Government Act 1993.
Rebates are
available to eligible pensioners who are solely or jointly liable for the
payment of rates and charges. These rebates are as follows:
· 50% of the combined ordinary rates
and domestic waste management charge up to a $250.00 maximum rebate.
· 50% of water fixed and usage charges
up to an $87.50 maximum rebate.
· 50% of sewerage fixed charge up to
an $87.50 maximum rebate.
Interest
on Overdue Rates & Charges (Section 566 LGA)
Interest
accrues on a daily basis on rates and charges that remain unpaid after they
become due and payable. Council will apply the maximum interest allowable
under Section 566(3) of the Local Government Act 1993 as determined by the
Minister in each year. The interest rate to apply for 2016/17 has been
determined to be 8.0%.
Non-Rateability
(Sections 555 & 556 LGA)
All land is
deemed to be rateable unless it is exempt from rates under the provisions of
Sections 555 and 556 of the Local Government Act 1993.
Payment
Schedule of Rates & Charges for 2016/2017
Ratepayers
may continue to pay their rates and charges in four quarterly instalments as
follows for the 2016/17 rating year:
|
Instalment
|
Issued by Date
|
Due Date
|
|
First
|
31/07/2016
|
31/08/2016
|
|
Second
|
30/10/2016
|
30/11/2016
|
|
Third
|
28/01/2017
|
28/02/2017
|
|
Fourth
|
30/04/2017
|
31/05/2017
|
Council is
required to forward instalment notices at least one month prior to each of
these due dates.
During the
year, in accordance with the Local Government Act 1993, a supplementary rate
levy may be issued which may affect the amount of rates and charges levied on
some parcels of land. The rates and charges are apportioned over the
remaining instalments due after the supplementary levy is applied. In an
attempt to alleviate hardship that may arise in this situation, consideration
will be given to the formulation of an agreement with the ratepayer pursuant to
Section 564 (LGA) for the payment of rates and charges and the waiving of
interest penalties if the agreement is adhered to.
STATEMENT OF ORDINARY RATES
TO BE LEVIED
The
Independent Pricing and Regulatory Tribunal (IPART) has granted a rate peg
percentage which will limit the increase in General Rate Income for 2016/17 by
1.8% from the previous year.
Structure
of the Rate (Section 497 LGA)
Section 497
of the Local Government Act 1993 provides the method of the structure of the
rate.
In 2016/17
Council will continue with a rating structure using an ad valorem rate
(determined by differentials) subject to a minimum amount for all rateable
properties.
Ordinary
Rates (Section 494 LGA)
The
ordinary rate structure for 2016/17, which provides for a general increase of
1.8% allowable under rate pegging as determined by the Independent Pricing and
Regulatory Tribunal (IPART), is provided in table 1 below:
Table
1:
Ad
valorem rate (including minimum rate) – 1.8% Rate Pegging Increase
– New 2015 base date land valuations
|
Category and
Sub-Categories
|
Number of Properties
|
Ad valorem Rate ($)
|
Minimum Rate ($)
|
Total Yield ($)
|
Proportional
Contribution of Yield (%)
|
Rating Differential
(%) ##
|
|
Residential
Ordinary
|
13,102
|
0.2302
|
695.00
|
14,923,528
|
75.97
|
100.00
|
|
Residential
Ordinary
(Flood
Prone Lands)*
|
28
|
0.2302
|
382.00
|
10,736
|
0.05
|
100.00
|
|
Business
Ordinary
|
1,098
|
0.3453
|
695.00
|
2,274,308
|
11.58
|
150.00
|
|
Business
Byron Bay CBD
|
352
|
0.4604
|
695.00
|
1,561,890
|
7.95
|
200.00
|
|
Farmland
Ordinary
|
542
|
0.1697
|
695.00
|
871,493
|
4.43
|
73.73
|
|
Farmland
Ordinary
(Flood
Prone Lands)*
|
0
|
0.1697
|
382.00
|
0
|
0.00
|
73.73
|
|
TOTALS
|
15,124
|
|
|
19,641,955
|
|
|
* As per
Section 548(c) of the Local Government Act, vacant flood liable land or vacant
coastal hazard liable land can be subject to a lower minimum rate.
The minimum
rate will not apply to properties subject to a Voluntary Conservation Agreement
under the National Parks and Wildlife Act 1974. The portion of the parcel
of land that is subject to the conservation agreement is exempt from rates
under section 555(1)(b1) of the Local Government Act 1993. Rates may be made
and levied on the other part of the parcel of land proportionately.
##
Rating Differential
Council has
a differential rate in the dollar for properties categorised as business. The
Business Ordinary ad valorem rate (rate in the dollar) is 150% of the
residential ad valorem rate.
In addition
to this Council has declared a designated area within the Byron Bay Business
Centre, as a centre of activity in accordance with Section 529 of the Local
Government Act. Business properties within this defined area will
represent a sub-category for the business category known as Business Byron Bay
CBD and will have an ad valorem rate being 200% of the Residential Ordinary ad
valorem rate. The following map defines the properties identified within this
‘centre of activity’.
The
Farmland Ordinary ad valorem rate is 73.73% of the Residential Ordinary ad
valorem rate.
Map –
Rating Sub Category - Business Byron Bay CBD

STATEMENT OF CHARGES TO BE
LEVIED
In
accordance with Sections 496, 496A, and 501 of the Local Government Act 1993,
Council will levy annual charges for the following services:
· Sewerage
· Water
· Domestic Waste Management
· Non Domestic Waste Management
· Drainage (Stormwater Management)
In
accordance with Section 502 of the Local Government Act 1993, Council will levy
charges for actual use for the following services:
· Sewerage
· Water
· Liquid Trade Waste
Water,
Sewerage and Waste Management Charges relating to non-rateable properties will
be charged in accordance with Sections 496, 501 and 502 of the Local Government
Act 1993. For the purpose of charging these non-rateable properties that
actually use these services, the charges to be applied are the same as those
charged against rateable properties as these charges are representative of use.
Waste
Management Charges
In
accordance with Section 496 of the Local Government Act 1993 (LGA), Council
must make and levy an annual charge for the provision of Domestic Waste
Management services for each parcel of rateable land for which the service is
available.
Council’s
waste management charging structure encourages customers to reduce the level of
waste that ends up in landfill.
At
the commencement of the 2016/17 financial year the domestic waste management
charge will be applied for the services identified in the table below. A
ratepayer may request to change their garbage MGB size once per annum per
property free of charge. A bin changeover fee will apply for subsequent
requests by the same ratepayer.
Where an
urban domestic waste collection service is available but not used by a
customer, that customer will be charged a single standard domestic waste
collection service applicable for that type of property.
Vacant
Properties (ie properties without a dwelling) within the urban domestic waste
collection service area will be charged a Vacant Domestic Waste Charge.
Where a
rural domestic waste collection service is available but not used by the
customer, that customer will be charged a single ‘Rural Waste
Availability Charge’, except where an exemption to the service has
previously been granted.
In
accordance with Section 501 of the LGA, Council will charge an annual Waste
Management Charge for all non-domestic customers provided with a collection
service identified in the table below.
Additional
charges for both domestic waste and non-domestic waste are levied for each
individual service in excess of a single service.
An annual
Waste Operations Charge for on-going operations and future infrastructure
requirements of the Council landfill and transfer station will be levied for
each waste service (domestic and non-domestic).
|
Waste Collection
Service Type
|
Annual Charge ($)
|
Number of Services
|
Estimated Yield ($)
|
|
Urban Domestic
Collection Service - Annual Charge
(Section 496)
|
|
|
|
|
Urban
Domestic - Single Dwellings 3 MGB service
|
|
|
|
|
80 litre
landfill MGB, 240 L recycle MGB & 240 L organics MGB
|
123.00
|
517
|
63,591
|
|
140 litre
landfill MGB, 240 L recycle MGB & 240 L organics MGB (Standard Service)
|
260.00
|
6,891
|
1,791,660
|
|
240 litre
landfill MGB, 240 L recycle MGB & 240 L organics MGB
|
386.00
|
1,508
|
582,088
|
|
Urban Domestic
- Multi Unit Dwellings(MUD)
|
|
|
|
|
MUD -
3 MGB service per unit.
|
|
|
|
|
80 litre
landfill MGB, 240 L recycle MGB & 240 L organics MGB
|
123.00
|
216
|
26,568
|
|
140 litre
landfill MGB, 240 L recycle MGB & 240 L organics MGB (Standard Service)
|
260.00
|
905
|
235,300
|
|
240 litre
landfill MGB, 240 L recycle MGB & 240 L organics MGB
|
386.00
|
127
|
49,022
|
|
MUD -
2 MGB service per unit (Council exempt Organics service)
|
|
|
|
|
80 litre
landfill MGB & 240 L recycle MGB
|
123.00
|
5
|
615
|
|
140 litre
landfill MGB & 240 L recycle MGB
|
260.00
|
49
|
12,740
|
|
240 litre
landfill MGB & 240 litre recycle MGB
|
386.00
|
14
|
5,404
|
|
MUD
– Council approved shared 3 MGB service between two units
|
|
|
|
|
240 litre
landfill MGB collected fortnightly, 240 litre recycle MGB collected
weekly & 240 litre organics MGB collected weekly
|
207.00
|
406
|
84,042
|
|
MUD
– Council approved shared 2 MGB service between two units
|
|
|
|
|
240 litre
landfill MGB collected weekly & 240 L recycle MGB collected weekly
|
207.00
|
378
|
78,246
|
|
Additional
Recycling MGB collected fortnightly (per service)
|
86.00
|
83
|
7,138
|
|
Additional
Organics MGB collected weekly (per service)
|
100.00
|
5
|
500
|
|
Vacant
Domestic Waste Charge (vacant land in the urban collection area)
|
25.00
|
363
|
9,075
|
|
Sub-Total
|
|
11,467
|
2,945,989
|
|
Rural Domestic Collection
Service – Annual Charge
(Section 496)
|
|
|
|
|
Rural
Domestic Waste Collection Service - 240 litre landfill MGB collected
fortnightly, 240 L recycling MGB collected fortnightly
|
277.00
|
2,622
|
726,294
|
|
Rural
Service Availability Charge
|
25.00
|
456
|
11,400
|
|
Sub-Total
|
|
3,078
|
737,694
|
|
Bin Changeover Fee
|
|
|
|
|
Landfill
MGB size changeover fee (one changeover of landfill MGB size per property per
annum per ratepayer is free of charge)
|
55.00
|
0
|
0
|
|
Sub-Total
|
|
0
|
0
|
|
Rural Commercial
Collection Service – Annual Charge
(Section 501)
|
|
|
|
|
Rural
Commercial Collection Service - 240 litre landfill MGB collected fortnightly,
240 L recycling MGB collected fortnightly
|
433.00
|
51
|
22,083
|
|
Sub-Total
|
|
51
|
22,083
|
|
Urban Commercial Waste
Collection - Annual Charge
(Section 501)
|
|
|
|
|
Weekly
collection of 140 L landfill MGB & 240 L recycling bin
|
420.00
|
192
|
80,640
|
|
Weekly
collection of 240 L landfill MGB & 240 L recycling bin
|
481.00
|
974
|
468,494
|
|
Weekly
collection of 140 L landfill MGB
|
420.00
|
17
|
7,140
|
|
Weekly
collection of 240 L landfill MGB
|
481.00
|
140
|
67,340
|
|
Additional
weekly collection of 240 litre recycling bin (per service)
|
108.00
|
321
|
34,668
|
|
Weekly
collection of 240 L Organics MGB (schools, community centres and
not-for-profit organisations subject to eligibility criteria)
|
100.00
|
0
|
0
|
|
Sub-Total
|
|
1,550
|
658,282
|
|
Waste Operations
Annual Charge
(Section 501)
|
|
|
|
|
Waste
Operations Annual Charge - Residential
|
70.00
|
13,349
|
934,430
|
|
Waste
Operations Annual Charge – Non-Residential
|
70.00
|
1,653
|
115,710
|
|
Sub-Total
|
|
15,002
|
1,050,140
|
|
TOTAL
REVENUE
|
|
|
5,414,188
|
Stormwater
Management Service Charge (Section 496A)
In
accordance with Section 496A of the Local Government Act 1993 Council will
charge a ‘Stormwater Management Service Charge’ against rateable
properties for which the service is available. Council has identified the
residential and business properties that are within Council’s urban
stormwater catchment areas that will be levied this charge for the 2016/17
financial year.
The
following charging methodology will be used by Council for the 2016/17 rating
year using the guidelines released by the Division of Local Government,
Department of Premier and Cabinet.
Charge
Methodology
The
Departmental guidelines provide Council with the opportunity to levy charges on
a catchments area or global basis, while ensuring that the total income
generated does not exceed the level of expenditure for new and additional
stormwater management. Council has a large capital works program to complete
for stormwater and therefore it has been adopted that a global approach will be
used to enable significant works to be funded at a given time using all revenue
levied, rather than waiting to collect enough funds in individual catchments.
In accordance with these guidelines, councils still need to ensure equitable distribution
of stormwater management services over time.
Properties
categorised as Residential (Not being Strata Titled)
A flat
charge of $25.00 for a Stormwater Management Service Charge is to be charged
against each eligible assessment categorised as Residential within the urban
stormwater catchment. This charge is uniform across all urban catchment
areas to minimise administration costs.
This amount
of $25.00 is the current upper charge limit for urban residential land
stipulated in clause 125AA of the Local Government (General) Regulation 2005.
Properties
categorised as Residential (Strata Units)
The cost of
managing stormwater runoff from impervious surfaces is usually substantially
less per residential strata lot than per standard residential property.
It is for
this reason that a flat charge of $12.50 for a Stormwater Management Service
Charge is to be levied against each eligible residential strata unit within the
urban stormwater catchment. This charge is uniform across all urban
catchment areas to minimise administration costs.
This amount
of $12.50 has been recommended using the guidelines provided by the Division of
Local Government, Department of Premier and Cabinet.
Properties
categorised as Business (Not being Strata Titled)
A Stormwater
Management Service Charge is to be charged against each eligible assessment
(not being strata titled) categorised as business within the urban stormwater
catchment area based on the total area of the assessment. A charge of
$25.00, plus an additional $25.00 for each 350 square metres or part thereof by
which the area of the parcel of land exceeds 350 square metres.
The
criteria for charging business properties by using property areas has been
recommended using the guidelines provided by the Division of Local Government,
Department of Premier and Cabinet.
Exceptions
to area based charging – Business Properties
After an
analysis of business land areas is was discovered that certain business
properties covering large property areas would incur significant charges for
stormwater management that would not be reflective of the level of stormwater
service provided by Council. These properties involve large portions of
open space not being impervious in nature and therefore not producing an
increased level of stormwater run-off.
Some
examples of properties that fall into this category include:
· Bowling Clubs
· Golf Courses
· Caravan Parks
· Resorts
· Business properties populating a
small portion of a total land area
Therefore,
under these circumstances, Council officers have reviewed the Stormwater
Management Service Charge to be applied to these types of properties so that a
more equitable charge can be determined. This review process has involved
an analysis of the impervious surfaces on each reviewed property to reflect a
charging structure similar to business properties of a smaller land area.
Properties with a land area in excess of 4,000 square metres have been reviewed
in relation to the impervious surface area of the land, with the charge determined
by grossing up the impervious surface area by a factor of 11%, in accordance
with the assumptions made within the departmental guidelines. See example
below:
Example
Total land
area 50,000
sq metres
Impervious
surface area* 1,000
sq metres
* The impervious
surface area is calculated by identifying this surface type on individual
properties using Council’s aerial photos and the GIS system.
Calculation
of Area to be charged
As the
departmental guidelines assume that 90% of business properties are impervious,
the impervious surface is grossed up to determine the area of the land subject
to the charge. That is:
Impervious
area /90 x 100
= 1000 / 90
* 100
= 1111
square metres.
Applying
charges recommended for business properties, the charge will be:
For the
first 350 square metres
$25.00
For the
second 350 square metres
$25.00
For the
third 350 square metres
$25.00
For the
remaining square metres
$25.00
Total
charge $100.00
It should
be noted that properties with an area less than 4,000 square metres are able to
have the charge reviewed under the appeal process.
Properties
categorised as Business (Strata Units)
A
Stormwater Management Service Charge will be levied on each eligible business
strata unit within the urban stormwater catchment area based on one of the
following two scenarios:
Scenario
1 – Business Strata Units Only
If the strata complex
contains only business properties (i.e. not mixed development) the charge per
strata unit will be calculated by using a charge of $25.00 per 350m² of
the land area occupied by the strata scheme (or part thereof),proportioned by
the unit entitlement of each lot in the strata scheme. In the event that
this approach results in charge of less than $5.00 per unit, a minimum charge
of $5.00 will be levied on each strata unit.
This method of charging
is consistent with the methodology used to charge non-strata titled business
properties.
Scenario
2 – Business and Residential Strata Units (Mixed Development)
If the
strata complex contains mixed development (i.e. properties rated as both
business and residential) the dominant rating category of the total parcel of
land, using data provided by the Valuer General, must be determined and charges
will apply for Business strata units or Residential strata units as previously
adopted. In the event that a mixed development is 50% residential and 50% business,
Council has the discretion to determine whether to charge the property as a
residential or business property.
Urban
Land Exempt from the Stormwater Management Service Charge
The same
exemptions that apply to non-rateable properties for other rates and charges
also apply in respect of the stormwater management service charge pursuant to
the Local Government Act.
In
addition, the following properties are also exempted from this charge under the
provisions:
· Rateable land owned by the Crown
· Rateable land under a lease for
private purposes granted under the Housing Act 2001 or the Aboriginal Housing
Act 1998
· Vacant Land
Councils
are also not to levy the charge on properties where they do not provide a
stormwater management service.
The following
table shows the 2016/17 charge structure and associated yield amounts for the
Stormwater Management Service Charge.
|
Property Type
|
Number of Properties
|
Annual Charge ($)
|
Yield ($)
|
|
Residential
Properties (not strata titled)
|
7,326
|
25.00
|
183,150
|
|
Residential
Strata Units (not within a mixed development)
|
2,204
|
12.50
|
27,550
|
|
Business
Strata Units (not within a mixed development)
|
504
|
**Varying Amounts
(5.00 minimum charge)
|
11,705
|
|
Business
Strata Units (within a mixed development)
|
123
|
12.50
|
1,538
|
|
Business
Properties (not strata titled)
|
565
|
**Varying Amounts
(25.00 minimum charge)
|
67,525
|
|
Totals
|
10,814
|
|
291,928
|
**
Varying Amounts: A
single annual flat charge does not apply to Business Properties (as charges are
based on an individual property’s impervious land area), or Business
Strata Units not within a mixed development (as charges are based on the common
property land area and strata unit entitlement for each strata complex). As a
result, individual annual charges have been omitted form the above table.
Funds
derived from the Stormwater Management Service Charge must be spent on
transparent (i.e. on ground) works and the community must be advised of the
proposed works and projects as part of the Operational Plan consultation
process.
Details of
expenditure on overall stormwater/drainage capital works can be found in
Capital Works section of the Budget document as part of this Revenue Policy.
Water
Charges
Council's
water charging structure is made up of two tiers, a fixed annual charge for all
properties and a usage charge based on actual water consumed. In addition
a small amount of revenue is generated from fixed annual charges for fire
services.
Fixed water
charges for both Residential and Non-Residential properties are charged depending
on water meter connection size and the number of services connected to the
property.
Vacant land
which does not have a water meter connected will be charged the equivalent of
50% of the 20mm Service Charge.
To properly
reflect the water load a water connection can place on the system, fixed annual
charges are proportional to the square of the size of the customer’s
water supply service, which is in accordance with the NSW State
Government’s “Best Practice Management of Water Supply and Sewerage
Guidelines”.
The formula
used to derive annual water fixed charges based on connection size is:
WF
= WF20 x (D2/400)
Where: WF = Customer’s
Annual Water Fixed Charge ($)
WF20 = Annual
Water Fixed Charge for a 20mm
diameter water supply service connection
($)
D = Diameter
of water supply service (mm)
Water
Fixed Charge - Annual Charges (Section 501)
Residential
Properties
|
Service Type
|
Annual Charge ($)
|
Number of Services
|
Estimated Yield ($)
|
|
|
|
20mm
Service
|
179
|
7,953
|
1,423,587
|
|
|
25mm
Service
|
280
|
42
|
11,760
|
|
|
32mm
Service
|
459
|
8
|
3,672
|
|
|
40mm
Service
|
716
|
14
|
10,024
|
|
|
50mm
Service
|
1,119
|
8
|
8,952
|
|
|
65mm
Service
|
1,891
|
0
|
0
|
|
|
80mm
Service
|
2,864
|
0
|
0
|
|
|
100mm
Service
|
4,475
|
1
|
4,475
|
|
|
Vacant
Land
|
90
|
176
|
15,752
|
|
|
Strata
Unit (Residential)
|
179
|
2,196
|
393,084
|
|
|
Fire
Service
|
238
|
9
|
2,143
|
|
|
Total
|
|
10,407
|
1,873,449
|
|
Non-Residential
Properties
|
Service Type
|
Annual Charge ($)
|
Number of Services
|
Estimated Yield ($)
|
|
|
|
20mm
Service
|
179
|
455
|
81,445
|
|
|
25mm
Service
|
280
|
155
|
43,400
|
|
|
32mm
Service
|
459
|
45
|
20,655
|
|
|
40mm
Service
|
716
|
88
|
63,008
|
|
|
50mm
Service
|
1,119
|
61
|
68,259
|
|
|
65mm
Service
|
1,891
|
2
|
3,782
|
|
|
80mm
Service
|
2,864
|
9
|
25,776
|
|
|
100mm
Service
|
4,475
|
10
|
44,750
|
|
|
Vacant
Land
|
90
|
34
|
3,043
|
|
|
Strata
Unit (Business)
|
179
|
709
|
126,911
|
|
|
Fire
Service
|
238
|
55
|
13,094
|
|
|
Total
|
|
1,623
|
494,123
|
|
Water
Usage Charges (Section 502)
A charge
will be raised for the use of the Water Supply Service on a quarterly basis
based on the usage recorded through the water meter or meters servicing each
property. The charge will be based on an inclining block tariff and will apply on
an annual basis as follows:
Residential
Properties up
to 450/kl per reading year $2.47
per kl
usage
above 450/kl per reading year $3.70
per kl
Non-Residential
Properties all
water usage $2.65
per kl
· The estimated income from Residential
water usage charges for 2016/17 is $4,384,135.
· The estimated income from Non-Residential
water usage charges for 2016/17 is $2,081,740.
Sewerage
Charges
Council’s
sewerage pricing structure similar to the water pricing incorporates a two
component pricing structure, a fixed annual charge for all properties and a
usage charge based on water usage and discharge volume into the sewerage
system.
An annual
Sewerage Fixed Charge will apply to all single dwelling residential properties
including strata title units. Land that is vacant with no existing premise
connected to the council sewer system will be charged equivalent to 50% of the
Residential Sewerage Fixed Charge.
The Sewerage
Fixed Charge for Residential properties for 2016/17 will be $819.00.
The Sewerage
Fixed Charge for Non-Residential properties is proportional to the size of the
water supply service connection to the property in order to reflect the
potential load placed on the sewerage system.
Properties
which are not separately metered, and all Non-Residential Strata Title units
will be charged a Sewerage Service Fixed Charge equivalent to that of a
Non-Residential property with a 20mm water connection.
Land that
is vacant with no existing premise connected to the council sewer system will be
charged equivalent to 50% of the Non-Residential Sewerage Fixed Charge for a
20mm connection.
Sewerage
Fixed Charge - Annual Charges (Section 501)
Residential
Properties
|
Service Type
|
Annual Charge ($)
|
Number of Services
|
Estimated Yield ($)
|
|
|
|
Residential
Sewerage Service Fixed Charge
|
819
|
7,272
|
5,955,768
|
|
|
Strata
Units (Residential)
|
819
|
2,201
|
1,802,619
|
|
|
Vacant
Land – not connected to Sewer
|
410
|
294
|
120,393
|
|
|
Sewerage
Access Charge 25mm (multi-occupancy)
|
1,280
|
28
|
35,840
|
|
|
Sewerage
Access Charge 32mm (multi-occupancy)
|
2,097
|
7
|
14,679
|
|
|
Sewerage
Access Charge 40mm (multi-occupancy)
|
3,276
|
13
|
42,588
|
|
|
Sewerage
Access Charge 50mm (multi-occupancy)
|
5,119
|
8
|
40,952
|
|
|
Sewerage
Access Charge 65mm (multi-occupancy)
|
8,651
|
0
|
0
|
|
|
Sewerage
Access Charge 80mm (multi-occupancy)
|
13,104
|
0
|
0
|
|
|
Sewerage
Access Charge 100mm(multi-occupancy)
|
20,475
|
0
|
0
|
|
|
Residential
(with Sewer Pods)**
|
794
|
173
|
137,362
|
|
|
Totals
|
|
9,996
|
8,150,201
|
|
**
Residential properties connected to Council’s sewerage system via a Sewer
Pod device (New Brighton / Billinudgel areas) are charged a sewerage fixed
charge of $777.00 which is $25.00 less than the standard residential charge.
The $25.00 reduction per annum is to assist in paying for electricity costs
incurred by customers in the use of the Sewer Pods.
Sewerage
Fixed Charge - Annual Charges (Section 501)
Non-Residential
Properties
|
Service Type
|
Annual Charge ($)
|
Number of Services
|
Estimated Yield ($)
|
|
|
|
Non-Residential
Properties (including Non-Rateable Properties)
|
|
|
|
|
|
Sewer
Service Access Charge - Non-Residential Strata Units
|
819
|
693
|
567,567
|
|
|
Sewer
Service Access Charge – Vacant Land
|
410
|
49
|
20,066
|
|
|
Non-Residential
Properties (with Sewer Pods)**
|
794
|
9
|
7,146
|
|
|
Sewer
Service Access Charge 20mm
|
819
|
403
|
330,057
|
|
|
Sewer Service
Access Charge 25mm
|
1,280
|
141
|
180,480
|
|
|
Sewer
Service Access Charge 32mm
|
2,097
|
42
|
88,074
|
|
|
Sewer
Service Access Charge 40mm
|
3,276
|
73
|
239,148
|
|
|
Sewer
Service Access Charge 50mm
|
5,119
|
51
|
261,069
|
|
|
Sewer
Service Access Charge 65mm
|
8,651
|
2
|
17,302
|
|
|
Sewer Service
Access Charge 80mm
|
13,104
|
10
|
131,040
|
|
|
Sewer
Service Access Charge 100mm
|
20,475
|
7
|
143,325
|
|
|
Totals
|
|
1,480
|
1,985,274
|
|
**
Non-Residential properties connected to Council’s sewerage system via a
Sewer Pod device (New Brighton / Billinudgel areas) are charged a sewer fixed
charge based on $777.00 which is $25.00 less than the standard residential
charge. The $25.00 reduction per annum is to assist in paying for electricity
costs incurred by customers in the use of the Sewer Pods.
Sewerage
Usage Charges (Section 502)
A sewerage
discharge factor applies to all sewerage infrastructure users. The
discharge factor is applied to the total water usage for properties and
reflects the typical load properties place on the sewerage system.
The Sewer
discharge factor is the ratio of all wastewater discharged from a premises to
the sewerage system to the total water consumption expressed as a percentage.
For
residential properties, the discharge factor is 75% and therefore the charge
per kilolitre (1,000 litres) is $1.85 (being 75% of the water usage
charge).
Sewerage
discharge factors for non-residential properties are determined by the type of
activity undertaken on the property and are calculated as defined in the NSW
Department of Water and Energy, Liquid Trade Waste Regulation Guidelines April
2009.
· The estimated income from residential
sewerage usage charges for 2016/17 is $3,094,526.
Non-residential
properties can have different sewerage discharge factors dependent on the
nature of the business. The sewerage discharge factor (SDF) for non-residential
properties has been determined using category of business guidelines set by the
New South Wales Office of Water.
The
sewerage usage charge for non-residential properties is therefore calculated by
applying the business category SDF to a non-residential sewerage usage charge
of $2.47 per kilolitre.
· The estimated income from
non-residential sewerage usage charges for 2016/17 is $1,484,387..
Liquid
Trade Waste Fixed Charge (Section 501)
Liquid
Trade Waste means “all liquid waste other than sewage of a domestic
nature.”
The purpose
of this charge is to cover the costs incurred by Council for the administration
and management (including inspections) of these systems.
The liquid
trade waste classifications are based on the level of impact dischargers have
on the sewerage system.
Liquid
Trade Waste Annual Charge
is charged on properties that discharge liquid trade waste but are not required
to apply for Council approval.
Category
1 dischargers are
those businesses which conduct an activity deemed by Council as requiring
minimal pre-treatment and are considered low risk.
Category
2 dischargers are
those businesses which conduct an activity generating medium to high level
liquid trade waste that requires a pre-treatment equipment (such as a grease
trap) to be installed.
Category
2S dischargers are
those businesses which conduct an activity of transporting and/or discharging
septic tank or pan content into the sewerage system.
Category
3 dischargers are
those businesses which discharge large volumes of liquid trade waste (over 20
kl/d) to the sewerage system.
|
Service Type
|
Annual Charge ($)
|
Number of Services
|
Estimated Yield ($)
|
|
|
|
Liquid
Trade Waste – Annual Charge
|
31
|
6
|
248
|
|
|
Liquid
Trade Waste – Category 1 - Residential
|
153
|
1
|
153
|
|
|
Liquid
Trade Waste – Category 1
|
153
|
83
|
12,699
|
|
|
Liquid
Trade Waste – Category 2
|
255
|
189
|
48,195
|
|
|
Liquid
Trade Waste – Category 2S
|
255
|
1
|
255
|
|
|
Liquid
Trade Waste – Category 3
(Large Industrial and Commercial Premises)
|
429
|
3
|
1287
|
|
|
Totals
|
|
285
|
62,837
|
|
Liquid
Trade Waste Usage Charges (Section 502)
Liquid
trade waste dischargers have a Trade Waste Discharge Factor (TWDF) added to
their Sewerage Discharge Factor (SDF) to determine their total sewerage usage
charge.
Like the
SDF factors the TWDF factors have been determined using category of business
guidelines set by the NSW Department of Water and Energy.
The trade
waste usage charge for non-residential properties is therefore calculated by
applying the business category TWDF against the liquid trade waste usage
charge of $2.24 per kilolitre.
Usage
charges will apply to Category 2 and 3 liquid trade waste dischargers and
charges will be calculated as defined in NSW Department of Water and Energy,
Liquid Trade Waste Regulation Guidelines April 2009.
· The estimated income from
non-residential trade waste usage charges for 2016/17 is $265,976.
Non-Complying
Trade Waste Discharge Users (Sections 501 and 502)
Properties that are technically non‐complying users of Council’s sewerage reticulation system will be levied
a sewerage usage charge of $3.70 per kilolitre.
This
charge is a valuable tool in achieving compliant sewerage infrastructure.
Council has issued advice to
a property where a private sewer pumping station is not
compliant. A three month period has elapsed and the premises remain
non-compliant.
Non‐Complying Water Supply Users (Sections 501 and 502)
Properties that are technically non‐complying users of Council’s water supply will be levied
a water usage charge of $5.30 per kilolitre.
This
charge is a valuable tool in achieving compliance with water supply and private fire hydrant systems.
There
are two possible
scenarios on why this charge
can be applied to a property:
1. Council has
issued advice to the owner that no backflow
device or private fire
hydrant system has been installed where necessary. A
three month period has elapsed and the premises remain non-compliant.
2. Council has issued advice to the
owners that no backflow devices or fire hydrants maintenance report has been provided. A
three month period has elapsed and the premises remain non-compliant.
Calculation
of Usage Charges
Residential
Property discharging Sewerage
The
following formula indicates how total usage charges would be calculated for a
residential property consuming water and discharging sewerage.
TUC = (C x
UC) + (SDF x C x UC)
Where: TUC = Total
Usage Charges ($)
C = Water
Consumption (kilolitres)
UC = Water
Usage Charge ($)
SDF = Sewerage
Discharge Factor (%)
Non-Residential
Property discharging Sewerage
The
following formula indicates how total usage charges would be calculated for a
non-residential property consuming water and discharging sewerage.
TUC = (C x
UC) + (SDF x C x UCs)
Where: TUC = Total
Usage Charges ($)
C = Water
Consumption (kilolitres)
C = Water
Usage Charge ($)
UCs = Sewerage
Usage Charge ($)
SDF = Sewerage
Discharge Factor (%)
Non-Residential
Property discharging Sewerage & Trade Waste
The
following formula indicates how total usage charges would be calculated for a
non-residential property consuming water and discharging both sewerage and
liquid trade waste.
TUC = (C x
UC) + (SDF x C x UCs) + (TWDF x C x UCt)
Where: TUC = Total
Usage Charges ($)
C = Water
Consumption (kilolitres)
UC = Water
Usage Charge ($)
UCs = Sewerage
Usage Charge ($)
UCt = Liquid
Trade Waste Usage Charge ($)
SDF = Sewerage
Discharge Factor (%)
TWDF = Trade
Waste Discharge Factor (%)
On-Site
Sewerage Management Systems (OSMS) – Approval to operate Annual Fee
Commencing
from 1 July 2013, Council will charge an annual fee for the Approval to Operate
(ATO) an Onsite Sewer Management System (OSMS) that will be disclosed on the
rate notice issued to each relevant ratepayer. The annual fee to be
charged is related to the application for or renewal of approval to operate an
OSMS. The fee per annum implemented for 2016/17 is to be $44.00
per OSMS or Equivalent Tenement. It is expected the fee will raise $151,580
per annum to be spent specifically on the management of OSMS systems by
Council. This process will replace the current application based process
for the renewal of an ATO.
In adopting
the 2015/16 OSMS fee, Council also resolved (13-135) to develop a revised
fee structure for the renewal of an ATO based on a tiered range of fees according
to the pollution risk (ie high / medium / low), which will determine the
frequency for inspections. This fee structure will be developed over time and
implemented in a future financial period.
The revenue
generated by the fees collected will be restricted with the funds generated
used to fund OSMS related programs and activities, including an OSMS education
and assessment program.
Asset
Replacement Programs
Plant
and Equipment
Plant and
equipment to be disposed of or replaced has either reached the end of its
economic life or is no longer required for Council's operations.
Motor
Vehicles
Council's
sedan type vehicles are traded at the time considered the most economically
viable, taking into account age, kilometres travelled, changeover costs and market
demands.
Land
Assets
Council has
identified property for review and potential sale in its Financial
Sustainability Project Plan. Potential sale of property may occur from
time to time.
Pricing
Policy/Competitive Neutrality
Council's
Pricing Policy is to recover full costs for consumer specific services except
where a community service obligation exists to justify charging less than full
costs. Full cost attribution is applied to all business activities. The
following programs are considered to be of a commercial nature:
Category
One Businesses
(Turnover
greater than $2 million)
1. Water
Supplies
2. Sewerage
Services
3. Caravan
Parks
BORROWINGS
New Loan
Borrowings
It
is anticipated that the following projects will be funded from new loan
borrowings in 2016/2017:
Item ($'000)
General Fund $Nil
Water Fund $Nil
Sewer
Fund $Nil
Total $Nil
APPENDIX 1
COMMUNITY
STRATEGIC PLAN, DELIVERY PROGRAM AND OPERATIONAL PLAN LINKAGES
|
Delivery
Program Key Activities
|
OPERATIONAL
PLAN ACTIONS
|
Community
Strategic Plan Strategies
|
|
General Manager
|
Corporate and
Community
Services
|
Infrastructure
Services
|
Sustainable
Environment
and Economy
|
|
1
|
Develop and implement the
revised organisational structure.
|
|
|
|
|
CM1.3
|
|
2
|
Shift Council culture from
compliance/risk aversion to being solution and outcome focused.
|
|
|
|
|
CM1.5
|
|
3
|
Improve the capacity of staff
in areas of customer service, consultation, technology and leadership.
|
76, 78, 79
|
94, 95, 97
|
|
|
CM1.1
|
|
4
|
Develop and implement Balance
Scorecard Performance Planning and Management System.
|
82
|
|
|
|
CM1.1
|
|
5
|
Initiate targeted employee
engagement programs.
|
76
|
|
|
|
CM1.5
|
|
6
|
Develop and implement targeted
and effective staff development initiatives.
|
76, 78, 82, 83
|
|
|
|
CM1.5
|
|
7
|
Achieve active participation
in a suite of targeted recognition and encouragement programs.
|
83
|
|
|
|
CM1.5
|
|
8
|
Improve work health and
safety.
|
84
|
|
|
|
CM1.5
|
|
9
|
Increase lifestyle health and
wellbeing initiatives for staff.
|
84
|
|
|
|
CM1.5
|
|
10
|
Implement best practice in
Integrated Planning and Reporting.
|
85
|
91
|
2, 6, 10
|
|
CM1.4
|
|
11
|
Embed Integrated Planning and
Reporting in Council policies and systems.
|
85
|
91
|
|
|
CM1.1
|
|
12
|
Provide advice and disseminate
information to internal stakeholders.
|
|
99, 100
|
|
|
CM1.3
|
|
13
|
Embrace digital technologies
to increase community access and broaden engagement.
|
|
|
47
|
|
CM2.1
|
|
14
|
Build the capacity of Council
to tailor engagement strategies to individual projects and initiatives.
|
76
|
|
|
|
CM2.2
EN1.1
EN1.3
EN1.4
|
|
15
|
Develop, encourage and support
community participation in volunteering in Council programs and projects.
|
|
|
|
73
|
CM2.2
SC2.1
|
|
16
|
Develop stronger regional
collaboration and strategic planning initiatives.
|
|
|
8, 10, 43-46, 50, 51
|
74,75
|
CM3.1
EC3.3
EC2.1
EC2.3
EN1.1
CI1.5
CI2.5
|
|
17
|
Develop partnerships with key
stakeholders.
|
|
91,92,93
|
33, 34
|
75
|
EC1.5
EN1.2
|
|
18
|
Support effective advocacy
through the development of productive relationships with State and Federal
government agencies.
|
|
92
|
8, 13, 33, 34
|
74
|
CM3.1
SC1.1
|
|
19
|
Ensure compliance programs are
responsive to demonstrated community needs and priorities.
|
|
|
|
60, 61
|
CM1.1
|
|
20
|
Facilitate community
understanding of Council’s regulatory and compliance obligations.
|
|
|
50, 51
|
57
|
CM4.1
EN3.6
|
|
21
|
Remove unnecessary Council
regulation/prescription.
|
|
|
|
55, 56
|
CM1.3
|
|
22
|
Promote best practice in the
delivery of environmental, natural and built outcomes.
|
|
|
42, 49 54
|
57-59, 63-66, 71-73
|
CM4.1
EN2.1
CI1.7
|
|
23
|
Ensure Council’s
information systems are efficient, effective, resilient and accessible
|
|
94, 95
|
|
|
CM1.1
|
|
24
|
Improve the Financial
Sustainability of Council through the implementation of Council’s
Financial Sustainability Project Plan.
|
80, 81
|
98-102
|
2, 3, 4, 5, 6, 7, 9, 15-26
|
|
CM1.3
|
|
25
|
Promote the development of new
and diverse industry sectors in the Shire to broaden the economic base.
|
|
|
|
63, 64, 71-73, 76, 74
|
EC1.1
EC1.5
EN3.6
EC3.5
|
|
26
|
Work in partnership with the
tertiary education sector to encourage the establishment and development of a
learning precinct/s in Byron Shire.
|
|
|
|
74
|
EC1.3
EC1.5
EN3.6
|
|
27
|
Increase understanding of
supply and demand trends, and identify opportunities for improved delivery of
sporting, cultural and recreational opportunities in the Shire.
|
|
|
14
|
|
EC1.4
SC2.1
CI1.3
CI3.4
CI4.2
|
|
28
|
Build Council’s capacity
to promote, support and facilitate sustainable and suitable events in the
Shire.
|
|
|
|
73
|
EC1.4
|
|
29
|
Investigate opportunities for
supporting public art, including indigenous public art, and the creative
industry sectors.
|
|
|
52
|
|
SC2.4
|
|
30
|
Develop strategic destination
marketing initiatives focused on visitor markets that are low impact and high
yield that complement local community values.
|
|
|
|
73
|
EC2.1
EC1.1
|
|
31
|
Enhance, facilitate and
promote appropriate tourism products designed to improve the visitor
experience and length of stay in Byron Shire.
|
|
|
47,
48
|
73, 75
|
EC1.1
EC1.2
EC2.2
EC3.1
EC3.2
|
|
32
|
Activate a diverse, safe and
vibrant night-time economy in Byron Bay.
|
|
|
|
|
EC1.1
EC1.4
EC2.1
EC2.2
SC2.2
SC2.3
SC2.4
|
|
33
|
Work with stakeholders to
implement late night safety initiatives.
|
|
|
|
|
SC2.2
|
|
34
|
Examine the most effective
means for delivering an effective and efficient library service to Byron
Shire residents.
|
|
86
|
49
|
|
SC1.2
SC2.1
|
|
35
|
Maximise utilisation and
sustainability of the Byron Regional Sport and Cultural Complex and other
Council sporting facilities.
|
|
|
39, 40
|
|
SC1.2
CI3.4
CI3.6
CI4.1
CI4.2
|
|
36
|
Develop Sport Stakeholder
Forum.
|
|
|
|
|
SC2.1
|
|
37
|
Partner with the Bundjalung of
Byron Bay Arakwal People to deliver renewed approaches and new initiatives in
line with the agreed guiding principles.
|
|
93
|
52
|
|
SC3.1
SC3.2
|
|
38
|
Deliver sustainable
residential, commercial, industrial and rural growth opportunities including
affordable housing opportunities.
|
|
|
|
63-66, 74
|
EN2.1
|
|
39
|
Facilitate the future
direction of development in Byron Bay through the development of a Byron Bay
Town Centre Masterplan.
|
|
|
27
|
|
CI1.3
|
|
40
|
Improve the amenity of public
space in towns and villages.
|
|
|
27,
35, 36-38, 49
|
|
CI1.4
CI3.4
|
|
41
|
Work with new planning
reforms.
|
|
|
|
|
EN2.1
|
|
42
|
Restore native vegetation and
improve habitat links across rural and urban landscapes.
|
|
|
|
62
|
EN1.1
EN1.2
|
|
43
|
Improve the health of the
local natural environment.
|
|
|
|
62, 67
|
EN1.1
EN1.2
|
|
44
|
Implement coastal, estuary and
waterway management strategies.
|
|
|
54
|
|
EN1.3
EN1.4
|
|
45
|
Work towards reducing
greenhouse gas emissions to meet targets of 30% reduction below 1990 levels
by 2020.
|
|
|
42, 53
|
|
EN3.1
EN3.4
EN3.5
|
|
46
|
Promote and encourage
sustainable living in the Shire.
|
|
|
41, 43-46
|
|
EN3.2
EN3.3
CI1.2
CI2.2
CI3.3
|
|
47
|
Improve neighborhood and
community connections and resilience through the support of local projects.
|
|
87-90
|
28
|
|
EN3.3
EN3.6
|
|
48
|
Leverage funds available in
State Government grants for the development of cycle ways and associated
facilities (shared paths).
|
|
|
33, 34
|
|
CI1.1
|
|
49
|
Pedestrian
and mobility access addressed.
|
|
|
|
|
CI1.1
|
|
50
|
Construct
the Byron Bay Bypass.
|
|
|
11, 12
|
|
CI1.4
|
|
51
|
Review the priorities and
methodologies for improved maintenance and renewal of public infrastructure.
|
|
|
1, 2, 3, 4, 5, 6, 7, 9, 31, 32, 53
|
|
CM1.1
CM1.3
|
|
52
|
Increase the Community’s
engagement with the development and implementation of Council’s 10 year
works program and Asset Management Plan.
|
|
|
3, 4, 9
|
|
CM1.3
CM1.4
CM2.1
|
|
53
|
Improve the preparedness for
Natural Disasters.
|
|
|
29, 30
|
|
CM1.3
CM1.4
CM2.1
|
|
54
|
Secure the long term water
supply for Byron Bay through the construction of a new reservoir at Coopers Shoot.
|
|
|
|
|
EC1.1
CI4.1
CI4.2
|
|
55
|
Upgrade the Byron Shire
Resource Recovery Centre to a modern resource recovery centre.
|
|
|
43-46
|
|
EN3.2
CI3.3
CI2.2
|
|
56
|
Introduce a new kerbside
organics collection service.
|
|
|
41, 43-46
|
|
EN3.2
CI2.2
|
CONDITIONS
OF CONSENT:
Parameters of this
Consent
1) Development
is to be in accordance with approved plans
The development is to be in
accordance with plans listed below:
|
Plan No.
|
Description
|
Prepared by
|
Dated:
|
|
DA-01
|
Site and Demolition Plan
|
Joe Davidson
|
January 2016
|
|
1
|
Floor Plan
|
G. Higginson
|
22 April 2016
|
|
2
|
Elevations
|
G. Higginson
|
22 April 2016
|
|
3
|
Elevations
|
G. Higginson
|
22 April 2016
|
|
4
|
Landscape Plan
|
G. Higginson
|
22 April 2016
|
The development is also to be in
accordance with any changes shown in red ink on the approved plans or
conditions of consent.
The approved plans and related
documents endorsed with the Council stamp and authorised signature must be kept
on site at all times while work is being undertaken.
2) Compliance
with Building Code of Australia and insurance requirements under the Home
Building Act 1989
(1) For
the purposes of section 80A (11) of the Act, the following conditions
are prescribed in relation to a development consent for development that
involves any building work:
(a) that
the work must be carried out in accordance with the requirements of the
Building Code of Australia ,
(b) in
the case of residential building work for which the Home Building Act 1989 requires there to be a
contract of insurance in force in accordance with Part 6 of that Act, that such
a contract of insurance is in force before any building work authorised to be
carried out by the consent commences.
(2) This
clause does not apply:
(a) to
the extent to which an exemption is in force under clause 187 or 188,
subject to the terms of any condition or requirement referred to in clause 187 (6) or 188
(4), or
(b) to
the erection of a temporary building.
(3) In
this clause, a reference to
the Building Code of Australia is a reference to that Code as in force on the
date the application for the
relevant construction certificate is made.
3) Erection
of signs
(1) For
the purposes of section 80A (11) of the Act, the requirements of
subclauses (2) and (3) are prescribed as conditions of a development consent
for development that involves any building work, subdivision work or demolition
work.
(2) A
sign must be erected in a prominent position on any site on which building
work, subdivision work or demolition work is being carried out:
(a) showing
the name, address and telephone number of the principal certifying authority
for the work, and
(b) showing
the name of the principal contractor (if any) for any building work and a
telephone number on which that person may be contacted outside working hours,
and
(c) stating
that unauthorised entry to the work site is prohibited.
(3)
Any such sign is to be maintained while the building work, subdivision work or
demolition work is being carried out, but must be removed when the work has
been completed.
(4) This
clause does not apply
in relation to building work, subdivision work or demolition work that is
carried out inside an existing building that does not affect the external walls
of the building.
(5) This
clause does not apply
in relation to Crown building work that is certified, in accordance with section 109R of the Act, to comply with the
technical provisions of the State’s building laws.
(6) This
clause applies to a
development consent granted before 1 July 2004 only if the building work,
subdivision work or demolition work involved had not been commenced by that
date.
Note: Principal certifying
authorities and principal contractors must also ensure that signs required by
this clause are
erected and maintained (see clause 227A
which currently imposes a maximum penalty of $1,100).
4) Notification
of Home Building Act 1989 requirements
(1) For
the purposes of section 80A (11) of the Act, the requirements of this clause are prescribed
as conditions of a development consent for development that involves any
residential building work within the meaning of the Home Building Act 1989 .
(2) Residential
building work within the meaning of the Home Building Act 1989 must not be carried out
unless the principal certifying authority for the development to which the work
relates (not being the council) has given the council written notice of the
following information:
(a) in
the case of work for which a principal contractor is required to be appointed:
(i) the
name and licence number of the principal contractor, and
(ii) the
name of the insurer by which the work is insured under Part 6 of that Act,
(b) in the
case of work to be done by an owner-builder:
(i) the
name of the owner-builder, and
(ii) if
the owner-builder is required to hold an owner-builder permit under that Act,
the number of the owner-builder permit.
(3) If
arrangements for doing the residential building work are changed while the work
is in progress so that the information notified under subclause (2) becomes out
of date, further work must not be carried out unless the principal certifying
authority for the development to which the work relates (not being the council)
has given the council written notice of the
updated information.
(4) This
clause does not apply
in relation to Crown building work that is certified, in accordance with section 109R of the Act, to comply with the
technical provisions of the State’s building laws.
5) Development
Contributions
Council resolved not
to charge Section 94 contributions for secondary dwellings under SEPP
(Affordable Rental Housing Policy) 2009 subject to the following requirements:
a) That
the maximum size of the secondary dwelling or granny flat does not exceed
60sqm.
b) That
the floor space ratio for the whole development of the site does not extend
beyond the 0.5:1 and that 25% of the site must be covered by absorbent surfaces
such as lawn or landscaping.
c) That
the secondary dwelling or granny flat does not increase the overall number of
bedrooms on the site to greater than 5.
d) That
the applicant has applied for a secondary dwelling or granny flat and
specifically advised that the development is not to be used for tourism
purposes and accepts a condition of consent to the same effect.
Section 94
Contributions have not been charged on this application based on the above
criteria. Should any of the above conditions change your development may
be referred to Council's Compliance
Department for further action.
The following conditions
are to be complied with prior to issue of a Construction Certificate
6) Water
and Sewerage - Section 68 approval required
An Approval under Section
68 of the Local Government Act 1993 to carry out water supply work and sewerage
work must be obtained.
7) Compliance
with Basix Certificate requirements
The development is to comply with
Basix Certificate No. 6981141S, dated 20 January 2016. The
commitments indicated in the Certificate are to be indicated on the plans
submitted for approval of the Construction Certificate.
The plans submitted must clearly
indicate all windows numbered or identified in a manner that is consistent with
the identification on the Basix Certificate.
Minor changes to the energy
efficiency measures may be undertaken without the issue of an amendment under
Section 96 of the Act, provided that the changes do not affect the form, shape
or size of the building.
Proposed colours must be
consistent with the provisions of Section C3.1 of Council’s Development
Control Plan 2010. Note that white colours are not permissible.
Such plans and specifications must
be approved as part of the Construction Certificate.
8) Long
Service Levy to be paid
A Long Service Levy must be paid
to the Long Service Payments Corporation. This is a State Government Levy
and is subject to change.
These payments may be made online
at www.longservice.nsw.gov.au
or at Council’s Administration
Office, Station Street, Mullumbimby. Where paying to Council, cheques are to be
made payable to ‘Byron Shire Council’.
For further information regarding
the Long Service Payment please refer to the website above.
9) Site
Waste Minimisation and Management Plan
Chapter 1: Part
F of Byron Shire Development Control Plan 2010 (DCP 2010) aims to facilitate
sustainable waste management in a manner consistent with the principles of
Ecologically Sustainable Development. Prior
to the issue of a Construction Certificate, a Site Waste Minimisation and
Management Plan (SWMMP) must be submitted outlining measures to minimise and
manage waste generated during demolition, construction and the ongoing
operation and use of the development. The
SWMMP must specify the proposed method of recycling or disposal and the waste
management service provider.
A template is
provided on Council’s website to assist in providing this information www.byron.nsw.gov.au/files/publications/swmmp_-_pro-forma-.doc)
10) Consent
required for works within the road reserve
Consent from Council must be
obtained for works within the road reserve pursuant to Section 138 of the Roads
Act 1993. Three (3) copies of engineering construction plans must accompany the
application for consent for works within the road reserve.
Such plans are to be in accordance
with Council’s current Design & Construction Manuals and are to
provide for the following works:
|
Driveway (residential areas)
|
A driveway(s) in accordance with Council's current
“Northern Rivers Local Government Development Design & Construction
Manuals and Standard Drawings”.
|
11) Internal
Driveway details required
The application for a Construction
Certificate is to include plans and specification that indicate vehicular
access from the site boundary to the proposed car space(s). Vehicular access
must be in accordance with AS 2890.1-2004: Parking facilities, Part 1:
Off-street car parking. Plans are to include the following items:
a) pavement
description;
b) site
conditions affecting the access;
c) existing
and design levels;
d) longitudinal
section from the road centreline to the car space(s);
NOTE: The plans must be in
compliance with Council's current “Northern Rivers Local Government
Development Design & Construction Manuals and Standard Drawings”.
12) Flood
Planning Level for new buildings
The flood planning level for this
development is 5.0m A.H.D. The plans and specifications to accompany the
construction certificate application are to indicate a minimum habitable floor
level that is at or above the flood planning level.
The plans and specifications to
accompany the construction certificate application are also to indicate the use
of flood compatible materials and services below the flood planning level in
accordance with the requirements of Council’s Development Control Plan
2014 – Chapter C2 – Areas Affected by Flood.
13) Certificate
of Compliance from Rous Water required – Water Management Act 2000
A Certificate of Compliance from
Rous Water is to be obtained confirming that all money payable to Rous Water in
respect to the load the development imposes on the Regional Bulk Water Supply
has been paid.
Note: Byron Shire
Council acts as Rous Water’s agent in this matter and will issue a
Certificate of Compliance on behalf of Rous Water upon payment of the Rous
Water Development Servicing Charge to this Council. The charge is
calculated as the Rous Water Development Servicing Charge per Equivalent
Tenement current at the time of payment multiplied by the assessed number of
ET’s for the development for water supply purposes. For further
information about the Regional Bulk Water Supply Development Servicing, please
contact Rous Water on (02) 6621 8055 or water@rouswater.nsw.gov.au
.
Copies of the application forms for
Certificates of Compliance are available on Council’s website http://www.byron.nsw.gov.au/files/Forms/Section_305_Certificate.pdf
or from Council’s Administration Office. Copies of Byron Shire
Council’s Development Servicing Plans are available at Council’s
Administration Office.
14) Building
materials and colours to be specified
The application for a Construction
Certificate is to include plans and specifications that indicate the proposed
building materials and colours are consistent with the approved plans.
i. Walls
are to be constructed from weathertex cladding “Heritage’ (or
similar),
ii. Roof
is to be constructed from colourbond.
iii. Colours
are to match the existing dwelling onsite.
Such plans and specifications must
be approved as part of the Construction Certificate.
The following conditions
are to be complied with prior to commencement of building works
15) Plumbing
Standards and requirements.
All Plumbing, Water Supply, Sewerage and Stormwater Works
shall be installed in accordance with the Local Government Act 1993, Plumbers
Code of Australia and AS/NZS 3500 Parts 0-5, the approved plans (any notations
on those plans) and the approved specifications. The changes made are
from Plumbers and Drainage Regulation 2012 NSW Government.
a) The licensee is to
provide 24 hours notice and attend the site for the following INSPECTIONS,
prior to covering of work. Inspections will be carried out a mutually
convenient time:
i) Pre-start
and Sediment Control;
ii) Internal
Drainage;
iii) External
Drainage;
iv) Water
Rough In;
v) Fire
Services;
vi) Stackwork;
vii) Final - all work completed.
- * Note below.
b) A licensee is required to
provide to Council and owner of the property after completion of the work and within
48 hours, a Compliance Certificate and Sewer Services Diagram/ Works
as Executed drawings.
Note: Council will send each plumber proformas of
these documents when the Notice of Work permit has been issued by Council to
allow the plumber to commence work.
16) Erosion
and sediment measures
Where erosion of soils or runoff
of any substance is likely to occur, erosion and sedimentation controls are to
be in place in accordance with the Guidelines for Erosion & Sediment
Control on Building Sites. This may include stockpiled materials such as
sand, etc.
Any such measures that are deemed
to be necessary because of the local conditions must be maintained at all times
until the site is made stable (i.e. by permanent vegetation cover or hard
surface).
The following conditions
are to be complied with during construction
17) Construction
times
Construction works must not
unreasonably interfere with the amenity of the neighbourhood. In particular
construction noise, when audible from adjoining residential premises, can only
occur:
a) Monday
to Friday, from 7 am to 6 pm.
b) Saturday,
from 8 am to 1 pm.
No construction work to take place
on Saturdays and Sundays adjacent to Public Holidays and Public Holidays and
the Construction Industry Awarded Rostered Days Off (RDO) adjacent to Public
Holidays.
Note: Council may impose
on-the-spot fines for non-compliance with this condition.
18) Construction
Noise
Construction noise is to be
limited as follows:
a) For
construction periods of four (4) weeks and under, the L10 noise level measured
over a period of not less than fifteen (15) minutes when the construction site
is in operation must not exceed the background level by more than 20 dB(A).
b) For
construction periods greater than four (4) weeks and not exceeding twenty‑six
(26) weeks, the L10 noise level measured over a period of not less than fifteen
(15) minutes when the construction site is in operation must not exceed the
background level by more than 10 dB(A)
Note: Council may impose
on-the-spot fines for non-compliance with this condition.
19) Builders
rubbish to be contained on site
All builders rubbish is to be
contained on the site in a ‘Builders Skips’ or an enclosure.
Footpaths, road reserves and public reserves are to be maintained clear of
rubbish, building materials and all other items.
20) Demolition
Any required
demolition works must be undertaken in accordance with the relevant
requirements of Australian Standard AS 2601–1991: The Demolition of
Structures published by Standards Australia, and the WorkCover Authority of
NSW.
The following conditions
are to be complied with prior to issue of a Final Occupation Certificate
21) Works
to be completed prior to issue of a Final Occupation Certificate
All of the works indicated on the
plans and approved by this consent, including any other consents that are
necessary for the completion of this development, are to be completed and
approved by the relevant consent authority/s prior to the issue of a Final
Occupation Certificate.
Any Security bond paid for this
application will be held until Council is satisfied that no further works are
to be carried out that may result in damage to Councils road/footpath reserve.
22) Stormwater
disposal
Stormwater must be collected and
disposed of in a controlled manner such that stormwater flows are:
a) Clear
of buildings and infrastructure,
b) Not
concentrated so as to cause soil erosion, and
c) Not
onto adjoining land.
23) Floor
Levels – Certification for Flooding
Prior to the issue of an
Occupation Certificate, a certificate from a registered surveyor must be submitted
to the Principle Certifying Authority confirming the height of habitable and
non-habitable floors. An Occupation Certificate must not be issued unless the
floor levels are at or above the relevant flood planning levels.
The following conditions
are to be complied with at all times
24) No
subdivision - Secondary Dwelling
In accordance with clause 24 of
the State Environmental Planning Policy (Affordable Rental Housing) 2009,
subdivision of the subject land is not to occur.
25) Relationship
to Principal Dwelling
The
secondary dwelling must remain on the same lot as the principal dwelling.
26) Use
of Secondary Dwelling
The secondary
dwelling is not approved for holiday letting and/or for the use as a tourist
facility.
27) No
more than the principal dwelling and secondary dwelling
There must not
be any dwelling on the land other than the principal dwelling and the secondary
dwelling.
28) Flood
Evacuation Plan
A copy of the approved flood
evacuation plan is to be laminated in clear plastic and displayed in a
prominent location within the development (e.g. Kitchen, office).
CONDITIONS
OF CONSENT:
Parameters of this
Consent
1) Development
is to be in accordance with approved plans and documents
The development is to be in
accordance with plans listed below:
|
Plan No.
|
Description
|
Prepared by
|
Dated:
|
|
DA - 18
|
Demolition Plan
|
Koho Projects Pty Ltd
|
1 April 2016
|
|
DA - 03
|
Site Plan
|
Koho Projects Pty Ltd
|
17 May 2016
|
|
DA - 04
|
Floor Plan
|
Koho Projects Pty Ltd
|
17 May 2016
|
|
DA - 05
|
Type A Unit - Detail
|
Koho Projects Pty Ltd
|
17 May 2016
|
|
DA - 06
|
Type B Unit - Detail
|
Koho Projects Pty Ltd
|
17 May 2016
|
|
DA - 07
|
Type C Unit - Detail
|
Koho Projects Pty Ltd
|
17 May 2016
|
|
DA - 08
|
Elevations
|
Koho Projects Pty Ltd
|
9 June 2016
|
|
DA - 09
|
Typical Section
|
Koho Projects Pty Ltd
|
9 June 2016
|
|
DA - 13
|
Landscape Concept Plan
|
Koho Projects Pty Ltd
|
17 May 2016
|
|
|
Site Waste Minimisation and Management Plan
|
Duncan Band
|
12.10.15
|
The development is also to be in
accordance with any changes shown in red ink on the approved plans or
conditions of consent.
The approved plans and related
documents endorsed with the Council stamp and authorised signature must be kept
on site at all times while work is being undertaken.
2) Residential
use
This development consent allows
only for the purposes of multi dwelling housing. Nothing within this
development consent allows for the development to be used as tourist and
visitor accommodation.
3) Provision
of Affordable Housing
For ten (10) years from the date
of the issue of an Occupation Certificate for the subject development all three
(3) dwellings are to be used only for the purposes of ‘affordable
housing’ (as defined in the Environmental Planning and Assessment Act
1979 and State Environmental Planning Policy [Affordable Rental Housing]
2009), and these dwellings are to be managed by a registered community
housing provider (registered community housing provider has the same
meaning as in the Housing Act 2001).
4) Compliance
with Building Code of Australia and insurance requirements under the Home
Building Act 1989
(1) For
the purposes of section 80A (11) of the Act, the following
conditions are prescribed in relation to a development consent for development
that involves any building work:
(a) that
the work must be carried out in accordance with the requirements of the
Building Code of Australia ,
(b) in
the case of residential building work for which the Home Building Act 1989
requires there to be a contract of insurance in force in accordance with Part 6
of that Act, that such a contract of insurance is in force before any building
work authorised to be carried out by the consent commences.
(2) This
clause does not apply:
(a) to
the extent to which an exemption is in force under clause 187 or 188,
subject to the terms of any condition or requirement referred to in clause 187 (6) or 188
(4), or
(b) to
the erection of a temporary building.
(3) In
this clause, a reference to
the Building Code of Australia is a reference to that Code as in force on the
date the application for the
relevant construction certificate is made.
5) Erection
of signs
(1) For
the purposes of section 80A (11) of the Act, the
requirements of subclauses (2) and (3) are prescribed as conditions of a
development consent for development that involves any building work,
subdivision work or demolition work.
(2) A
sign must be erected in a prominent position on any site on which building
work, subdivision work or demolition work is being carried out:
(a) showing
the name, address and telephone number of the principal certifying authority
for the work, and
(b) showing
the name of the principal contractor (if any) for any building work and a
telephone number on which that person may be contacted outside working hours,
and
(c) stating
that unauthorised entry to the work site is prohibited.
(3)
Any such sign is to be maintained while the building work, subdivision work or
demolition work is being carried out, but must be removed when the work has
been completed.
(4) This
clause does not apply
in relation to building work, subdivision work or demolition work that is
carried out inside an existing building that does not affect the external walls
of the building.
(5) This
clause does not apply
in relation to Crown building work that is certified, in accordance with
Section 109R of the Act, to comply
with the technical provisions of the State’s building laws.
(6) This
clause applies to a
development consent granted before 1 July 2004 only if the building work,
subdivision work or demolition work involved had not been commenced by that
date.
Note: Principal certifying
authorities and principal contractors must also ensure that signs required by
this clause are
erected and maintained (see clause 227A
which currently imposes a maximum penalty of $1,100).
6) Notification
of Home Building Act 1989 requirements
(1) For
the purposes of section 80A (11) of the Act, the
requirements of this clause are prescribed
as conditions of a development consent for development that involves any
residential building work within the meaning of the Home Building Act 1989 .
(2) Residential
building work within the meaning of the Home Building Act 1989
must not be carried out unless the principal certifying authority for the
development to which the work relates (not being the council) has given the
council written notice of the
following information:
(a) in
the case of work for which a principal contractor is required to be appointed:
(i) the
name and licence number of the principal contractor, and
(ii) the
name of the insurer by which the work is insured under Part 6 of that Act,
(b) in the
case of work to be done by an owner-builder:
(i) the
name of the owner-builder, and
(ii) if
the owner-builder is required to hold an owner-builder permit under that Act,
the number of the owner-builder permit.
(3) If
arrangements for doing the residential building work are changed while the work
is in progress so that the information notified under subclause (2) becomes out
of date, further work must not be carried out unless the principal certifying
authority for the development to which the work relates (not being the council)
has given the council written notice of the
updated information.
(4) This
clause does not apply
in relation to Crown building work that is certified, in accordance with
Section 109R of the Act, to comply
with the technical provisions of the State’s building laws.
7) Television
reception system
A single common television
reception system provided with a design to minimise adverse visual impacts
whilst enabling high quality reception for each dwelling.
8) External
lighting installation
To maintain
safe access, adequate lighting must be provided between sunset and 12.00
PM. All external lighting must be installed in accordance with
AS4282-1997: Control of the obtrusive effects of outdoor lighting.
9) No
Interference with Amenity of Neighbourhood
The proposed use of the premises shall
not interfere with the amenity of the neighbourhood by reason of noise,
vibration, smell, fumes, smoke, dust, wastewater or otherwise. In particular:
a) The
noise level emanating from the use of the premises must comply with the New
South Wales Industrial Noise Policy.
b) Only
clean and unpolluted water is permitted to be discharged to Councils’
stormwater drainage system or any waters.
The following conditions
are to be complied with prior to issue of a Construction Certificate
10) A
Demolition Management Plan must be submitted to Council for approval
An Environmental Management Plan
(EMP) must be submitted to Council for approval prior to an demolition works
commencing. The EMP must be prepared by a suitably qualified professional
and contain details of measures to be undertaken to ensure that demolition
works do not result in any off-site impacts that could interfere with
neighbourhood amenity by reason of noise, vibration,
smell, fumes, smoke, dust, wastewater or otherwise.
All works must be in accordance
with NSW WorkCover Authority.
11) Details
of the garbage, composting and recycling storage area required
Details of the waste storage area
(garbage, recycling and green bins) are required to be shown on the
construction certificate drawings. The details are to include a concrete slab
on ground for the waste storage area shown on the approved Site Plan referred
to in Condition No.1.
12) Boundary
fencing
Boundary fencing along the
northern, southern and western boundaries is to be of lapped and capped
hardwood timber construction. Fount boundary fencing (including side return
fencing, that being sides located between the front building line and the front
boundary to Stuart Street) is to be a maximum of 1.2 metres in height and
incorporate plain heritage style picket fencing.
13) Water
and Sewerage - Section 68 approval required
An Approval under
Section 68 of the Local Government Act 1993 to carry out water supply work
and sewerage work must be obtained.
14) Remediation
of contaminated land
The application for a construction
certificate must be accompanied by a Detailed Contaminated Land Assessment, and
Remedial Action Plan (if required) prepared by a suitably qualified
contaminated land specialist with experience in the remediation of contaminated
land. The Remedial Action Plan must conform to NSW EPA Guidelines for Consultants Reporting on Contaminated Sites
1997 and all other applicable standards.
The Remedial Action Plan must be
approved as part of the Construction Certificate for Building Works.
15) On-site
stormwater detention - Section 68 approval required
An approval under Section 68 of
the Local Government Act 1993 to carry out on-site detention drainage system
and connection to a Council approved drainage system.
The plans must be in compliance
with the Northern Rivers Local Government Development Design and Construction
Manuals, Byron Shire Council Comprehensive Guidelines for Stormwater Management
and relevant Australian Standards. Refer to Council’s website for copies
of Council documents.
16) Sediment
and Erosion Control Management Plan required
The application for a Construction
Certificate is to include plans and specifications that indicate the measures
to be employed to control erosion and loss of sediment from the site. Control
over discharge of stormwater and containment of run-off and pollutants leaving
the site/premises must be undertaken through the installation of erosion
control devices such as catch drains, energy dissipaters, level spreaders and
sediment control devices such as filter fences and sedimentation basins.
Such plans and specifications must
be approved as part of the Construction Certificate.
NOTE: The plans
must be in compliance with Council's current “Northern Rivers Local
Government Development Design & Construction Manuals and Standard
Drawings”.
17) Consent
required for works within the road reserve
Consent from Council must be
obtained for works within the road reserve pursuant to Section 138 of the Roads
Act 1993. Three (3) copies of engineering construction plans must accompany the
application for consent for works within the road reserve.
Such plans are to be in accordance
with Council’s current Design & Construction Manuals and are to
provide for the following works:
|
Driveways - McCoughans Lane
|
Construct 2 new driveways from the edge of pavement seal
through to the property boundary; inclusive of piped culverts with precast
concrete headwalls. The driveways are to be generally in accordance with
Council’s standard “Northern Rivers Local Government Development
Design & Construction Manuals and Standard Drawings”.
|
|
|
|
|
Road pavement and drainage – McCoughans Lane
|
A minimum 3m wide bitumen sealed pavement for the full
width of the subject site and either North to join the existing sealed
section adjoining the car park at the rear of No. 108 Stuart Street or South
to the existing bitumen sealed section at the rear of 93 Station Street. The
table drains are to be cleared out, re-profiled and stabilised.
|
|
Stuart Street
|
Remove the existing vehicle bridge over the table drain.
Replace any damaged sections of the concrete table drain in front of the
property to improve drainage along Stuart Street.
|
|
Adjustment of Services
|
The road works are to include the adjustment and/or
relocation of services as necessary to the requirements of the appropriate
service authorities and to ensure that the services are constructed flush
with the finished surface levels.
|
18) Traffic
Management Plan
Consent from Council must be
obtained for a Traffic Management Plan pursuant to Section 138 of the Roads Act
1993. The plans and specifications are to include the measures to be employed
to control traffic (inclusive of construction vehicles) during construction of
the development. The traffic control plan is to be designed in accordance with
the requirements of the Roads and Traffic Authority’s Manual, Traffic
Control at Work Sites Version 2, and the current Australian Standards, Manual
of Uniform Traffic Control Devices Part 3, ‘Traffic Control Devices for
Works on Roads’.
“The plan shall incorporate
measures to ensure that motorists using road adjacent to the development,
residents and pedestrians in the vicinity of the development are subjected to
minimal time delays due to construction on the site or adjacent to the
site”.
The traffic control plan must be
prepared by a suitably qualified and RTA accredited Work Site Traffic
Controller.
19) Car
parking layout, vehicle circulation and access plans required.
The application for a Construction
Certificate is to include plans and specification that indicate access, parking
and manoeuvring details in accordance with the plans approved by this consent.
The access, parking and
manoeuvring for the site is to comply with the requirements of Council’s
Development Control Plan 2014, AS 2890.1-2004: Parking facilities, Part 1:
Off-street car parking and AS 2890.2 – 2010 - Parking facilities, Part 2:
Off-street commercial vehicle facilities. Plans are to include, but not be
limited to, the following items:
a) pavement
description;
b) site
conditions affecting the access;
c) existing
and design levels;
d) longitudinal
section from the road centreline to the car space(s);
e) cross
sections every 15 metres;
f) drainage
(pipes, pits, on-site detention, etc.);
g) turning
paths;
h) linemarking
and signage.
i) Sight
distances for the fences at the entry onto the lane are to comply with AS
2890.1 clause 3.2.4
The engineering plans and
specifications are to be designed by a qualified practising Civil Engineer. The
Civil Engineer is to be a corporate member of the Institution of Engineers
Australia or is to be eligible to become a corporate member and have
appropriate experience and competence in the related field.
Such plans and specifications must
be approved as part of the Construction Certificate.
NOTE: The plans must
be in compliance with Council's current “Northern Rivers Local Government
Development Design & Construction Manuals and Standard Drawings”.
20) Flood
Planning Level for new buildings
The flood planning level for this
development is 4.45m A.H.D. The plans and specifications to accompany the
construction certificate application are to indicate a minimum habitable floor
level that is at or above the flood planning level.
The plans and specifications to
accompany the construction certificate application are also to indicate the use
of flood compatible materials and services below the flood planning level in
accordance with the requirements of Council’s Development Control Plan 2014
– Chapter C2 – Areas Affected by Flood.
21) Bond
required to guarantee against damage to public land
A bond of $4000 is to be paid to
Council as guarantee against damage to surrounding public land and
infrastructure during construction of the proposed development. Evidence is to
be provided to Council indicating the pre development condition of the surrounding
public land and infrastructure. Such evidence must include photographs. The
proponent will be held responsible for the repair of any damage to roads, kerb
and gutters, footpaths, driveway crossovers or other assets.
Such bond will be held until Council
is satisfied that the infrastructure is maintained/repaired to pre development
conditions and that no further work is to be carried out that may result in
damage to Council’s roads, footpaths etc.
22) Water
and Sewerage - Section 68 approval required
An Approval under Section
68 of the Local Government Act 1993 to carry out water supply work and sewerage
work must be obtained.
23) Certificate
of Compliance – Water Management Act 2000
A Certificate of Compliance will
be issued upon payment of developer charges for water and sewer as calculated
in accordance with Byron Shire Council and Rous Water Development Servicing
Plans.
Byron Shire Council acts as Rous
Water’s agent in this matter and will issue a Certificate of Compliance
on behalf of Rous Water upon payment of the Rous Water Development Servicing
Charge to this Council.
Note: Copies of the
application forms for Certificates of Compliance are available on
Council’s website http://www.byron.nsw.gov.au/files/Forms/Section_305_Certificate.pdf
or from Council’s Administration Office. Copies of Byron Shire
Council’s Development Servicing Plans are available at Council’s
Administration Office.
Developer charges will be calculated in
accordance with the Development Servicing Plan applicable at the date of
payment. A check must be made with Council to ascertain the current rates by
contacting Council’s Principal Engineer Systems Planning, Water on 02
6626 7081. Applicable charges can be found on Council’s website: http://www.byron.nsw.gov.au/development-contributions-plans-section-94-and-64
The contributions payable will
be adjusted in accordance with relevant plan and the amount payable will be
calculated on the basis of the contribution rates that are applicable at the
time of payment. Payment by Personal or Company Cheque will not be accepted.
24) Compliance
with BASIX Certificate requirements
The development is to comply with
BASIX Certificate No.716163M_02, dated 10 June 2016. The commitments indicated
in the Certificate are to be indicated on the plans submitted for approval of
the Construction Certificate.
The plans submitted must clearly
indicate all windows numbered or identified in a manner that is consistent with
the identification on the BASIX Certificate.
Minor changes to the energy
efficiency measures may be undertaken without the issue of an amendment under
Section 96 of the Act, provided that the changes do not affect the form, shape
or size of the building.
Proposed external
colours/materials must be consistent with those shown on the approved plans
referred to in Condition No.1 of this consent. Such plans and specifications
must be approved as part of the Construction Certificate.
25) Developer
Contributions to be paid
Contributions set out in the
schedule at the end of this consent are to be paid to Council prior to the
release of a construction certificate. Contributions are levied in
accordance with the Byron Shire Developer Contributions Plan 2012 (as
amended).
The Plan may be viewed on line at http://www.byron.nsw.gov.au/
or during office hours at the Council Offices located at Station Street,
Mullumbimby. These contributions are to fund public amenities and
services as listed in the schedule. Additional details on the specific
amenities are to be found in the Byron Shire Developer Contributions Plan 2012
(as amended).
The contributions
in the schedule are current at the date of this consent. The
contributions payable will be adjusted in accordance with the relevant plan and
the amount payable will be calculated on the basis of the contribution rates
that are applicable at the time of payment. The schedule contains a
date for which the schedule remains valid, after this date you will have to
contact Council for an updated schedule. Payments will only be accepted by cash
or bank cheque.
26) Landscaping
plan required
The application for a Construction
Certificate is to include plans and specifications that indicate the
landscaping of the site. Such landscaping plan must incorporate adequate
detail to demonstrate compliance with the provisions of Chapter B9
(Landscaping) of Byron Development Control Plan 2014. Species are to be chosen
from Byron Council’s Native Species Planting Guide, available at www.byron.nsw.gov.au/publications/native-species-planting-guide.
The landscaping plan must indicate:
a) proposed
location for planted shrubs and trees
b) botanical
name of shrubs and trees to be planted
c) mature
height of trees to be planted
d) location
of grassed and paved areas, and
e) The
plan is to be prepared by a suitably qualified person/s who has appropriate
experience and competence in landscaping.
f) The
area of proposed landscaping of indigenous or low water use species as
specified on the BASIX Certificate.
Such plans and
specifications must be approved as part of the Construction Certificate.
The following conditions
are to be complied with prior to commencement of building works
27) Traffic
Management Plan
The approved traffic management
plan is to be implemented.
28) Builders
rubbish to be contained on site
All
builders rubbish is to be contained on the site in a ‘Builders
Skips’ or an enclosure. Footpaths, road reserves and public reserves are
to be maintained clear of rubbish, building materials and all other items.
29) Prevention
of water pollution
Only clean and unpolluted water is
to be discharged to Council’s stormwater drainage system or any
watercourse to ensure compliance with the Protection of Environment Operations
Act.
30) Erosion
and Sediment Control Management Plan required
Erosion and sedimentation controls
are to be in place in accordance with the approved Erosion and Sediment Control
Plan.
Sediment and erosion control
measures in accordance with the approved Erosion and Sedimentation Control
plan/s must be maintained at all times until the site has been stabilised by
permanent vegetation cover or hard surface.
Any such measures that are deemed
to be necessary because of the local conditions must be maintained at all times
until the site is made stable (i.e. by permanent vegetation cover or hard
surface).
Note: Council may impose
on-the-spot fines for non-compliance with this condition.
31) Remediation
of contaminated land (if required)
Prior to the commencement of any
works associated with this development consent, the following is required:
a) A
suitably qualified contaminated land specialist with experience in the
remediation of contaminated land must be engaged by the proponent to oversee
and be responsible for all works associated with the implementation of the
Remedial Action Plan and subsequent site and soil validation.
b) A
notice of commencement of the remediation work and a copy of the Remedial
Action Plan must be provided to Council’s Health and Environment Section
prior to commencement of the -work.
c) The
notice of commencement must include contact details of the responsible person,
including an emergency 24-hour phone number.
32) Remediation
of contaminated land
If required remedial works must be undertaken in
conformance with the approved Remedial Action Plan and NSW EPA Guidelines
for Consultants Reporting on Contaminated Sites 1997 and all other
applicable standards.
33) Removal
of wastes
All wastes
associated with these works are to be handled and disposed of in accordance
with the requirements of the Work Cover Authority. The applicant/owner is to
produce documentary evidence that this condition has been met. Wastes must be
disposed of at a Licensed Waste Facility. All wastes removed from the
site must be managed and disposed of in accordance with NSW DECC Waste
Classification Guidelines (2014) www.environment.nsw.gov.au/resources/waste/08202classifyingwaste.pdf
34) Erosion
& sediment measures
Erosion and
sedimentation controls are to be in place in accordance with the Guidelines
for Erosion & Sediment Control on Building Sites. A summary of these
guidelines is attached. A full copy may be downloaded from Council’s web
site at www.byron.nsw.gov.au.
35) WorkCover
Authority
All works must be undertaken in
accordance with the requirements of the WorkCover Authority.
The following conditions
are to be complied with during demolition and construction
36) Site
Waste Minimisation and Management Plan (SWMMP)
Construction works are to be
undertaken in accordance with the approved SWMMP referred to in Condition No.1
of this Development Consent.
37) Construction/demolition
times
Construction/demolition works must
not unreasonably interfere with the amenity of the neighbourhood. In particular
construction/demolition noise, when audible from adjoining residential
premises, can only occur:
a) Monday
to Friday, from 7 am to 6 pm.
b) Saturday,
from 8 am to 1 pm.
No construction/demolition work to
take place on Saturdays and Sundays adjacent to Public Holidays and Public
Holidays and the Construction Industry Awarded Rostered Days Off (RDO) adjacent
to Public Holidays.
Note: Council may impose
on-the-spot fines for non-compliance with this condition.
38) Construction/demolition
Noise
Construction/demolition noise is
to be limited as follows:
a) For
construction/demolition periods of four (4) weeks and under, the L10 noise
level measured over a period of not less than fifteen (15) minutes when the
construction site is in operation must not exceed the background level by more
than 20 dB(A).
b) For
construction/demolition periods greater than four (4) weeks and not
exceeding twenty‑six (26) weeks, the L10 noise level measured over a
period of not less than fifteen (15) minutes when the construction site is in
operation must not exceed the background level by more than 10 dB(A)
Note: Council may impose
on-the-spot fines for non-compliance with this condition.
39) Builders
rubbish to be contained on site
All builders rubbish is to be
contained on the site in a ‘Builders Skips’ or an enclosure.
Footpaths, road reserves and public reserves are to be maintained clear of
rubbish, building materials and all other items.
The following conditions
are to be complied with prior to issue of a Final Occupation Certificate
40) Works
to be completed prior to issue of a Final Occupation Certificate
All of the works indicated on the
plans and approved by this consent, including any other consents that are
necessary for the completion of this development, are to be completed and
approved by the relevant consent authority/s prior to the issue of a Final
Occupation Certificate.
Any Security bond paid for this
application will be held until Council is satisfied that no further works are
to be carried out that may result in damage to Councils road/footpath reserve.
41) Access
and parking areas to be completed.
The access and parking areas are
to be constructed in accordance with the approved plans and Roads Act consent.
42) Floor
Levels – Certification for Flooding
Prior to the issue of an
Occupation Certificate, a certificate from a registered surveyor must be
submitted to the Principle Certifying Authority confirming the height of
habitable and non-habitable floors. An Occupation Certificate must not be
issued unless the floor levels are at or above the relevant flood planning
levels.
43) Maintenance
Bond
A maintenance bond of 5% (minimum
bond amount of $1,000.00) of the value of the road works constructed is
to be lodged with Council. A copy of the contract construction cost of
the road works is to be submitted with the bond. The maintenance period is 6
months in accordance with Council’s current Design & Construction
Manuals and will commence from the date of issue of the Occupation
Certificate. The security may be provided, at the applicant's choice,
by way of cash bond or a satisfactory bank guarantee. An application in writing
for the release of the bond must be made at the satisfactory completion of the
maintenance period.
44) Record
of Infrastructure
A record of infrastructure coming
into Council ownership is to be submitted to Council. The information is
to be submitted in the form of Council’s Standard Form titled “Asset
Creation Record”. This form is available from Council’s Local
Approvals Section.
45) Water
service and meter to be connected to each dwelling
A water service and water meter
must be connected to each residential dwelling in the development using an
approved backflow prevention device. It is the applicant’s responsibility
to engage a licensed plumber who shall liaise with council during this process.
Any new water service and meter
will be at the applicants cost.
46) Sewer
and water to be connected
A Certificate of Compliance under
Section 307 of the Water Management Act 2000 is to be obtained from Byron Shire
Council prior to the issue of an Occupation Certificate for works on water
and/or sewer mains.
Application forms
are available from Council’s administration building or online at http://www.byron.nsw.gov.au/files/Forms/Section_305_Certificate.pdf
to be submitted for a Certificate of Compliance.
47) Remediation
of contaminated land (where required)
A notice of completion
must be provided to Council’s Health and Environment Section within 30 days of completion of the remediation
work. The notice of completion must be accompanied by a Validation Report
prepared by a suitably qualified person with experience in the
remediation of contaminated land.
The Validation Report must specify the standard of remediation achieved and certify that the site
is suitable for the proposed use. The report must conform to the NSW EPA Guidelines
for Consultants Reporting on Contaminated Sites 1997 and all other
statutory requirements.
Documentary evidence
must be provided confirming the method of disposal and destination of all
contaminated soil removed from the site.
· To comply with the provisions of the Local Environmental Planning
Instrument.
· To preserve the environment and existing or likely future amenity of
the neighbourhood.
· To protect the environment.
· To preserve the amenity of the area.
· To ensure adequacy of services to the development.
· In the interests of public health and safety.
· To ensure compliance with Section 68 of the Local Government Act
1993.
Schedule of
Development Contributions
The following contributions are current at
the date of this consent. The contributions payable will be adjusted in
accordance with the relevant plan and the amount payable will be calculated
on the basis of the contribution rates that are applicable at the time of
payment. The current contribution rates are available from Council offices
during office hours. Payments will only be accepted by cash or
bank cheque.

Heritage Conservation
Regard must be had to the requirements of Clause 5.10 of the
Byron Local Environmental Plan 2014. This would highlight the need to apply for
any proposed future changes to fabric, finish and appearance. Any future
changes of colour schemes of the development which may not be sympathetic to
the setting of the Mullumbimby Heritage Conservation Area must first be
approved by Byron Shire Council.
Water payments under the Water Management Act 2000
Charges will be calculated based on the additional water and
sewerage load that the proposed development generates, shown in Equivalent
Tenements (ET) by the following table:
ADDITIONAL
WATER & SEWER LOAD OF DEVELOPMENT
(ET Policy No:13/005)
NB: Information regarding Development Servicing charges can
be found on the Byron Shire Council website (http://www.byron.nsw.gov.au/development-contributions-plans-section-94-and-64).
These charges will enable you to calculate the total contribution charges
payable when you are ready to pay them. Developer charges will be
calculated in accordance with the Development Servicing Plan applicable at the
date of payment.