Water, Waste and Sewer Advisory Committee Meeting
A Water, Waste and Sewer Advisory
Committee Meeting of Byron Shire Council will be held as follows:
|
Venue
|
Conference Room, Station Street, Mullumbimby
|
|
Date
|
Thursday, 14 September 2017
|
|
Time
|
11.30am
|

Phil Holloway
Director Infrastructure Services I2017/1293
Distributed 07/09/17
What is a “Conflict of Interests” - A conflict of
interests can be of two types:
Pecuniary - an interest that a person has in a matter because of a reasonable
likelihood or expectation of appreciable financial gain or loss to the person
or another person with whom the person is associated.
Non-pecuniary – a private or personal interest that a Council
official has that does not amount to a pecuniary interest as defined in the
Local Government Act (eg. A friendship, membership of an association, society
or trade union or involvement or interest in an activity and may include an
interest of a financial nature).
Remoteness – a person does not have a pecuniary interest in a matter
if the interest is so remote or insignificant that it could not reasonably be
regarded as likely to influence any decision the person might make in relation
to a matter or if the interest is of a kind specified in Section 448 of the
Local Government Act.
Who has a Pecuniary Interest? - a person has a pecuniary interest in a
matter if the pecuniary interest is the interest of the person, or another
person with whom the person is associated (see below).
Relatives, Partners - a person is taken to have a pecuniary interest in a
matter if:
§ The person’s
spouse or de facto partner or a relative of the person has a pecuniary interest
in the matter, or
§ The person, or a
nominee, partners or employer of the person, is a member of a company or other
body that has a pecuniary interest in the matter.
N.B. “Relative”, in relation to a person means any of the
following:
(a) the
parent, grandparent, brother, sister, uncle, aunt, nephew, niece, lineal
descends or adopted child of the person or of the person’s spouse;
(b) the
spouse or de facto partners of the person or of a person referred to in
paragraph (a)
No Interest in the Matter - however, a person is not taken to have a
pecuniary interest in a matter:
§ If the person is
unaware of the relevant pecuniary interest of the spouse, de facto partner,
relative or company or other body, or
§ Just because the
person is a member of, or is employed by, the Council.
§ Just because the
person is a member of, or a delegate of the Council to, a company or other body
that has a pecuniary interest in the matter provided that the person has no
beneficial interest in any shares of the company or body.
Disclosure and participation in meetings
§ A Councillor or a member
of a Council Committee who has a pecuniary interest in any matter with which
the Council is concerned and who is present at a meeting of the Council or
Committee at which the matter is being considered must disclose the nature of
the interest to the meeting as soon as practicable.
§ The Councillor or
member must not be present at, or in sight of, the meeting of the Council or
Committee:
(a) at any
time during which the matter is being considered or discussed by the Council or
Committee, or
(b) at any
time during which the Council or Committee is voting on any question in
relation to the matter.
No Knowledge - a person does not breach this Clause if the person did
not know and could not reasonably be expected to have known that the matter
under consideration at the meeting was a matter in which he or she had a
pecuniary interest.
Participation in Meetings Despite Pecuniary Interest (S 452 Act)
A Councillor is not prevented from taking part in the consideration or
discussion of, or from voting on, any of the matters/questions detailed in
Section 452 of the Local Government Act.
Non-pecuniary Interests - Must be disclosed in meetings.
There are a broad range of options available for managing conflicts &
the option chosen will depend on an assessment of the circumstances of the
matter, the nature of the interest and the significance of the issue being
dealt with. Non-pecuniary conflicts of interests must be dealt with in at
least one of the following ways:
§ It may be appropriate
that no action be taken where the potential for conflict is minimal.
However, Councillors should consider providing an explanation of why they
consider a conflict does not exist.
§ Limit involvement if
practical (eg. Participate in discussion but not in decision making or
vice-versa). Care needs to be taken when exercising this option.
§ Remove the source of
the conflict (eg. Relinquishing or divesting the personal interest that creates
the conflict)
§ Have no involvement by
absenting yourself from and not taking part in any debate or voting on the
issue as if the provisions in S451 of the Local Government Act apply
(particularly if you have a significant non-pecuniary interest)
RECORDING OF VOTING ON PLANNING MATTERS
Clause 375A of the Local Government Act 1993
– Recording of voting on planning matters
(1) In this section, planning
decision means a decision made in the exercise of a function of a council
under the Environmental Planning and Assessment Act 1979:
(a) including a decision
relating to a development application, an environmental planning instrument, a
development control plan or a development contribution plan under that Act, but
(b) not including the making of
an order under Division 2A of Part 6 of that Act.
(2) The general manager is
required to keep a register containing, for each planning decision made at a
meeting of the council or a council committee, the names of the councillors who
supported the decision and the names of any councillors who opposed (or are
taken to have opposed) the decision.
(3) For the purpose of
maintaining the register, a division is required to be called whenever a motion
for a planning decision is put at a meeting of the council or a council
committee.
(4) Each decision recorded in
the register is to be described in the register or identified in a manner that
enables the description to be obtained from another publicly available
document, and is to include the information required by the regulations.
(5) This section extends to a
meeting that is closed to the public.
Water, Waste and Sewer Advisory Committee
Meeting
BUSINESS OF MEETING
1. Apologies
2. Declarations of Interest
– Pecuniary and Non-Pecuniary
3. Adoption of Minutes from
Previous Meetings
3.1 Water,
Waste and Sewer Advisory Committee Meeting held on 1 June 2017
4. Staff Reports
Infrastructure Services
4.1 Water
and Sewer Strategic Business Plan....................................................................... 4
4.2 Urban
Recycled Water Commercial Connections Policy.............................................. 18
4.3 Water
and Sewer Equivalent Tenement Policy Review................................................. 27
4.4 State
Government Water and Sewerage Performance Reports................................... 55
4.5 Byron
Shire Effluent Management Strategy (Draft)....................................................... 69
4.6 Update
on the Container Deposit Legislation.................................................................. 92
4.7 Vallances
Road Plan of Management............................................................................ 95
4.8 Update
on the review of Council's Integrated Waste Management and Resource Recovery
Strategy....................................................................................................................................... 152
4.9 Response
to Alan Dickens Questions........................................................................... 159
4.10 Items
For the Committee Requested by Duncan Dey................................................. 187
Staff Reports - Infrastructure Services 4.1
Staff Reports - Infrastructure Services
Report No. 4.1 Water
and Sewer Strategic Business Plan
Directorate: Infrastructure
Services
Report
Author: Peter
Rees, Manager Utilities
File No: I2017/679
Theme: Community Infrastructure
Sewerage Services
Summary:
At the Committee’s meeting held 2 March 2017, a
presentation was provided regarding the Water and Sewer Strategic Business
Plan. The presentation is now presented to the Committee again to allow
recommendation to Council. The cost increases as a result of the
resolution are generally as detailed below:-
· Sewerage:
o Mullumbimby inflow and
infiltration reduction: $500,000 p.a. for ten years (then $100,000 p.a.)
o Inflow and infiltration
investigations for other systems: $500,000 p.a. for ten years (then $100,000
p.a.)
o Effluent reuse opportunities:
$10.0 million over the next ten years
o EDC testing program: $200,000
o Energy efficiency projects:
$0.5 million over the next ten years (half for each of water supply and
sewerage)
· Water supply:
o Mullumbimby
water supply security: $5 million
o Energy efficiency projects:
$0.5 million over the next ten years (half for each of water supply and
sewerage).
The financial plans have modeled this
additional expenditure and it is affordable with the sewer and water funds
continuing to accumulate significant levels of cash over the longer term as a
result of the operational efficiencies gained over the past decade.
|
RECOMMENDATION:
That the Water Waste and Sewer Advisory
Committee note the report.
|
Report
Council via the Water Waste and Sewer Committee adopted the
following resolution below for the draft 2016 Water Supply and Sewerage
Strategic Business Plan.
Report No. 4.3 Water and Sewer
Strategic Business Plan Workshop
File No: I2017/246
Committee Recommendation 4.3.1
That at the next meeting of the Water, Waste and Sewer
Committee the following expenditure items be considered for addition to a
revised Water and Sewer Strategic Business Plan:
1. Overcome
fundamental problems in the sewer connections and lines in Mullumbimby,
Brunswick Heads and Byron Bay
2. Make
reuse (e.g. agricultural irrigation) the primary means of disposal ahead of
discharge to waterways
3. Bring
in full-spectrum testing and treatment (including alkyl-phenols) of sewage
4. Consider
minimising energy usage and the use of renewable energy (Lyon/Richardson)
The motion was put to the vote and declared carried.
Following the preparation of the draft SBP in 2016, Council
is currently preparing a review of its water supply and sewerage strategic
planning. This review aligns with the NSW
Government’s water utility best-practice requirements for a mid-term
review of the Integrated Water Cycle Management (IWCM) Strategy. The new strategic plan considers the existing IWCM
Strategy (adopted in 2009), the draft SBP and other key planning documents such
as Council’s financial plan, asset management planning and development
servicing plans and other strategic planning investigations
including sewerage system investigations, effluent reuse planning,
inflow/infiltration reduction and drinking water management planning undertaken
since 2009. The strategic plan is expected to be available for Committee
review in September 2017.
The mid-term IWCM review will provide:
· A discussion of the
status of issues identified in the IWCM Strategy Plan;
· The status of the
adopted IWCM Strategy actions;
· Water supply and
sewerage growth forecasts;
· Analysis
of water supply demand (current and future);
· Analysis
of sewerage system flows and sewage treatment plant performance; and
· Comparison of the
performance of Council’s water supply and sewerage schemes with other
local water utilities and identification of potential areas for improvement.
The review addresses the water supply and sewerage
management issues identified in the 2009 IWCM Strategy that require ongoing
effort, as follows:
· Inflow and infiltration
into the sewerage systems, particularly in Mullumbimby;
· Impacts of treated
sewage discharge on receiving waterways and additional opportunities for
effluent reuse; and
· Long-term security of
Mullumbimby water supply.
The review has also documented issues that have arisen since
the 2009 IWCM Strategy and will be investigated and addressed in
Council’s future strategic planning:
· Ocean Shores STP
capacity;
· Mullumbimby water supply
drought management; and
· Climate change
adaptation.
The potential options and recommended approach to addressing
these issues will be documented in the review.
In response to the Council resolution, additional
information is provided for each item in the following sections.
1. Overcome
fundamental problems in the sewer connections and lines in Mullumbimby,
Brunswick Heads and Byron Bay
Mullumbimby
The Mullumbimby sewerage system (and Brunswick Valley STP)
has historically experienced very high flows during dry and wet weather. In
2007 (in response to a licence pollution reduction program, PRP 1) Council
developed and adopted the Mullumbimby Sewerage System Inflow and Infiltration
Program Integrated Strategy which focused on the following areas:
· Data collection and
analysis;
· Public sewerage
infrastructure rehabilitation;
· Private sewerage
infrastructure repairs;
· Stormwater system
maintenance;
· Public education; and
· Pump station analysis
and upgrade.
In total, $1,408,870 was spent over three years. The
project has had the following positive impacts:
· A reduction in overflow
occasions by 15%.
· A reduction in overflow
volume by 39%.
The project has also demonstrated that the defects in the
system are generally in the sideline connections to the properties and the
property’s drainage infrastructure, rather than the public sewerage
mains.
Prior to the implementation of the Brunswick Area sewerage
scheme, the sewerage system overflowed for all rainfall events above the 1 in 2
year event (50 mm in 1 hour). The sewerage system now has the capacity to
transfer flows to the Brunswick Valley STP for all rainfall events at least up
to the 1 in 20 year average return interval (ARI).
Preliminary treatment of flows up to 7 times average dry
weather flow (ADWF), secondary treatment of flows up to 5.8 times ADWF and
tertiary treatment up to 3 times ADWF is provided at the Brunswick Valley
STP. However, wet weather flows up to 15 times ADWF have been recorded at
the STP.
Council is continuing to liaise with NSW Environment
Protection Authority (EPA) regarding compliance with licence conditions.
The EPA has not raised any concerns regarding compliance with the Brunswick
Heads environment protection licence since the completion of PRP 1 in 2010.
Additional options to address high flows into the
Mullumbimby sewerage system are discussed in the following table.
Table 1: Options to
address high flows in Mullumbimby sewerage system
|
Option
|
Discussion
|
Recommendation
|
|
1. Do nothing
|
The cost of sewage pumping and
treatment is increased with higher flows. Rainfall events greater than 50mm
in 1 hour will result in sewerage system overflows to the Brunswick River
(although diluted by the rainfall). High flows will also bypass the
Brunswick Valley STP treatment units and overflow directly to the Brunswick
River.
The Brunswick estuary has a
unique ecological value as it supports a high biological diversity including
several flora and fauna species identified as threatened or endangered.
The estuary and surrounding catchments also supports several significant and
important vegetation community assemblages such as wetlands, littoral
rainforest and coastal saltmarsh. The Brunswick estuary (to its tidal
limits) is within the Cape Byron Marine Park, and is formally recognised as
being significant in a local and regional sense, with regard to conservation
values.
|
There is a risk that
untreated sewage will discharge to the Brunswick River and adversely impact
the aquatic environment through high nutrient loads. The potential
volume of untreated sewage from sewerage system overflows and STP bypasses is
considered to be unacceptable over the long-term. Additional action is
therefore recommended to address the high wet weather flows.
|
|
2. Reduce illegal (private) connections into the
sewerage system
|
The Integrated Strategy
involved inspection of property connections with 61% found to have a
defect. Private sewerage infrastructure can contribute 60% of
stormwater inflow and infiltration in the sewerage system.
|
Completion of residual
corrective works to private sewers and ongoing inspection is recommended to
ensure the level of stormwater ingress is progressively decreased.
The Integrated Strategy
included education to increase understanding of the relationship between
ineffective stormwater drains that increase the level of the water table and
ultimately increase the amount of stormwater ingress into the sewerage
system.
Ongoing education is also
recommended.
|
|
3. Sewerage system upgrades to reduce stormwater
inflow into the sewerage system
|
Work on the public sewerage
system as part of the Integrated Strategy included upgrades to the
reticulation system in pumping station catchments 4001, 4002 and 4003a and
4003b.
There has been no evidence
found that the sewer mains and pipe joints are a systemic cause of stormwater
inflow. The defects in the public infrastructure are generally located
in the sideline connections to the properties. An area of particular weakness
has been found to be the connections of these sidelines to the mains.
There are minimal data on the
extent of groundwater infiltration apart from recorded high dry weather
flows.
Stormwater system maintenance
has contributed to a reduction in localised flooding which prevents
stormwater ingress into the sewerage system.
|
The condition of the
sewerage system is dynamic. Defects that result in stormwater ingress can
emerge due to deterioration and private connection works.
Ongoing public and private
sewer inspection, maintenance and/or renewal is recommended as part of
Council’s asset management planning to ensure the level of stormwater
and groundwater ingress is progressively decreased.
Ongoing analysis of flow
data, identification and repair of defects in the existing gravity system and
provision of adequate storage for peak wet weather flows is also recommended.
|
|
4. Modify the system technology to reduce sewage
flows
|
A low pressure pump system
(LPPS, retrofitting low-pressure pump units and associated pipework in place
of the current gravity sewer system) was considered as an alternative
sewerage system technology/ configuration as part of the Mullumbimby Sewerage
System Inflow and Infiltration Program Integrated Strategy.
A pump system is able to
transfer more stormwater inflow off the site and into the public sewerage
system than a gravity sewer system. Therefore, unless all the house drainage
systems upstream of the pump unit are free of defects, installation of LPPS
units in Mullumbimby could increase the amount of stormwater entering the
system in the short to medium term. With any LPPS project it would be
necessary to continue with the identification and repair of private property
drainage defects and this would need to continue for many years to keep the
system under control.
|
The retrofitting of a LPPS
to the Mullumbimby sewerage reticulation system would have a high capital
cost and will not eliminate stormwater inflow and infiltration because
defects in the upstream private sewers will continue to be a problem and
source of stormwater ingress. For these reasons and given the limited
capacity of the sewerage system, implementation of a LPPS is not recommended.
|
|
5. Upgrade Brunswick Valley
STP to treat additional wet weather flows
|
Additional storage at the
Brunswick Valley STP can increase the volume of sewage treated by reducing
STP bypasses to the river. The original scheme included additional emergency
storage and constructed wetlands with a combined storage capacity of 135 ML.
The proposed effluent storage dam was to be used to store treated effluent in
the dry months for use in reuse schemes and lowered/emptied in the wet months
to capture excess storm flows which could then be recycled through the plant
for treatment. The proposed wetlands would further treat the flows that
bypass the STP.
|
While other options for
upgrade of the STP are possible, the effluent storage dam and the wetlands
were part of the original approved project scope and are already partially
designed. They were excluded from the project scope due to financial
constraints.
The proposed transfer of
Ocean Shores sewage to Brunswick Valley STP requires additional storage at
the STP and a constructed wetland was also recommended in the design of the
transfer to provide an environmental ‘buffer’ for effluent
polishing. Regardless of the timing of the transfer of Ocean Shores sewage to
Brunswick Valley STP, it is recommended that the effluent storage dam and the
wetlands are constructed at Brunswick Valley STP as soon as possible.
|
The recommended actions for reducing
inflow/infiltration in Mullumbimby sewerage system are:
· Completion of residual
corrective works and ongoing inspection of private sewers;
· Community education;
· Ongoing public and
private sewer inspection and maintenance/renewal;
· Ongoing analysis of flow
data, identification and repair of defects in the existing gravity system and
provision of adequate storage for peak wet weather flows; and
· Construction of effluent
storage dam and wetlands at Brunswick Valley STP – capital works funding
was included in the financial planning undertaken for the SBP.
Funding of these actions will require
additional expenditure of approximately $500,000 p.a. for ten years.
Other sewerage systems
Historical data on STP inflows suggest that
groundwater and stormwater inflow and infiltration may also be high in Byron
Bay, Bangalow and Ocean Shores sewerage systems however there have been no
detailed investigations or data analysis undertaken to date. There is no
data to suggest that sewerage system overflows are a concern in these systems.
It is recommended that a data collection
and analysis program (including monitoring of sub-catchment flows and upgrade
of metering and SCADA reporting) is implemented to enable development of a
priority inflow and infiltration reduction program where required.
Rectification actions recommended from the program would also achieve the aims
of reduced energy consumption. Additional expenditure of approximately
$500,000 p.a. for ten years will be required to implement this action.
2. Make
reuse (e.g. agricultural irrigation) the primary means of disposal ahead of
discharge to waterways
The draft Byron Shire Effluent Management
Strategy (2017-2027) has been prepared to establish the path for effluent
management in the Byron Shire over the next ten years. The strategic vision is
that sewage will be managed in an ecologically sustainable way that has no
adverse impact on the natural environment, protects public health, achieves
maximum resource recovery and meets the needs and expectations of existing and
future communities. The Strategy is attached and summarised below.
Council’s experience in operating
effluent management schemes since 1999 has provided valuable insight into the
future directions of effluent management in Byron Shire. In the absence of high
water using industries and in an area that receives sufficient rainfall,
Council has been challenged to find ways to significantly increase levels of
effluent reuse. Over the next ten years Council will focus on effluent
management projects that maximise effluent application.
It is proposed wetlands and environmental
schemes will form the key direction in effluent management for the
future. These applications provide Council with the ability to
proactively manage effluent reuse to provide long-term demand security. The
successful implementation of the Byron Bay Integrated Water Management Reserve
in achieving not only high levels of effluent reuse through evapotranspiration
and seepage but also in the environmental remediation of localised acid
sulphate soil and habitat loss, has influenced Council’s key direction.
Not only do wetlands and environmental
projects have the lowest level of risks and offer the highest levels of
security for long term use, this reuse application is capable of using the
volumes of effluent required to achieve the community objectives. High
volumes of effluent would be taken up through evapo-transpiration by
well-planned wetlands of sufficient area with suitable species for the local
hydrology.
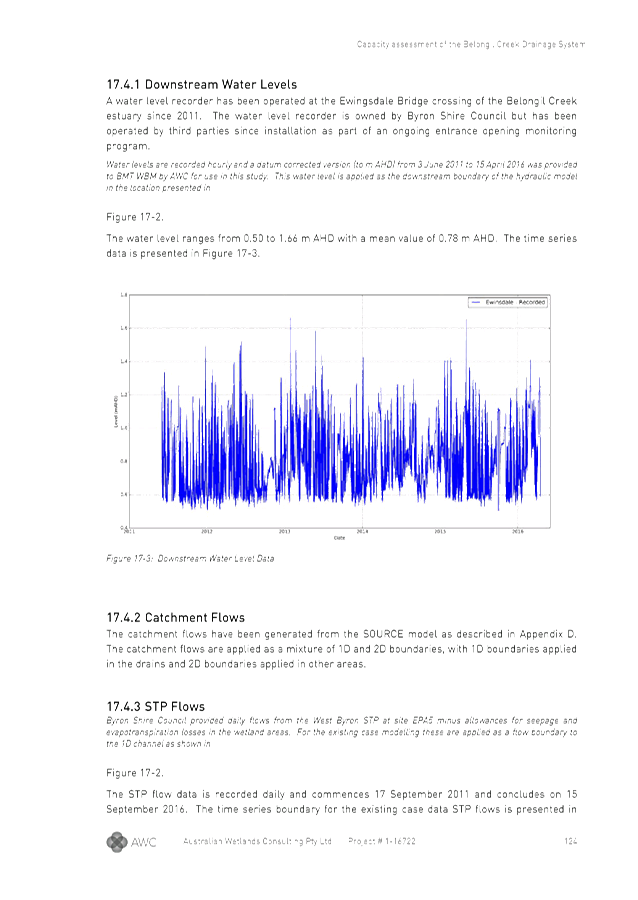
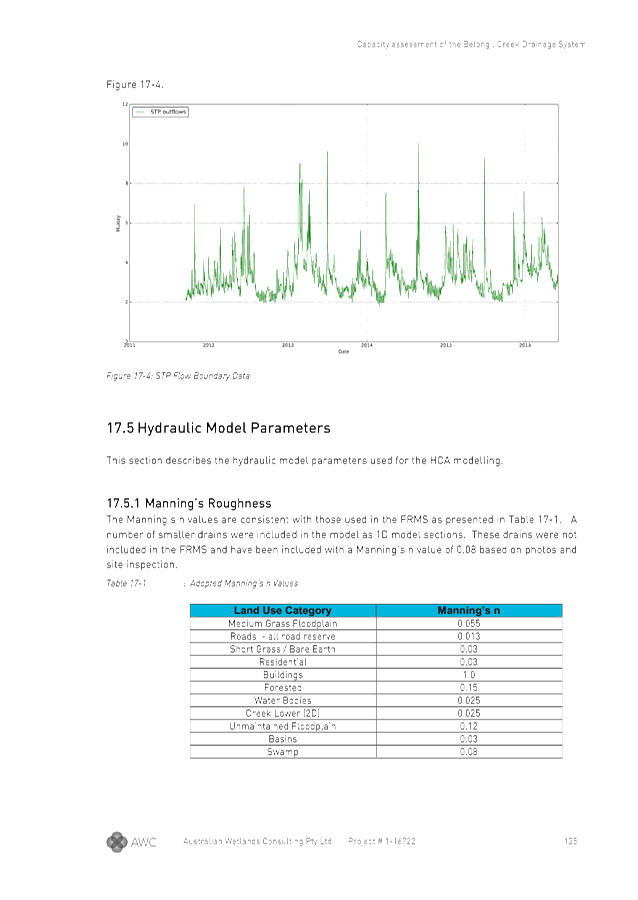
.
Council has also commenced investigations
into other viable Council controlled land applications that have the potential
to achieve high levels of effluent reuse. The Biomass Hub project has provided
Council with a unique opportunity for maximising the
evapotranspiration of effluent. The prospect of using the effluent for the
irrigation of a biomass crop to be harvested for bioenergy production is
emerging as one of the preferred effluent management strategies. According to
the Zero Emissions Byron report, bioenergy could provide for 28 % of the
Shire’s electricity needs. This project provides Council with an
opportunity to showcase sustainability and significantly contribute to its zero
emissions target.
The Byron Bay Urban Recycled Water Scheme
will continue to be developed to full capacity. All sporting fields and
nurseries along the Urban Corridor use recycled water for irrigation purposes and
recently the scheme has been extended to include flushing of public toilets
with the local hotels and caravan parks expected to connect in the near future.
An upgrade to the system will be considered based on demand, although it is
considered growth will be small and incremental. Urban schemes are not
considered viable for the smaller villages including Brunswick Valley, Bangalow
or Ocean Shores and will not be pursued.
The Council operated rural scheme, Main Arm
Recycled Water Scheme, has been the least successful effluent management
application with the scheme failing to meet community aspirations. In theory,
rural reuse projects are able to utilise high volumes of effluent, however the
uncertainty with the operation of rural schemes due to external limitations
such as high rainfall and the business drivers of private landowners increases
the risks associated with the development of rural schemes.
Previous reliance on small businesses and
farming enterprises has not provided the long-term demand for recycled water
that the Byron community desires. To maximise the
opportunities for agricultural reuse, Council will continue to investigate
rural reuse in the Byron Bay Scheme and will support farming enterprises in
suitable locations.
The proposed strategy for effluent reuse
over the next ten years is shown in Table 2. Further investigations including
land acquisition and concept development of the schemes are required to be
undertaken. Cost estimates have not yet been developed although a budget estimate
of $10.0 million has been assumed for the next ten years.
Table 2: Key directions for effluent reuse over the
next ten years
|
Existing
Scheme
|
Current
Reuse (average % of STP inflow)
|
Proposed
Scheme Development
|
2027
Targets
|
|
Byron Bay
|
|
· Urban reuse – dual reticulation for toilet
flushing and open space irrigation
· Integrated Water Management Reserve –
constructed and natural wetland regeneration
|
· 270 ML/, 15% (urban)
· 400 ML/a, 23% (wetlands)(1)
· 30 ML/a, 2% (on-site and tanker transfer):
Total: 700 ML/a (38%)
|
· Expansion of urban reuse scheme to full capacity
· Expansion of constructed wetlands within Belongil
Creek catchment
· New rural scheme (western corridor)
|
· Urban: 330 ML/a
· Additional 20ha (200 ML/a) wetland by 2019.
· Future 60ha (600 ML/a) to be identified.
· Rural (Western Corridor) (250 ML/a)
Total: 1,800 ML/a (81%)(1)
|
|
Brunswick Valley
|
|
· Main Arm – pasture and fodder irrigation (2
farms)
|
· 60 ML/a, 8% (irrigation)
· 3 ML/a, 0.4% (on-site):
Total: 63 ML/a (8.4%)
|
· Expansion of rural scheme
· New wetland regeneration and biomass cropping scheme
(Sustainability Reserve)
· Ocean Shores wetlands
|
· Rural expansion unknown
· 100 ML/a for wetlands
· 400 ML/a for biomass cropping
· 100 ML/a via Ocean Shores wetlands
Total: 663 ML/a (48%)(1)
|
|
Existing
Scheme
|
Current
Reuse (average % of STP inflow)
|
Proposed
Scheme Development
|
2027
Targets
|
|
Bangalow
|
|
· Bamboo plantation (5.23 ha)
|
· 18 ML/a, 13%
|
· Biomass cropping
|
· Additional 15 ha (150 ML/a)(1)
Total: 168 ML/a (100%)
|
|
Ocean Shores
|
|
· Wetlands
|
Not monitored
|
· STP to be decommissioned.
· Constructed wetland regeneration (treated effluent
from Brunswick Valley STP to upgraded Ocean Shores wetlands)
|
Included above.
|
|
· All STPs
|
2,630 ML/a
|
1.
Assumed evapotranspiration through wetlands. The remainder is discharged via
surface water or groundwater.
3. Bring in
full-spectrum testing and treatment (including alkyl-phenols) of sewage
Currently sewage is monitored for treatment
plant operational control as well as discharge compliance testing in accordance
with EPA licences. Parameters currently tested by
Council include biochemical oxygen demand, chemical oxygen demand, faecal coliforms, nitrogen, phosphorous, pH, solids, chlorine, alkalinity,
conductivity and sulfide.
Alkyl-phenols can imitate the action of
natural estrogens and are an example of endocrine disrupting compounds (EDCs)
which are natural or synthetic chemicals that interact with the
endocrine system altering its normal functioning. Common
examples are nonylphenols found in surfactants, detergents, cosmetics and
spermicides that can be present in STP effluent and other point sources. It
has been assumed that EDCs are the focus of this part of the Council
resolution. Background information on EDCs and their
potential presence in municipal sewage and treated effluent discharges is
provided below.
There are three broad categories of EDCs:
· Natural compounds such
as estrogens, androgens, and plant-derived phytoestrogens;
· Synthetic steroidal
hormones designed to target the endocrine system such as 17-alpha
ethinylestradiol (the contraceptive pill)and other pharmaceutical products; and
· Synthetic chemicals
(xenoestrogens), representing a diverse range of compounds including
pesticides, dioxins, Polychlorinated Biphenyls (PCBs) , Polyaromatic
Hydrocarbons (PAHs), phenols and several heavy metals. These compounds
differ from natural and synthetic hormones as they were never intended to
produce estrogenic effects in organisms.
The endocrine system in living organisms
regulates the production of hormones responsible for controlling a number of
important bodily functions including metabolism, reproduction and tissue
function. EDCs can be released from a range of point sources including
STPs, pulp and paper mills, intensive animal operations (feedlots, piggeries
etc.) and industrial sites as well as diffuse sources such as landfill leachate
and agricultural runoff from land treated with pesticides.
STPs are known as sources of EDC compounds,
particularly natural and steroidal hormones that are passed from humans to
wastewater. Australian guidelines for managing risks in recycled water include
EDCs as an emerging hazard found in sewage for which there is insufficient
toxicological information.
The National Guidelines for Water Recycling
state that EDCs have been shown to affect aquatic biota but there is no
evidence that environmental exposure to low levels of potential EDCs affects
human health. The World Health Organisation has
published the latest research on EDCs including a summary for decision makers (http://www.who.int/ceh/risks/cehemerging2/en/).
It has been shown in Australian studies
(e.g. Williams et al., 2007) that the technology used at STPs has an
influence on the concentrations of EDCs in the effluent discharged. The
available literature suggests that tertiary treatment is the most effective in
the removal of xenoestrogens and treatment with aerobic processes was more
effective than systems with anaerobic processes. Conventional
coagulation/sedimentation/filtration processes are capable of removing large
percentages of some compounds. Bioreactors, UV disinfection and oxidation
ditches also have reasonable removal rates. The removal of steroidal estrogen
is significantly lower than xenoestrogen removal with any treatment technology
employed.
West Byron and Brunswick Valley STPs utilise oxidation and aerobic secondary treatment with UV disinfection. Effluent
reused for urban applications from Byron Bay is also disinfected with chlorine
and filtered. Effluent reused for agricultural applications (Main Arm) is also
disinfected with chlorine. Bangalow STP is a membrane bioreactor (MBR)
plant. Ocean Shores STP is an intermittently decanted extended aeration plant
(biological treatment) with wetland polishing and UV disinfection.
A 2008 investigation of EDCs in Evans Head STP effluent
(Hydrosphere Consulting, 2008) found that there were very low levels of estrogenicity
in the STP effluent and the receiving environment and that it was highly
unlikely that EDCs were leading to adverse biological effects in organisms
living in the receiving environment.
Another 2008 study (Coleman et al.) to determine the
estrogenic and androgenic activities of raw and treated sewage from STPs run by
MidCoast Water measured estrogenic and androgenic activities. Secondary
treatment (using activated sludge) removed the majority of the estrogenic
(female sex hormones) and androgenic (male hormonal characteristics) activity
(up to 99%).
Tertiary treatment by UV disinfection removed varying levels
of estrogenic (19-69%) and androgenic (5-55%) activities. An MBR STP also
utilising electro-chlorination removed over 87% of the estrogenic activity and
over 98% of androgenic activity from raw sewage samples. However, levels which
could be biologically significant still remained after secondary and tertiary
treatment. On the basis of the available research, it is expected that Byron
Shire’s STPs would provide some removal of EDCs.
The current methods for detecting EDCs are:
· Biological testing,
using biomarkers and bioassays - A number of screening techniques have been
developed to screen for estrogenic activity. Some of the more commonly used
screening assays are the reporter gene assays such as the yeast estrogen screen
(YES, a yeast screen bioassay was employed in the MidCoast Water study), the
estrogen responsive chemically activated luciferase reporter gene expression
(ER-CALUX®) assays (employed in the Evans Head study) and the GeneBLAzer
battery of tests;
· Chemical analysis of raw
water samples to screen for selected EDC compounds - Field-based EDC monitoring
programs are generally based on the collection of discrete water samples, which
are often repeated over space and time to account for system variability (e.g.
monthly). There are a number of limitations in such an approach based on
chemical analysis of water samples including cost and time requirements, lack
of availability of suitable analytical methods for compounds such as hormones
and pharmaceutical products, the estrogenic potency of EDC mixtures which is
not detected by discrete EDC testing and the biodegradation of samples; and
· Whole fish studies -
Chemical analyses may detect chemicals that have the potential to affect the
endocrine systems of organisms but do not determine if detected chemicals are
having an impact on the system, or the nature of impacts. Whole fish
studies look for direct impacts in the receiving environment and take into
account multiple processes occurring in the environment such as
bioavailability, effects of mixtures of different EDCs on organisms and
metabolism and the effects of long-term exposure. However, whole fish
studies are expensive and studies conducted in isolation will not allow for any
effects to be isolated from effects due to other factors.
The recommended initial aim of any EDC testing program is to
assess the potential estrogenicity of water and sediment samples to give an
indication of the risk of EDCs to the environment. The use of bioassays offers
a relatively simple, standardised and cost-effective methodology to assess
potential estrogenicity of raw water samples. The main advantage of this
method for preliminary assessment is that rather than trying to detect the
presence of possible EDCs in water samples that could involve several hundred
potential chemicals that may or may not be affecting biota, the test determines
whether there is potential estrogenicity in samples.
If required, further work could be carried out to pin-point
particular chemical(s) either at the time of the initial screening tests or as
a second stage in investigations. Whole fish studies could also be
undertaken to detect morphological changes to organisms in the system as a
second or third stage of investigations.
The Environmental & Agricultural Health Team at DPI in
Wollongbar has previously offered a local service to test for EDCs using NATA
accredited CALUX® methods. However, DPI funding priorities have
changed and there is currently no known provider of the CALUX method in
Australia.
The GeneBLAzer assay is run by Griffith University in the
Gold Coast. Other bioassay testing methods are not readily available in
Australia at the moment. The ER-CALUX assay can be run by its developers
(BioDetection Systems) in The Netherlands.
Analysis costs are approximately $600 per sample for each
estrogenicity assay (ER-GeneBLAzer). The GeneBLAzer suite of assays can also be
used to detect other endocrine endpoints such as androgenicity (AR-GeneBLAzer),
glucocorticoid (GR-GeneBLAzer) and progestagenic (PR-GeneBLAzer)
endpoints. The cost for analysis of the full suite of assays would be
approximately $2,000 per sample. Additional costs would apply for sample
collection, transport and reporting.
Chemical analysis costs are as follows (per sample):-
· Heavy metals, triazine
herbicides, organochlorine pesticides (OCP), polychlorinated biphenyls (PCB),
polycyclic aromatic hydrocarbons (PAH), nonyl- and octylphenol and estrogens:
$600 per sample; and
· Dioxins/furans -
Polychlorinated dibenzo-p-dioxins & Polychlorinated dibenzofurans
(PCDDs/PCDFs): $1,700 per sample.
Additional costs would apply for sample collection,
transport and reporting.
A proposed preliminary testing program consists of water
samples taken at the STP inlets, STP outlets (peak and non-peak flows), two
locations downstream of STP discharge points and a location upstream of the
STPs (six sites per STP). Sediment samples could also collected at the
two locations downstream of STP discharge points. Additional samples could be
collected at other sites including known sources of EDCs such as solid waste
facilities and agricultural areas.
A budget estimate for this initial testing program at each
STP is (assuming 8 locations are sampled per STP, excluding GST):-
|
Sample collection (8 samples, 2 sets)
|
$3,000
|
|
GeneBLAzer bioassays (4)
|
$16,000
|
|
Chemical analysis (heavy metals, triazine herbicides, OCP,
PCB, PAH, nonyl- and octylphenol and estrogens
|
$4,800
|
|
Chemical analysis (dioxins/furans)
|
$13,600
|
|
Reporting and management
|
$7,000
|
|
Total cost (per STP)
|
$44,000
|
|
Total
cost (for all 4 STPs)
|
$177,600
|
Costs could be reduced by only conducting the GeneBLAzer
bioassays or only conducting the program for a single STP.
4. Consider minimising energy
usage and the use of renewable energy
Water and sewer projects in
recent years have been developed with the aim of minimising energy use e.g.
tenders for Valances Road STP were evaluated against greenhouse gas generation
criteria and variable speed drives and power correction factor devices were
installed at SPSs and STPs where viable. These actions were driven by the
Byron Shire Low Carbon Strategy 2014.
Other actions proposed in the
Strategy include:
· Investigate additional
opportunities for energy efficiency throughout the wastewater treatment
network;
· Conduct energy and water
audit of Council facilities to identify efficiency improvements (e.g. lighting,
insulation, tap locks, hot water);
· Investigate feasibility
of micro hydro turbines in reticulated water supply network;
· Encourage and promote
safe water harvesting and reuse for residents and businesses;
· Install ‘smart
meters’ across the water and sewerage assets to provide centralised
monitoring of energy consumption; and
· Continue to manage
Council's energy and fuel data to identify wastage and document consumption.
Council is investigating the potential to utilise all
sources of organic waste material, termed “biomass”, produced in
the Shire. Biomass is organic matter from urban, commercial or farming
activities that could be utilised for its highest available reuse value by
being “fed” into a bio energy plant.
Innovative utilisation of the Shire’s biomass provides
an opportunity to reduce carbon emissions and creating a valuable resource from
the mass of organic waste material (including STP effluent and biosolids)
produced within the Shire. Council has recently completed a detailed
assessment to quantify and qualify the possible sources of biomass within the
Byron Shire.
A budget estimate for additional
expenditure on energy efficiency projects is $0.5 million over the next ten
years.
Financial
Assessment
The current water supply and sewerage capital works programs
consider the future growth expected within the Shire, the replacement of assets
considered in poor or critical condition and the provision of works to improve
the levels of service currently provided to ensure the delivery of the targets
adopted by Council. The estimated capital investment over the next 30 years for
water supply and sewerage documented in the draft SBP was $37 million and $102
million respectively.
Asset renewal projects and projected expenditure were reviewed
as part of the development of the SBP and Financial Planning. Major asset
upgrade projects include the proposed transfer of Ocean Shores sewage to
Brunswick Valley STP for treatment and upgrade of Brunswick Valley STP (2020)
and longer-term upgrade of the STP in 2032. Expenditure for upgrade of
the Byron Bay STP is included between 2024 and 2027. Expenditure for
upgrade of the Mullumbimby WTP is included in 2044.
Financial plans were developed with the draft 2016 SBP to
enable Council to determine the revenue needed to meet the levels of service
over the long term, adopt funding strategies and effectively manage the cash
flow. The financial plans included the capital works plans and recurrent
costs for operations, maintenance and administration identified at that time.
As a result of the IWCM review, additional expenditure is
proposed as follows:
· Sewerage:
o Mullumbimby inflow and infiltration
reduction: $500,000 p.a. for ten years (then $100,000 p.a.)
o Inflow and infiltration
investigations for other systems: $500,000 p.a. for ten years (then $100,000
p.a.)
o Effluent reuse opportunities: $10.0
million over the next ten years
o EDC testing program: $200,000
o Energy efficiency projects: $0.5
million over the next ten years (half for each of water supply and sewerage)
· Water supply:
o Mullumbimby water supply security: $5 million
o Energy efficiency projects: $0.5
million over the next ten years (half for each of water supply and sewerage).
The financial plans have been updated with
this additional expenditure.
The proposed additional expenditure is
affordable with the sewer and water funds continuing to accumulate significant
levels of cash over the longer term.
Financial Implications
Financial sustainability of the water supply and sewerage businesses
is verified by the strategic business plan.
Statutory and Policy
Compliance Implications
Compliance with the NSW Government’s Best-Practice
Management of Water Supply and Sewerage Guidelines, 2007.
Staff Reports - Infrastructure Services 4.2
Report No. 4.2 Urban
Recycled Water Commercial Connections Policy
Directorate: Infrastructure
Services
Report
Author: Peter
Rees, Manager Utilities
File No: I2017/841
Theme: Community Infrastructure
Water Supplies
Summary:
Council considered the draft Urban Recycled Water Commercial
Connections Policy at the Ordinary Meeting held 22 June 2017.
The draft Policy is now attached for Committee comment.
|
RECOMMENDATION:
That Council note the Water, Waste and Sewer
Advisory Committee considered the draft Urban Recycled Water Commercial
Connections Policy.
|
Attachments:
1 Draft
Policy Urban Recycled Water Connections, E2017/62524
, page 23⇩ 
Report
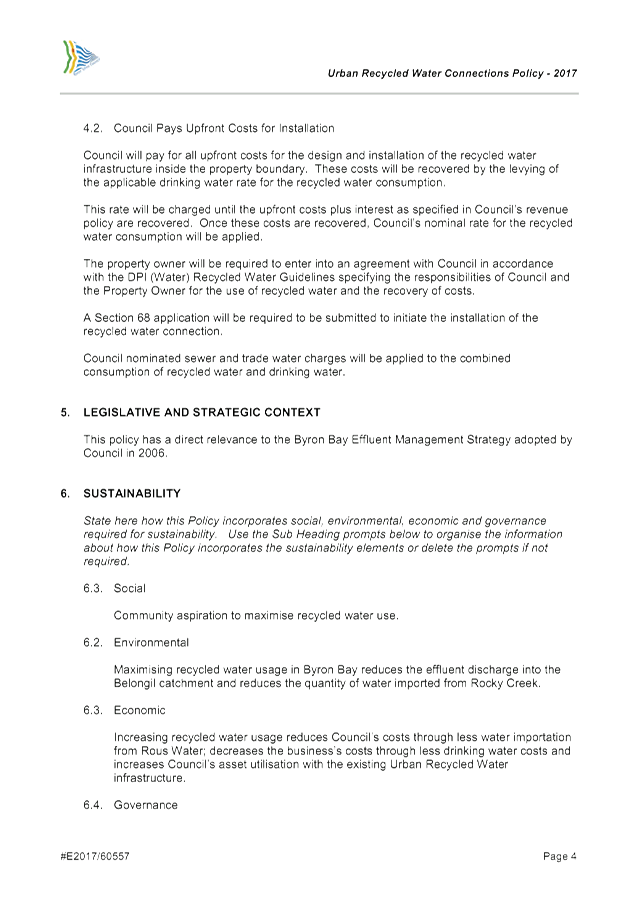
The recent expansion of the Byron Bay Urban Recycled Water
Scheme has broadened the availability of recycled water particularly to the
central business district of Byron bay.
Various representations have been made to Council concerning
the up front costs of connection to the system in some cases being prohibitive.
It is an aspiration of the community, encapsulated in the
Byron bay Effluent Management Strategy, to maximise the use of recycled water.
Accordingly Council has prepared the attached draft policy
that will allow Council to pay the costs of the initial connection and recover
the money over time through the levying of drinking water changes for the
supply of recycled water.
This proposal has been discussed at the Council Strategic
Planning workshop in March 2017.
Council considered the draft Urban Recycled Water Commercial
Connections Policy at the Ordinary Meeting held 22 June 2017. The report
to Council may be viewed at
http://byron.infocouncil.biz/Open/2017/06/OC_22062017_AGN_607.PDF
The draft Policy is now attached for Committee comment.
Financial Implications
Any outlay by Council will be recovered over time. The
outlay of cash will not have any negative impact on Council’s sewer
fund.
The increased use of recycled water will minimise the amount
of bulk water purchased from Rous Water which will financially benefit Council.
Statutory and Policy
Compliance Implications
This policy will facilitate the use of recycled water in
accordance with the Byron Bay Effluent Management Strategy (2006).
NSW Local Government Act, 1993, s68
Staff Reports - Infrastructure Services 4.2 - Attachment 1


Staff Reports - Infrastructure Services 4.3
Report No. 4.3 Water
and Sewer Equivalent Tenement Policy Review
Directorate: Infrastructure
Services
Report Author: Dean
Baulch, Principal Engineer, Systems Planning
File No: I2017/1232
Theme: Community Infrastructure
Sewerage Services
Summary:
The current ET policy has been in operation since 26
September 2013 and was due for review with the Developer Servicing Plan which
was recently adopted by Council Res 16-235 in September 2016.
This report presents a draft revised ET Policy based on
revised guidelines of the NSW Water Directorate and staff feedback collected
since 2013.
|
RECOMMENDATION:
1. That
the Draft Water and Sewer Equivalent Policy 2017 be noted and referred to the
next ordinary meeting of Council to place it on public exhibition.
|
Attachments:
1 DRAFT
Water and Sewer Equivalent Tenement (ET) Policy 2017, E2017/71719 , page 32⇩ 
2 Water
& Sewer ET Policy Comparison - Current 2013 version versus 2017
Draft, E2017/85142 , page 47⇩
Information/Background:
The ET Policy allows Council to determine Equivalent
Tenement figures for new developments to calculate Developer Servicing Charges
under Section 64 of the Local Government Act. The Policy contains two (2)
key elements:
1. The
definition of the quantum of a standard Equivalent Tenement (ET) which is the
demand or loading a development will have on infrastructure in terms of the
water consumption or sewage discharge for an average residential dwelling or
house; and
2. The
ET values for different categories of development.
The NSW Water Directorate, recently reviewed the state
Section 64 Determinations of Equivalent Tenements Guidelines – which is a
direct input and reference into Council’s ET Policy.
The attached draft Policy 2017 has included two additional
land use categories as a result of the Water Directorate review (being Vet
Clinic and Animal Grooming). None of the ET rates have been changed from
the current Policy Rates as a result of the Water Directorate review. The
draft policy also incorporates a number of additional comments, definitions and
notes to help clarify what a land use category includes or excludes.
The attached comparison document at 2. highlights (in
yellow) any differences between the current 2013 Policy and the current day
draft, also attached as item 1.
Consultation:
Internal Staff and the Executive Team.
Communicate to:
Council
Staff Reports - Infrastructure Services 4.3 - Attachment 1
|
Draft Policy:
|
|
Water and Sewer Equivalent Tenements
|
|
2017
|
Water and Sewer Equivalent
Tenements Policy
1199090
Staff Reports - Infrastructure Services 4.3 - Attachment 1
INFORMATION ABOUT THIS DOCUMENT
|
Date Adopted by
Council
|
24 May 2007
|
Resolution No.
|
07-277
|
|
Policy Responsibility
|
Infrastructure Services
|
|
Review Timeframe
|
3 Years
|
|
Last Review Date:
|
July 2017
|
Next Scheduled Review
Date
|
July 2020
|
Document History
|
Doc No.
|
Date Amended
|
Details Comments eg
Resolution No.
|
|
DM704573
|
|
Policy No. 07/100 Water
And Sewer Equivalent Tenements Policy For Determining Developer
Servicing Charges Adopted May 2007 Resolution No. 07-277
|
|
DM680600
|
30/8/07
|
Res 07-448 Delete
swimming pool rate
|
|
DM1099082
|
11/08/11
|
Res 11-618 Insert Table
numbering. Res 11-621 Swimming pools to be assessed based on surface
area. Res 11-622 Decrease the value of reduction in waterless
composting toilet assessments.
|
|
DM1161610
|
24/11/11
|
Reported to Council
Amended Sewer ET values
|
|
DM1199090
|
02/02/12
|
Res 11-934 24/11/11
adopted after close of exhibition (2/2/12) – no submissions received
(Policy No. 12/001)
|
|
E2013/17740
|
14/03/13
|
Res 13-134 14/03/13 Remove consideration of residential swimming pools at
Item 11.5; (new Policy No. 13/005)
|
|
E2013/57161
|
29/08/13
|
Res 13-436 29/08/13
Update Clause 4.7 Consolidated Lots. Additional category comments Section 5.
Land Use Categories.
|
|
E2013/77244
|
26/11/13
|
Adopted as per Res No.
13-632
|
|
E2017/71719
|
|
2017 Draft Review
|
Further Document
Information and Relationships
|
Related Legislation
|
Local Government Act,
Water Management Act
|
|
Related Policies
|
Liquid Trade Waste
Policy; Revenue Policy
|
|
Related Procedures/
Protocols, Statements, documents
|
Developer Servicing
Plans for Water Supply and Sewerage Services
Section 94 Developer Contribution Plans and Local Environmental Plans
|
Staff Reports - Infrastructure Services 4.3 - Attachment 1
TABLE OF CONTENTS
1. OBJECTIVES............................................................................................................................... 1
2. POLICY
STATEMENT................................................................................................................. 1
3. POLICY
OUTLINE....................................................................................................................... 1
4. DETERMINATION
OF QUANTUM OF DEVELOPER SERVICING CHARGES..................... 3
5. LAND
USE CATEGORIES.......................................................................................................... 5
6. NOTES
& DEFINITIONS........................................................................................................... 10
Note: This page is to
be deleted if Table of Contents is more than 1 page in length.
This Page has been
intentionally left blank.
Staff Reports - Infrastructure Services 4.3 - Attachment 1
|
POLICY TITLE
|
WATER AND
SEWER EQUIVALENT TENEMENTS POLICY
(For Determining Developer Servicing Charges)
|
1. OBJECTIVES
This Policy provides guidelines to allow the calculation of
Developer Servicing Charges by specifying the demand on Council’s water
and sewer services generated by new development
2. POLICY STATEMENT
2.1. Equitable
Methodology
Council requires an equitable methodology to assess the
Developer Servicing Charges for new development to contribute towards the cost
of expanding or upgrading Council’s water and sewer infrastructure.
2.2. Calculation
of Developer Charges
The calculation of Developer Servicing Charges is based
upon the fundamental principle that Council’s investment in assets
servicing a development area is fully recovered from that development in
accordance with Council’s adopted Development Servicing Plans for Water
Supply and Sewerage Services.
2.3. Quantum
of Water and Sewer Equivalent Tenement
For the purposes of this policy an equivalent tenement is
defined as the average residential water consumption of 630 litres per day per
dwelling and sewerage loading of 590 litres per day per dwelling in accordance
with Council’s current adopted Developer Servicing Plans. This figure is
based upon flow information throughout the urban areas of the Shire and the Section
64 Determination of Equivalent Tenements Guidelines for NSW Local Government
Water Authorities by the NSW Water Directorate.
3. POLICY OUTLINE
3.1 Purpose
This Policy allows Council to determine Equivalent
Tenement figures for new developments to calculate Developer Servicing Charges
under Section 64 of the Local Government Act.
3.2 Context
This Policy and the assessment criteria supersede
Council’s previous resolutions and methods of calculation. This
Policy is to be read in conjunction with other Byron Shire Council policies and
plans including but not limited to Developer Servicing Plans for Water Supply
and Sewerage Services, Liquid Trade Waste Approvals Policy; Section 94
Developer Contribution Plans and Local Environmental Plans.
3.3. Definition
of an Equivalent Tenement: Water
That for the purpose of this policy an Equivalent Tenement
is 630 litres per day of water consumption. These loadings are the
average loading per dwelling .The water figure allows for losses in the water
supply network.
3.4. Definition
of an Equivalent Tenement: Sewage
That for the purpose of this policy an Equivalent Tenement
is 590 litres per day of unmetered sewage discharge. These loadings are
the average loading per dwelling. The sewer figure allows for base load
infiltration to the sewerage system.
3.5. Responsibilities
The responsibilities under this Policy are listed in the
table below.
|
Task
|
Position/Stakeholder
|
Recommended
Frequency
|
|
· Implementation
|
· General
Manager
|
· Ongoing
|
|
· Review
of the Policy and assessment criteria
|
· The
elected Council
|
· Every
3 years
|
|
· Monitoring
of water supply and sewerage capacity, demand and usage. (current, approved
and approval potential in terms of hydraulic and treatment capacities)
|
· Director,
Infrastructure Services
|
· Ongoing
monitoring
· Detailed
assessment every year
|
|
· Compliance
|
· Director
Sustainable Environment and Economy
· Director,
Infrastructure Services
|
· Ongoing
|
4. DETERMINATION OF QUANTUM OF
DEVELOPER SERVICING CHARGES
4.1. Definitions
The definitions of types of usage and standard units shall
be made in order to best match the nature of the development with the rate of
usage.
Example 1: In Section 5. Land Use Categories, the standard
unit reads as “Bed” and is taken to be a single bed equating to one
person. A development indicating a double bed in a proposed development
will be assessed as two persons and, hence, two “bed” units.
Example 2: In Section 5. Land Use Categories, the standard
units reads as “Floor Area” and is taken to be the “Gross
Floor Area” of a development, except where usage is proposed outside of
the “Gross Floor Area”, in which case the “Floor Area”
shall be equal to the “Gross Floor Area” plus additional area. For
example; a beer garden.
4.2. Method
of Determination
Council shall use the values in the “Section 64
Determinations of Equivalent Tenements Guidelines” as developed by the
NSW Water Directorate as published from time-to-time modified so as to suit
Byron Shire Council’s unique circumstances, as provided in Section 5.
Land Use Categories.
4.3. Matters
of Local Precedence
Matters of Local Precedence have been incorporated into
Section 5. Land Use Categories, applied generally where there is no direction
given by the Water Directorate’s published guidelines.
4.4. Demand
Management Initiatives
Demand management refers to practices that significantly
reduce either the volume of water being used and/or the volume of sewage/liquid
trade waste being generated by a development and discharged to sewer.
Where mechanisms are included that reduces demand for
water or sewer capacity, and is guaranteed by an instrument such as a Section
88b provision, volumes and hence charges maybe reduced.
|
Demand
Management Initiative
|
Reduction
Amount
|
Comment
|
|
Waterless Composting
Toilets
|
16% reduction of water
and sewerage load[1]
|
There must be no
sewered toilets in the development
|
|
Internal and / or
External Recycled Water Use
|
Case by case basis
|
Depending on the extent
and nature of the use
|
|
Other
|
Case by case basis
|
Depending on the extent
and nature of the use
|
4.5. Allowance
for existing development
Developer Servicing Charges for new developments will be
levied according to the estimated increase in water and sewer demand as
specified in Section 5. Land Use Categories. Existing equivalents
(entitlements) for developments connected to water supply and sewerage
pertaining to the site will be deducted from the total prior to the calculation
of the new charges.
4.6. Assessment
of new subdivisions
Subdivisions, where the intensity of development has not
been defined, shall be assessed using Section 5. Land Use Categories.
4.7. Consolidated
lots
Lots which are consolidated as one property for rating
purposes (paying a single sewer and/or water access charge) are still
considered to carry one ET entitlement per each Lot of developable size (within
the planning definition and Council’s applicable Development Control
Plan).
4.8. Industrial
Uses (not light industrial)
The Director, Infrastructure Services, using data from the
developer, comparable uses, Water Directorate figures and the Sewerage Code of
Australia as developed by the Water Services Association of Australia, shall
assess and determine appropriate ET loads.
4.9. Non-Specified
Uses
For uses other than those specified, the Director,
Infrastructure Services, using data from comparable uses, Water Directorate
figures and the Sewerage Code of Australia as developed by the Water Services
Association of Australia, shall assess and determine appropriate ET loads.
5.
LAND USE CATEGORIES
|
Ref
|
CATEGORY
|
STANDARD
UNIT
|
WATER
ET
|
SEWER
ET
|
COMMENTS
|
|
Subdivision Categories - Intensity
Not Defined
|
|
1.0
|
New Torrens Title Subdivision
(Intensity Not Defined)
|
|
1.1
|
Residential
|
Lot
|
1.00
|
1.00
|
|
|
1.2
|
Commercial
|
Lot
|
1.00
|
1.00
|
|
|
1.3
|
Light Industrial
|
Gross Ha
|
15.00
|
15.00
|
|
|
Residential User Categories -
Standard ET Figures
|
|
2.0
|
Single Residential Lots (House)
|
|
2.1
|
Standard Residential Torrens Title Lot
(450m2 to 2000m2)
|
Lot
|
1.00
|
1.00
|
|
|
2.2
|
Small Residential Torrens Title Lot
(< 450m2)
|
Lot
|
Use rate for Units in Multi-Residential Lots (see
3.0 below)
|
|
2.3
|
Large Residential Torrens Title Lot
(> 2000m2)
|
Lot
|
1.20
|
1.00
|
|
|
3.0
|
Multi-Residential Lots (Medium Density 1 - 2
Storey)
|
|
3.1
|
Dual Occupancy –
1 bedroom
|
Dwelling
|
Use Units (see 3.7 to 3.10 below) for a Lot size
of less than (<) 450m2 / dwelling.
or
Use 2.1 or 2.3 : Standard Residential Lot size greater than or
equal to (>=) 450m2 / dwelling
Example:
A dual occupancy ( two dwellings) on a lot of 1000 m2
is assessed as 500 m2 per dwelling and will be 2ET (Ref:2.1)
|
|
3.2
|
Dual Occupancy –
2 bedrooms
|
Dwelling
|
|
3.3
|
Dual Occupancy –
3 or more bedrooms
|
Dwelling
|
|
3.4
|
Duplex - 1 bedroom
|
Dwelling
|
|
3.5
|
Duplex - 2 bedrooms
|
Dwelling
|
|
3.6
|
Duplex - 3 or more bedrooms (or more)
|
Dwelling
|
|
3.7
|
Units - 1 bedroom
|
Dwelling
|
0.40
|
0.3250
|
|
|
3.8
|
Units - 2 bedrooms
|
Dwelling
|
0.60
|
0.75487
|
|
|
3.9
|
Units - 3 or more bedrooms (or more)
|
Dwelling
|
0.80
|
1.000.650
|
|
|
3.100
|
Managers Residence**
|
Dwelling
|
Use Units
(see 3.7 to 3.9 above)
|
e.g. Commercial or Industrial Complex
|
|
4.0
|
Multi-Residential Lots (High Density)
|
|
4.1
|
Multi Storey Apartments
(1 bedroom)
|
Dwelling
|
0.33
|
0.50325
|
|
|
4.2
|
Multi Storey Apartments
(2 bedrooms)
|
Dwelling
|
0.50
|
0.48775
|
|
|
4.3
|
Multi Storey Apartments
(3 or more or more bedrooms)
|
Dwelling
|
0.67
|
0.6501.00
|
|
|
Commercial User Categories - Standard
ET Figures
|
|
5.0
|
Accommodation (Permanent)
|
|
5.1
|
Nursing Home / Special Care Home
|
Bed
|
0.50
|
0.4870.75
|
Limited medical facilities, communal kitchen / laundry
|
|
5.2
|
Self Care Retirement Units / Villas
|
-
|
Use Units
(see 3.7 to 3.9 above)
|
Internal kitchen / laundry facilities
|
|
5.3
|
Self Care Retirement - Serviced Unit (Onsite)
|
-
|
No internal kitchen / laundry facilities
|
|
5.4
|
Self Care Retirement - Serviced Unit (Offsite)
|
Bed
|
0.30
|
0.29245
|
No internal kitchen / laundry facilities
|
|
5.5
|
Boarding House
|
Bed
|
0.33
|
0.32550
|
Communal kitchen / laundry
|
|
5.6
|
Caravan / Mobile Home
Park
(1 bedroom)
|
Van
|
0.40
|
0.32550
|
|
|
5.7
|
Caravan / Mobile Home
Park
(2 bedrooms)
|
Van
|
0.60
|
0.75487
|
Use this if the
number of rooms is unknown
|
|
5.8
|
Caravan / Mobile Home
Park
(3 bedrooms)
|
Van
|
0.80
|
1.000.650
|
|
|
6.0
|
Accommodation (Short Term)
|
Peak week loading - use peak occupancy
|
|
Caravan Park
|
|
6.1
|
Camping Site (temporary)
|
Site
|
0.50
|
0.4090.63
|
Site approx.
equivalent to average caravan site
|
|
6.2
|
Caravan / Cabin Site (temporary)
|
Site
|
0.50
|
0.4090.63
|
Also
use for on-site caravans / cabins
|
|
Other
|
|
6.3
|
Bed & Breakfast / Guest House
|
Bedroom
|
0.40
|
0.3250.50
|
House
based with communal kitchen / laundry. Add 1 ET for the
principal dwelling.
|
|
6.4
|
Motel / Hotel / Resort Room
|
Bedroom
|
0.30
|
0.2920.45
|
Consider
food prep, entertainment & sporting separately
|
|
6.5
|
Backpackers / Hostel
|
Bed
|
0.15
|
0.1490.23
|
Communal
kitchen, small laundry, not serviced
|
|
6.6
|
Extended Stay/Serviced Apartments
|
-
|
Use 4.0 Multi-Res lots (High Density)
|
Self
contained (if not, use motel)
|
|
7.0
|
Accommodation
(Medical Care)
|
|
7.1
|
Hospital
|
Bed
|
0.90
|
0.9291.43
|
Includes
medical facilities
|
|
7.2
|
Hostel
(Medical)
|
Bed
|
0.70
|
0.7211.11
|
Includes
some medical facilities
|
|
8.0
|
Business
(Excluding Food Preparation)
|
|
General
|
|
8.1
|
Single Retail Shop**
|
Floor Area m2
|
0.003
|
0.003
|
|
|
8.2
|
Supermarket**
|
Floor Area m2
|
0.003
|
0.003
|
Includes
minor food preparation e.g. Deli cabinet
Excludes
cooked chickens (See 9.0 Food Preparation)
|
|
8.3
|
Shopping Centre
|
-
|
Assess
amenities, food preparation area & specific businesses individually
|
|
8.4
|
Offices**
|
Floor Area m2
|
0.01
|
0.010004
|
|
|
Specific
|
|
8.5
|
Hairdresser / Beauty Salon
|
Basin
|
0.50
|
0.51379
|
Excludes: spray
tanning, tattooing, ear piercing or hair removal
One (1) sink is permitted for
hygiene purposes and not counted as a requirement for this activity.
|
|
8.6
|
Laundromat
|
Machine
|
0.45
|
0.46171
|
|
|
8.7
|
Medical Centre / Therapy /
Consultation Room
|
Room
|
0.40
|
0.40963
|
Based
on number of consultation rooms. Includes: Dentist, Ophthalmologist, Colonic
irrigators, Spa/Health resort
Excludes:
Psychologist, Chiropractor, Osteopath, Podiatrist, Kinesiology,
Naturopath, Acupuncture,
etc. – to be assessed as 8.4 Offices
|
|
8.8
|
Plant Nursery
|
-
|
To
be considered on a case by case basis
|
|
8.9
|
Car Yard / Showroom**
|
Floor Area m2
|
0.01
|
0.004
|
See 8.4
Offices
|
|
8.10
|
Service Station
|
Lane
|
0.60
|
0.58590
|
|
|
8.11
|
Car Wash – not recycling water
|
Lane
|
5.70
|
5.8669.03
|
|
|
8.12
|
Car Wash – recycling water
|
Lane
|
To be considered
on a case by case basis
|
|
8.13
|
Escort Agency
|
Room
|
0.40
|
0.32550
|
|
|
8.14
|
Animal Boarding
|
Floor Area m2
|
To be
considered on a case by case basis
|
|
8.15
|
Vet Clinic or Animal Grooming
|
Floor Area m2
|
0.01
|
0.01
|
No
animal washing or bathing.
|
|
8.16
|
Animal Grooming/Wash
|
Bath
|
0.50
|
0.51379
|
|
|
8.17
|
Self Storage**
|
Floor Area m2
|
0.01
|
0.01
|
Consider
the office area only
|
|
9.0
|
Food
Preparation
|
|
General
|
|
9.1
|
Restaurant / Café
|
Floor Area m2
|
0.01
|
0.00601
|
Include
the Additional floor area for on-street and al fresco dining
|
|
9.2
|
Take Away / Fast Food
(no amenities)
|
Floor Area m2
|
0.02
|
0.01302
|
Also
use for general food preparation
Amenities
provided for “employees only”.
|
|
9.3
|
Take Away / Fast Food
(including amenities)
|
Floor Area m2
|
0.03
|
0.0532
|
Amenities
are toilets and hand wash basins provided for use by customers.
|
|
9.4
|
Catering
|
Floor Area m2
|
0.02
|
0.0213
|
The
food preparation area to be considered separately
|
|
Specific
|
|
9.5
|
Bakery
|
-
|
Use 9.2
Take Away / Fast Food (no amenities)
|
|
9.6
|
Butcher
|
-
|
Use 9.2
Take Away / Fast Food (no amenities)
|
|
9.7
|
Fishing Co-op
|
-
|
Use
9.2 Take Away / Fast Food (no amenities)
|
|
9.8
|
Bulk Food/Product Storage Area**
|
-
|
Use
13.2 Light Industrial. The food preparation, storage, office areas to
be considered separately.
|
|
10.0
|
Entertainment
|
|
10.1
|
Licensed
Club
|
Floor Area m2
|
The
food preparation, entertainment, office areas to be considered
separately.
|
|
10.2
|
Pub /
Bar
|
Floor Area m2
|
0.03
|
0.03205
|
The
food preparation area to be considered separately
Use 9.1
Restaurant / Café rate for beer garden and balance of area**
|
|
10.3
|
Cinema
/ Theatre / Public Entertainment**
|
Seat
|
0.01
|
0.01
|
|
|
10.4
|
Function
/ Conference Centre**
|
Floor Area m2
|
0.01
|
0.01
|
The
food preparation area to be considered separately
Use 9.0
Food Preparation
|
|
10.5
|
Special
Events and Festivals**
|
|
Separate
and assess the food preparation, entertainment, amenities individually
If
more toilets are required to service the events than the existing fixtures
then portable amenities may be used. Developer charges will not be
payable for the use of portable amenities that are not connected to water or
sewerage
The
normal calculation for such types of events nominates 1 WC for each 100
males, 1 urinal for every 10 males, and 1 WC for every 25 females.
These calculations arise from the Building Code of Australia tables, with
some interpretation for events i.e. may require more WCs if serving alcohol
at the event.
|
|
10.6
|
Marina
|
Berth
|
0.60
|
0.585990
|
|
|
11.0
|
Sporting
/ Spectator Facilities
|
|
General
|
|
11.1
|
Gym / yoga / fitness centre**
|
Floor Area m2
|
0.01
|
0.01
|
The
food preparation area to be considered separately
Use 9.0
Food Preparation
|
|
Specific
|
|
11.2
|
Hockey Field (artificial surface)
|
-
|
To be
considered on a case by case basis
|
|
11.3
|
Bowling Alley
|
Lane
|
0.35
|
0.35755
|
The
food preparation and office areas to be considered separately.
|
|
11.4
|
Bowling Green
|
-
|
Separate
and assess the Food Preparation, Amenities, Irrigation areas individually.
|
|
11.5
|
Private Residential Swimming Pool
|
Litres
|
Not
considered as per Res 13-134
|
|
11.6
|
Commercial/Public Swimming Pool - Indoor or Outdoor
|
Litres
|
To
be considered on a case by case basis
Commercial/public
swimming pool or spa pool means a swimming pool or spa pool to which the
public is admitted, whether free of
charge, on payment of a fee or otherwise, including:
(a) a pool to which the
public is admitted as an entitlement of membership of a club, or
(b) a pool provided at
a workplace for the use of employees, or
(c) a pool provided at a
hotel, motel or guest house (including Bed & Breakfast) or at holiday
units, or similar facility, for the use of guests, or
(d) a pool provided at
a school or hospital.
|
|
12.0
|
Community
Facilities
|
|
12.1
|
Child
Care Centre / Pre-school
|
Person
|
0.06
|
0.06510
|
A
person includes a student/pupil, teacher and staff member
|
|
12.2
|
Education
– School (primary & secondary)
|
Person
|
0.03
|
0.0532
|
A
person includes a student/pupil, teacher and staff member
|
|
12.3
|
Education
- College, University (tertiary)
|
Person
|
0.02
|
0.0213
|
Consider
and assess the Food Preparation separately
|
|
12.4
|
Correctional
Centre
|
Person
|
0.50
|
0.75487
|
Example:
Prison, Gaol
|
|
12.5
|
Church
/ Place of Worship**
|
Floor Area m2
|
0.005
|
0.005
|
|
|
12.6
|
Community
Building / Hall / Library**
|
Floor Area m2
|
0.005
|
0.005
|
See Clause
6. Notes & Definitions
|
|
12.7
|
Parks /
Gardens / Reserves (Irrigation)
|
-
|
To be
considered on a case by case basis
|
|
12.8
|
Public
Amenities (per shower)
|
Shower
|
0.40
|
0.40963
|
|
|
12.9
|
Public
Amenities (per WC or Urinal)
|
WC
or Urinal
|
0.40
|
0.40963
|
The equivalent
width of one urinal equals 600mm
|
|
Industrial
User Categories - Standard ET Figures
|
|
13.0
|
Industrial
General
|
|
13.1
|
Light
Industrial
|
Gross Ha
|
15.00
|
15.00
|
Gross
Ha includes Road Area
(i.e.
Length of parcel road frontage x ½ road reserve width)
|
|
13.2
|
Light
Industrial**
|
Floor Area m2
|
0.003
|
0.003
|
For
mixed use sites
|
|
13.3
|
Future
Unknown - Light
|
Gross Ha
|
15.00
|
15.00
|
Gross
Ha includes Road Area as per comments at 13.1
|
|
13.4
|
Future
Unknown - Medium
|
Gross Ha
|
30.00
|
30.00
|
Gross
Ha includes Road Area as per comments at 13.1
|
|
13.5
|
Future
Unknown - Heavy
|
Gross Ha
|
50.00
|
50.00
|
Gross
Ha includes Road Area as per comments at 13.1
|
|
|
|
** Rate
set by Local Precedence
|
6. NOTES & DEFINITIONS
|
a.
|
One (1)
Local ET = Town Water Usage of 630 L/day & Sewerage Loading of 590 L/day
|
|
b.
|
The ET rate for units
shall be calculated on the basis of each bedroom or a room that could be used
as or perceived as a bedroom.
|
|
c.
|
Assessed ET rounded to
the second decimal place e.g. calculated at 7.456 ET = 7.46 ET
|
|
d.
|
Ancillary use:
Ancillary means 1.
Subordinate; subsidiary. 2. Auxiliary; helping - The definition of ancillary
means something that is helping or subordinate, but not as necessary.
A conference room in a
holiday complex is NOT ancillary and will attract ET loading. It is an
additional feature of the holiday complex which is essentially approved for
short term accommodation.
A bathroom or toilet
servicing a number of offices/retail stores in the same building can be
considered as ancillary –the bathroom is subordinate to the office in
that it is a requirement for people working in the office/retail store. The
offices/retail stores attract the ET load already.
A baggage store at a
hotel can argued to be ancillary as it is only used for temporary storage and
security of luggage for people prior to departure. It’s not
occupied by people that would create an ET load.
The use of the word
Ancillary in the EP&A Act and Regulations is not the same as it is used
in this policy.
|
|
e.
|
“Bed”
is taken to be a single bed equating to one person
|
|
f.
|
A “bedroom”
is any habitable room that, in the opinion of Council, by its physical
design, designated or capable of being used as a bedroom including separably
accessible rooms designated a bedroom, study, studio, den, attic, media room,
home office or the like other than a kitchen, WC, bathroom or laundry.
|
|
g.
|
A "bulk store" means
a building or place used for the warehousing of goods, where the goods stored
or to be stored are not required for use in a shop or commercial premises on
the same parcel of land or on the adjoining land in the same ownership.
|
|
h.
|
A “community
building” means a building or place owned, occupied or operated by
the council or another public or local authority and used to provide
facilities comprising or relating to any one or more of the following:
(a)
a library, rest room, meeting room, neighbourhood centre, senior citizens
centre, youth centre, welfare centre or any similar place, or
(b)
health centre or place providing similar services, or
(c)
indoor recreation, child minding or any similar activity, or
(d)
arts and craft centre, information centre or kiosk.
|
|
i.
|
Developable Size: refer to Byron Local Environment Plan 2014
and/or Council’s current Development Control Plan for guidance on
minimum size of a Developable Lot.
|
|
j.
|
Dry weather flow
definition:
The average daily flow
to the treatment works during seven consecutive days without rain (excluding
a period which includes public holidays) following seven days during which
the rainfall did not exceed 0.25 millimetres on any one day.
|
|
k.
|
“Floor Area”
is taken to be the “Gross Floor Area” of a development, except
where usage is proposed outside of the “Gross Floor Area”, in
which case the “Floor Area” shall be equal to the “Gross
Floor Area” plus additional area
|
|
l.
|
Restaurant versus Take Away:
Restaurant or cafe means a building or place the principal purpose of
which is the preparation and serving, on a retail basis, of food and drink to
people for consumption on the premises.
Take Away food and drink premises means
premises that are predominantly used for the preparation and retail sale of
food or drink (or both) for immediate consumption away from the premises.
|
|
m.
|
A
“swimming pool”, including a spa, is subject to Public
Health Act 2010 & Regulation 2012 requirements.
Water
and sewerage load demands from the pool will be generated by top-up water
requirements due to splash-out, evaporation, backwash water demand and
backwash water discharged to sewer. Reference is made to the “NSW Heath
- Swimming Pool and Spa Advisory Document 2013” to calculate loadings,
consideration is given to:
• The
volume of the pool.
• cross-sections
of the pool structure which show depths.
• The
turnover rate of the pool.
• The
daily volume of make-up water required for the pool.
• The
daily volume of backwash water discharged to sewer.
|
|
n.
|
Torrens Title Lot
versus Strata Lot:
Strata
lots are only air space sitting on a parent Torrens Title Lot; it is intent
of the policy to deal only with Torrens title lots. Hence, a strata lot
is assessed as a dwelling or for the land use category itself.
A
vacant strata lot, without a specified land use, will be assessed as one (1)
ET.
From Water Management
Regulations:
WATER MANAGEMENT
(GENERAL) REGULATION 2011 - REG 139 Sewerage service not to be shared
Subclause (4) For the
purposes of this clause, the separate lots in a strata scheme under the
Strata Schemes (Freehold Development) Act 1973 or the Strata Schemes
(Leasehold Development) Act 1986 are taken to constitute a single parcel of
land.
|
|
o.
|
Additional
definitions – may use
dictionary in the Byron Local Environment Plan 2014 or words and phrases are
not defined in LEP 2014 then refer to the meaning defined in the Dictionary
contained in Appendix A1 of the Byron Shire Development Control Plan 2014
|
|
POLICY TITLE
|
IN CAPS, NOT BOLD
|
Staff Reports - Infrastructure Services 4.3 - Attachment 2
CURRENT
POLICY 13/005
|
POLICY TITLE
|
WATER AND SEWER EQUIVALENT TENEMENTS POLICY
(For Determining Developer Servicing Charges)
|
1. OBJECTIVES
This Policy provides guidelines to allow the calculation of
Developer Servicing Charges by specifying the demand on Council’s water
and sewer services generated by new development
2. POLICY
STATEMENT
2.1. Equitable
Methodology
Council requires an equitable methodology to assess the
Developer Servicing Charges for new development to contribute towards the cost
of expanding or upgrading Council’s water and sewer infrastructure.
2.2. Calculation of
Developer Charges
The calculation of Developer Servicing Charges is based upon
the fundamental principle that Council’s investment in assets servicing a
development area is fully recovered from that development in accordance with
Council’s adopted Development Servicing Plans for Water Supply and
Sewerage Services.
2.3. Quantum
of Water and Sewer Equivalent Tenement
For the purposes of this policy an equivalent tenement is
defined as the average residential water consumption of 630 litres per day per
dwelling and sewerage loading of 590 litres per day per dwelling in accordance
with Council’s current adopted Developer Servicing Plans. This figure is
based upon flow information throughout the urban areas of the Shire and the Section
64 Determination of Equivalent Tenements Guidelines for NSW Local Government
Water Authorities by the NSW Water Directorate.
3. POLICY OUTLINE
3.1 Purpose
This Policy allows Council to determine Equivalent Tenement
figures for new developments to calculate Developer Servicing Charges under
Section 64 of the Local Government Act.
3.2 Context
This Policy and the assessment criteria supersede
Council’s previous resolutions and methods of calculation. This
Policy is to be read in conjunction with other Byron Shire Council policies and
plans including but not limited to Developer Servicing Plans for Water Supply
and Sewerage Services, Liquid Trade Waste Approvals Policy; Section 94
Developer Contribution Plans and Local Environmental Plans.
3.3. Definition
of an Equivalent Tenement: Water
That for the purpose of this policy an Equivalent Tenement is
630 litres per day of water consumption. These loadings are the average
loading per dwelling .The water figure allows for losses in the water supply
network.
DRAFT POLICY 2017
|
POLICY TITLE
|
WATER AND SEWER EQUIVALENT TENEMENTS POLICY
(For Determining Developer Servicing Charges)
|
1. OBJECTIVES
This Policy provides guidelines to allow the calculation of
Developer Servicing Charges by specifying the demand on Council’s water
and sewer services generated by new development
2. POLICY
STATEMENT
2.1. Equitable
Methodology
Council requires an equitable methodology to assess the
Developer Servicing Charges for new development to contribute towards the cost
of expanding or upgrading Council’s water and sewer infrastructure.
2.2. Calculation of
Developer Charges
The calculation of Developer Servicing Charges is based upon
the fundamental principle that Council’s investment in assets servicing a
development area is fully recovered from that development in accordance with
Council’s adopted Development Servicing Plans for Water Supply and
Sewerage Services.
2.3. Quantum
of Water and Sewer Equivalent Tenement
For the purposes of this policy an equivalent tenement is
defined as the average residential water consumption of 630 litres per day per
dwelling and sewerage loading of 590 litres per day per dwelling in accordance
with Council’s current adopted Developer Servicing Plans. This figure is
based upon flow information throughout the urban areas of the Shire and the Section
64 Determination of Equivalent Tenements Guidelines for NSW Local Government
Water Authorities by the NSW Water Directorate.
3. POLICY
OUTLINE
3.1 Purpose
This Policy allows Council to determine Equivalent Tenement
figures for new developments to calculate Developer Servicing Charges under
Section 64 of the Local Government Act.
3.2 Context
This Policy and the assessment criteria supersede
Council’s previous resolutions and methods of calculation. This
Policy is to be read in conjunction with other Byron Shire Council policies and
plans including but not limited to Developer Servicing Plans for Water Supply
and Sewerage Services, Liquid Trade Waste Approvals Policy; Section 94
Developer Contribution Plans and Local Environmental Plans.
3.3. Definition of an
Equivalent Tenement: Water
That for the purpose of this policy an Equivalent Tenement is
630 litres per day of water consumption. These loadings are the average
loading per dwelling .The water figure allows for losses in the water supply
network.
3.4. Definition
of an Equivalent Tenement: Sewage
That for the purpose of this policy an Equivalent Tenement is
590 litres per day of unmetered sewage discharge. These loadings are the
average loading per dwelling. The sewer figure allows for base load
infiltration to the sewerage system.
3.5. Responsibilities
The responsibilities under this Policy are listed in the table
below.
|
Task
|
Position/Stakeholder
|
Recommended Frequency
|
|
§ Implementation
|
§ General Manager
|
§ Ongoing
|
|
§ Review of the Policy and assessment criteria
|
§ The elected Council
|
§ Every 3 years
|
|
§ Monitoring of water supply and sewerage capacity, demand and
usage. (current, approved and approval potential in terms of hydraulic and
treatment capacities)
|
§ Executive Manager, Water and Recycling
|
§ Ongoing monitoring
§ Detailed assessment every year
|
|
§ Compliance
|
§ Executive Manager, Environment and Planning
§ Executive Manager, Water and Recycling
|
§ Ongoing
|
3.4.
Definition of an Equivalent Tenement: Sewage
That for the purpose of this policy an Equivalent Tenement is
590 litres per day of unmetered sewage discharge. These loadings are the
average loading per dwelling. The sewer figure allows for base load
infiltration to the sewerage system.
3.5. Responsibilities
The responsibilities under this Policy are listed in the table
below.
|
Task
|
Position/Stakeholder
|
Recommended Frequency
|
|
· Implementation
|
· General Manager
|
· Ongoing
|
|
· Review of the Policy and assessment criteria
|
· The elected Council
|
· Every 3 years
|
|
· Monitoring of water supply and sewerage capacity, demand and
usage. (current, approved and approval potential in terms of hydraulic and
treatment capacities)
|
· Director, Infrastructure Services
|
· Ongoing monitoring
· Detailed assessment every year
|
|
· Compliance
|
· Director Sustainable Environment and Economy
· Director, Infrastructure Services
|
· Ongoing
|
4. DETERMINATION
OF QUANTUM OF DEVELOPER SERVICING CHARGES
4.1. Definitions
The definitions of types of usage and standard units shall be
made in order to best match the nature of the development with the rate of
usage.
Example 1: In Appendix A, the standard unit reads as
“Bed” and is taken to be a single bed equating to one person.
A development indicating a double bed in a proposed development will be
assessed as two persons and, hence, two “bed” units.
Example 2: In Appendix A, the standard units reads as
“Floor Area” and is taken to be the “Gross Floor Area”
of a development, except where usage is proposed outside of the “Gross
Floor Area”, in which case the “Floor Area” shall be equal to
the “Gross Floor Area” plus additional area. For example; a beer
garden.
4.2. Method of
Determination
Council shall use the values in the “Section 64
Determinations of Equivalent Tenements Guidelines” as developed by the
NSW Water Directorate as published from time-to-time modified so as to suit
Byron Shire Council’s unique circumstances, as provided in Appendix A.
4.3. Matters of Local
Precedence
Matters of Local Precedence have been incorporated into
Appendix A, applied generally where there is no direction given by the Water
Directorate’s published guidelines.
4.4. Demand Management
Initiatives
Demand management refers to practices that significantly
reduce either the volume of water being used and/or the volume of sewage/liquid
trade waste being generated by a development and discharged to sewer.
Where mechanisms are included that reduces demand for water or
sewer capacity, and is guaranteed by an instrument such as a Section 88b
provision, volumes and hence charges maybe reduced.
|
Demand Management Initiative
|
Reduction Amount
|
Comment
|
|
Waterless Composting Toilets
|
16% reduction of water and sewerage
load
|
There must be no sewered
toilets in the development
|
|
Internal and / or External Recycled
Water Use
|
Case by case basis
|
Depending on the extent and nature of
the use
|
|
Other
|
Case by case basis
|
Depending on the extent and nature of
the use
|
4. DETERMINATION
OF QUANTUM OF DEVELOPER SERVICING CHARGES
4.1. Definitions
The definitions of types of usage and standard units shall be
made in order to best match the nature of the development with the rate of
usage.
Example 1: In Section 5. Land
Use Categories, the standard unit reads as “Bed” and is
taken to be a single bed equating to one person. A development indicating
a double bed in a proposed development will be assessed as two persons and,
hence, two “bed” units.
Example 2: In Section 5. Land
Use Categories, the standard units reads as “Floor Area” and
is taken to be the “Gross Floor Area” of a development, except
where usage is proposed outside of the “Gross Floor Area”, in which
case the “Floor Area” shall be equal to the “Gross Floor
Area” plus additional area. For example; a beer garden.
4.2. Method of
Determination
Council shall use the values in the “Section 64
Determinations of Equivalent Tenements Guidelines” as developed by the
NSW Water Directorate as published from time-to-time modified so as to suit
Byron Shire Council’s unique circumstances, as provided in Section 5. Land Use Categories.
4.3. Matters of Local
Precedence
Matters of Local Precedence have been incorporated into Section 5. Land Use Categories, applied
generally where there is no direction given by the Water Directorate’s
published guidelines.
4.4. Demand Management
Initiatives
Demand management refers to practices that significantly
reduce either the volume of water being used and/or the volume of sewage/liquid
trade waste being generated by a development and discharged to sewer.
Where mechanisms are included that reduces demand for water or
sewer capacity, and is guaranteed by an instrument such as a Section 88b
provision, volumes and hence charges maybe reduced.
|
Demand Management
Initiative
|
Reduction Amount
|
Comment
|
|
Waterless Composting
Toilets
|
16% reduction of water
and sewerage load
|
There must be no
sewered toilets in the development
|
|
Internal and / or
External Recycled Water Use
|
Case by case basis
|
Depending on the extent
and nature of the use
|
|
Other
|
Case by case basis
|
Depending on the extent
and nature of the use
|
4.5. Allowance for
existing development
Developer Servicing Charges for new developments will be
levied according to the estimated increase in water and sewer demand as
specified in the appendices. Existing equivalents (entitlements) for
developments connected to water supply and sewerage pertaining to the site will
be deducted from the total prior to the calculation of the new charges.
4.6. Assessment of new
subdivisions
Subdivisions, where the intensity of development has not been
defined, shall be assessed using Appendix A.
4.7. Consolidated lots
Lots which are consolidated as one property for rating
purposes (paying a single sewer and/or water access charge) are still
considered to carry one ET entitlement per each Lot of developable size (within
the planning definition).
4.8. Industrial Uses
(not light industrial)
The Executive Manager of Water and Recycling, using data from
the developer, comparable uses, Water Directorate figures and the Sewerage Code
of Australia as developed by the Water Services Association of Australia, shall
assess and determine appropriate ET loads.
4.9. Non-Specified Uses
For uses other than those specified, the Executive Manager of
Water and Recycling, using data from comparable uses, Water Directorate figures
and the Sewerage Code of Australia as developed by the Water Services
Association of Australia, shall assess and determine appropriate ET loads.
4.5. Allowance for existing
development
Developer Servicing Charges for new developments will be
levied according to the estimated increase in water and sewer demand as
specified in Section 5. Land Use Categories.
Existing equivalents (entitlements) for developments connected to water supply
and sewerage pertaining to the site will be deducted from the total prior to
the calculation of the new charges.
4.6. Assessment of new
subdivisions
Subdivisions, where the intensity of development has not been
defined, shall be assessed using Section 5.
Land Use Categories.
4.7. Consolidated lots
Lots which are consolidated as one property for rating
purposes (paying a single sewer and/or water access charge) are still
considered to carry one ET entitlement per each Lot of developable size (within the planning definition and Council’s
applicable Development Control Plan).
4.8. Industrial Uses
(not light industrial)
The Director, Infrastructure
Services, using data from the developer, comparable uses, Water
Directorate figures and the Sewerage Code of Australia as developed by the
Water Services Association of Australia, shall assess and determine appropriate
ET loads.
4.9. Non-Specified Uses
For uses other than those specified, the Director, Infrastructure Services, using data
from comparable uses, Water Directorate figures and the Sewerage Code of
Australia as developed by the Water Services Association of Australia, shall
assess and determine appropriate ET loads.
5.
APPENDIX A
|
Ref
|
CATEGORY
|
STANDARD
UNIT
|
WATER
ET
|
SEWER
ET
|
COMMENTS
|
|
Subdivision
Categories - Intensity Not Defined
|
|
1.0
|
New
Subdivision (Intensity Not Defined)
|
|
1.1
|
Residential
|
Lot
|
1.00
|
1.00
|
|
|
1.2
|
Commercial
|
Lot
|
1.00
|
1.00
|
|
|
1.3
|
Light
Industrial
|
Gross Ha
|
15.00
|
15.00
|
|
|
Residential
User Categories - Standard ET Figures
|
|
2.0
|
Single
Residential Lots (House)
|
|
2.1
|
Standard
Residential Lot (450m2 to 2000m2)
|
Lot
|
1.00
|
1.00
|
|
|
2.2
|
Small
Residential Lot (< 450m2)
|
Lot
|
Use
rate for Units in Multi-Residential Lots (see 3.0 below)
|
|
2.3
|
Large
Residential Lot (> 2000m2)
|
Lot
|
1.20
|
1.00
|
|
|
3.0
|
Multi-Residential
Lots (Medium Density 1 - 2 Storey)
|
|
3.1
|
Dual
Occupancy –
1
bedroom
|
Dwelling
|
Use
Units (see 3.7 to 3.9 below) for a Lot size of
less
than (<) 450m2 / dwelling
or
Use
2.1: Standard Residential Lot size greater than
or
equal to (>=) 450m2 / dwelling
Example:
A dual occupancy (two dwellings) on a lot of
1000
m2 is assessed as 500 m2 per dwelling and will be 2ET
(Ref: 2.1)
|
|
3.2
|
Dual
Occupancy –
2
bedrooms
|
Dwelling
|
|
3.3
|
Dual
Occupancy –
3
or more bedrooms
|
Dwelling
|
|
3.4
|
Duplex
- 1 bedroom
|
Dwelling
|
|
3.5
|
Duplex
- 2 bedrooms
|
Dwelling
|
|
3.6
|
Duplex
- 3 or more bedrooms (or more)
|
Dwelling
|
|
3.7
|
Units
- 1 bedroom
|
Dwelling
|
0.40
|
0.50
|
|
|
3.8
|
Units
- 2 bedrooms
|
Dwelling
|
0.60
|
0.75
|
|
|
3.9
|
Units
- 3 or more bedrooms (or more)
|
Dwelling
|
0.80
|
1.00
|
|
|
3.10
|
Managers
Residence**
|
Dwelling
|
Use Units
(see 3.7 to 3.9 above)
|
e.g.
Commercial or Industrial Complex
|
|
4.0
|
Multi-Residential
Lots (High Density)
|
|
4.1
|
Multi Storey Apartments
(1 bedroom)
|
Dwelling
|
0.33
|
0.50
|
|
|
4.2
|
Multi Storey Apartments
(2 bedrooms)
|
Dwelling
|
0.50
|
0.75
|
|
|
4.3
|
Multi Storey Apartments
(3 or more or more bedrooms)
|
Dwelling
|
0.67
|
1.00
|
|
5.
LAND USE CATEGORIES
|
Ref
|
CATEGORY
|
STANDARD
UNIT
|
WATER
ET
|
SEWER
ET
|
COMMENTS
|
|
Subdivision Categories - Intensity
Not Defined
|
|
1.0
|
New Torrens
Title Subdivision (Intensity Not Defined)
|
|
1.1
|
Residential
|
Lot
|
1.00
|
1.00
|
|
|
1.2
|
Commercial
|
Lot
|
1.00
|
1.00
|
|
|
1.3
|
Light Industrial
|
Gross Ha
|
15.00
|
15.00
|
|
|
Residential User Categories -
Standard ET Figures
|
|
2.0
|
Single Residential Lots (House)
|
|
2.1
|
Standard Residential Torrens
Title Lot
(450m2 to 2000m2)
|
Lot
|
1.00
|
1.00
|
|
|
2.2
|
Small Residential Torrens Title Lot
(< 450m2)
|
Lot
|
Use rate for Units in Multi-Residential Lots (see
3.0 below)
|
|
2.3
|
Large Residential Torrens Title Lot
(> 2000m2)
|
Lot
|
1.20
|
1.00
|
|
|
3.0
|
Multi-Residential Lots (Medium Density 1 - 2
Storey)
|
|
3.1
|
Dual Occupancy –
1 bedroom
|
Dwelling
|
Use Units (see 3.7 to 3.10 below) for a Lot size
of less than (<) 450m2 / dwelling.
or
Use 2.1 or 2.3 : Standard Residential Lot size greater than or
equal to (>=) 450m2 / dwelling
Example:
A dual occupancy ( two dwellings) on a lot of 1000 m2
is assessed as 500 m2 per dwelling and will be 2ET (Ref:2.1)
|
|
3.2
|
Dual Occupancy –
2 bedrooms
|
Dwelling
|
|
3.3
|
Dual Occupancy –
3 or more bedrooms
|
Dwelling
|
|
3.4
|
Duplex - 1 bedroom
|
Dwelling
|
|
3.5
|
Duplex - 2 bedrooms
|
Dwelling
|
|
3.6
|
Duplex - 3 or more bedrooms (or more)
|
Dwelling
|
|
3.7
|
Units - 1 bedroom
|
Dwelling
|
0.40
|
0.3250
|
|
|
3.8
|
Units - 2 bedrooms
|
Dwelling
|
0.60
|
0.75487
|
|
|
3.9
|
Units - 3 or more bedrooms (or more)
|
Dwelling
|
0.80
|
1.000.650
|
|
|
3.100
|
Managers Residence**
|
Dwelling
|
Use Units
(see 3.7 to 3.9 above)
|
e.g. Commercial or Industrial Complex
|
|
4.0
|
Multi-Residential Lots (High Density)
|
|
4.1
|
Multi Storey Apartments
(1 bedroom)
|
Dwelling
|
0.33
|
0.50325
|
|
|
4.2
|
Multi Storey Apartments
(2 bedrooms)
|
Dwelling
|
0.50
|
0.48775
|
|
|
4.3
|
Multi Storey Apartments
(3 or more or more bedrooms)
|
Dwelling
|
0.67
|
0.6501.00
|
|
|
5.0
|
Accommodation
(Permanent)
|
|
5.1
|
Nursing
Home / Special Care Home
|
Bed
|
0.50
|
0.75
|
Limited
medical facilities, communal kitchen / laundry
|
|
5.2
|
Self
Care Retirement Units / Villas
|
-
|
Use Units
(see 3.7 to 3.9 above)
|
Internal
kitchen / laundry facilities
|
|
5.3
|
Self
Care Retirement - Serviced Unit (Onsite)
|
-
|
No
internal kitchen / laundry facilities
|
|
5.4
|
Self
Care Retirement - Serviced Unit (Offsite)
|
Bed
|
0.30
|
0.45
|
No
internal kitchen / laundry facilities
|
|
5.5
|
Boarding
House
|
Bed
|
0.33
|
0.50
|
Communal
kitchen / laundry
|
|
5.6
|
Caravan / Mobile Home Park
(1 bedroom)
|
Van
|
0.40
|
0.50
|
|
|
5.7
|
Caravan / Mobile Home Park
(2 bedrooms)
|
Van
|
0.60
|
0.75
|
Use
this if the number of rooms is unknown
|
|
5.8
|
Caravan / Mobile Home Park
(3 bedrooms)
|
Van
|
0.80
|
1.00
|
|
|
6.0
|
Accommodation
(Short Term)
|
Peak
day loading - use peak occupancy
|
|
Caravan Park
|
|
6.1
|
Camping Site (temporary)
|
Site
|
0.50
|
0.63
|
Site
approx. equivalent to average caravan site
|
|
6.2
|
Caravan / Cabin Site (temporary)
|
Site
|
0.50
|
0.63
|
Also
use for on-site caravans / cabins
|
|
Other
|
|
6.3
|
Bed & Breakfast / Guest House
|
Room
|
0.40
|
0.50
|
House
based with communal kitchen / laundry
|
|
6.4
|
Motel / Hotel / Resort Room
|
Room
|
0.30
|
0.45
|
Consider
food prep, entertainment & sporting separately
|
|
6.5
|
Backpackers / Hostel
|
Bed
|
0.15
|
0.23
|
Communal
kitchen, small laundry, not serviced
|
|
6.6
|
Serviced / Un-serviced Apartments
|
-
|
Use 4.0 Multi-Res lots (High Density)
|
Self
contained (if not, use motel)
|
|
7.0
|
Accommodation
(Medical Care)
|
|
7.1
|
Hospital
|
Bed
|
0.90
|
1.43
|
Includes
medical facilities
|
|
7.2
|
Hostel
(Medical)
|
Bed
|
0.70
|
1.11
|
Includes
some medical facilities
|
|
8.0
|
Business
(Excluding Food Preparation)
|
|
General
|
|
8.1
|
Single Retail Shop**
|
Floor Area m2
|
0.003
|
0.003
|
|
|
5.0
|
Accommodation (Permanent)
|
|
5.1
|
Nursing Home / Special Care Home
|
Bed
|
0.50
|
0.4870.75
|
Limited medical facilities, communal kitchen /
laundry
|
|
5.2
|
Self Care Retirement Units / Villas
|
-
|
Use Units
(see 3.7 to 3.9 above)
|
Internal kitchen / laundry facilities
|
|
5.3
|
Self Care Retirement - Serviced Unit (Onsite)
|
-
|
No internal kitchen / laundry facilities
|
|
5.4
|
Self Care Retirement - Serviced Unit (Offsite)
|
Bed
|
0.30
|
0.29245
|
No internal kitchen / laundry facilities
|
|
5.5
|
Boarding House
|
Bed
|
0.33
|
0.32550
|
Communal kitchen / laundry
|
|
5.6
|
Caravan / Mobile Home
Park
(1 bedroom)
|
Van
|
0.40
|
0.32550
|
|
|
5.7
|
Caravan / Mobile Home
Park
(2 bedrooms)
|
Van
|
0.60
|
0.75487
|
Use this if the
number of rooms is unknown
|
|
5.8
|
Caravan / Mobile Home
Park
(3 bedrooms)
|
Van
|
0.80
|
1.000.650
|
|
|
6.0
|
Accommodation (Short Term)
|
Peak week loading - use peak occupancy
|
|
Caravan Park
|
|
6.1
|
Camping Site (temporary)
|
Site
|
0.50
|
0.4090.63
|
Site
approx. equivalent to average caravan site
|
|
6.2
|
Caravan / Cabin Site (temporary)
|
Site
|
0.50
|
0.4090.63
|
Also
use for on-site caravans / cabins
|
|
Other
|
|
6.3
|
Bed & Breakfast / Guest House
|
Bedroom
|
0.40
|
0.3250.50
|
House
based with communal kitchen / laundry. Add 1 ET for the principal dwelling.
|
|
6.4
|
Motel / Hotel / Resort Room
|
Bedroom
|
0.30
|
0.2920.45
|
Consider
food prep, entertainment & sporting separately
|
|
6.5
|
Backpackers / Hostel
|
Bed
|
0.15
|
0.1490.23
|
Communal
kitchen, small laundry, not serviced
|
|
6.6
|
Extended Stay/Serviced
Apartments
|
-
|
Use 4.0 Multi-Res lots (High Density)
|
Self
contained (if not, use motel)
|
|
7.0
|
Accommodation
(Medical Care)
|
|
7.1
|
Hospital
|
Bed
|
0.90
|
0.9291.43
|
Includes
medical facilities
|
|
7.2
|
Hostel
(Medical)
|
Bed
|
0.70
|
0.7211.11
|
Includes
some medical facilities
|
|
8.0
|
Business
(Excluding Food Preparation)
|
|
General
|
|
8.1
|
Single Retail Shop**
|
Floor Area m2
|
0.003
|
0.003
|
|
|
8.2
|
Supermarket**
|
Floor Area m2
|
0.003
|
0.003
|
Includes
minor food preparation e.g. Deli cabinet
Excludes
cooked chickens (See 9.0 Food Preparation)
|
|
8.3
|
Shopping Centre
|
-
|
Assess
amenities, food preparation area & specific businesses individually
|
|
8.4
|
Offices**
|
Floor Area m2
|
0.01
|
0.004
|
|
|
Specific
|
|
8.5
|
Hairdresser / Beauty Salon
|
Basin
|
0.50
|
0.79
|
Excludes: Tattooing, Ear piercing or Hair Removal
|
|
8.6
|
Laundromat
|
Machine
|
0.45
|
0.71
|
|
|
8.7
|
Medical Centre / Therapy / Consultation Room
|
Room
|
0.40
|
0.63
|
Based
on number of consultation rooms. Includes: Dentist, Ophthalmologist, Colonic
Irrigators, Spa/Health Resort
Excludes:
Chiropractor, Osteopath, Podiatrist, Kinesiology, Naturopath, Acupuncture
|
|
8.8
|
Plant Nursery
|
-
|
To
be considered on a case by case basis
|
|
8.9
|
Car Yard / Showroom
|
Floor Area m2
|
0.01
|
0.004
|
See
8.4 Offices
|
|
8.10
|
Service Station
|
Lane
|
0.60
|
0.90
|
|
|
8.11
|
Car Wash – not recycling water
|
Lane
|
5.70
|
9.03
|
|
|
8.12
|
Car Wash – recycling water
|
Lane
|
To
be considered on a case by case basis
|
|
8.13
|
Escort Agency
|
Room
|
0.40
|
0.50
|
|
|
8.14
|
Animal Boarding
|
-
|
To
be considered on a case by case basis
|
|
8.15
|
Self Storage**
|
Floor Area m2
|
0.01
|
0.01
|
Consider
the office area only
|
|
9.0
|
Food
Preparation
|
|
General
|
|
9.1
|
Restaurant / Café
|
Floor Area m2
|
0.01
|
0.01
|
Include
the additional floor area for on-street and al fresco dining
|
8.2
|
Supermarket**
|
Floor Area m2
|
0.003
|
0.003
|
Includes
minor food preparation e.g. Deli cabinet
Excludes
cooked chickens (See 9.0 Food Preparation)
|
|
8.3
|
Shopping Centre
|
-
|
Assess
amenities, food preparation area & specific businesses individually
|
|
8.4
|
Offices**
|
Floor Area m2
|
0.01
|
0.010004
|
|
|
Specific
|
|
8.5
|
Hairdresser / Beauty Salon
|
Basin
|
0.50
|
0.51379
|
Excludes: spray
tanning, tattooing, ear piercing or hair removal
One (1) sink is permitted
for hygiene purposes and not counted as a requirement for this activity.
|
|
8.6
|
Laundromat
|
Machine
|
0.45
|
0.46171
|
|
|
8.7
|
Medical Centre / Therapy /
Consultation Room
|
Room
|
0.40
|
0.40963
|
Based
on number of consultation rooms. Includes: Dentist, Ophthalmologist, Colonic
irrigators, Spa/Health resort
Excludes:
Psychologist, Chiropractor, Osteopath, Podiatrist, Kinesiology, Naturopath, Acupuncture, etc.
– to be assessed as 8.4 Offices
|
|
8.8
|
Plant Nursery
|
-
|
To
be considered on a case by case basis
|
|
8.9
|
Car Yard / Showroom**
|
Floor Area m2
|
0.01
|
0.004
|
See 8.4
Offices
|
|
8.10
|
Service Station
|
Lane
|
0.60
|
0.58590
|
|
|
8.11
|
Car Wash – not recycling water
|
Lane
|
5.70
|
5.8669.03
|
|
|
8.12
|
Car Wash – recycling water
|
Lane
|
To be
considered on a case by case basis
|
|
8.13
|
Escort Agency
|
Room
|
0.40
|
0.32550
|
|
|
8.14
|
Animal Boarding
|
Floor Area m2
|
To be
considered on a case by case basis
|
|
8.15
|
Vet Clinic or Animal Grooming
|
Floor Area m2
|
0.01
|
0.01
|
No animal washing or bathing.
|
|
8.16
|
Animal Grooming/Wash
|
Bath
|
0.50
|
0.51379
|
|
|
8.17
|
Self Storage**
|
Floor Area m2
|
0.01
|
0.01
|
Consider
the office area only
|
|
9.0
|
Food
Preparation
|
|
General
|
|
9.1
|
Restaurant / Café
|
Floor Area m2
|
0.01
|
0.00601
|
Include
the Additional floor area for on-street and al fresco dining
|
|
9.2
|
Take Away / Fast Food (no amenities)
|
Floor Area m2
|
0.02
|
0.02
|
Also
use for general food preparation
Amenities
provided for “employees only”.
|
|
|
9.3
|
Take Away / Fast Food (including amenities)
|
Floor Area m2
|
0.03
|
0.05
|
Amenities
are toilets and hand wash basins for use by customers.
|
|
|
9.4
|
Catering
|
Floor Area m2
|
0.02
|
0.02
|
The
food preparation area to be considered separately
|
|
|
Specific
|
|
|
9.5
|
Bakery
|
-
|
Use
9.2 Take Away / Fast Food (no amenities)
|
|
|
9.6
|
Butcher
|
-
|
Use
9.2 Take Away / Fast Food (no amenities)
|
|
|
9.7
|
Fishing Co-op
|
-
|
Use
9.2 Take Away / Fast Food (no amenities)
|
|
|
9.8
|
Bulk Food/Product Storage Area**
|
-
|
Use
13.2 Light Industrial. The food preparation, storage, office areas to
be considered separately.
|
|
|
10.0
|
Entertainment
|
|
|
10.1
|
Licensed
Club
|
Floor Area m2
|
The
food preparation, entertainment, office areas to be considered separately.
|
|
|
10.2
|
Pub
/ Bar
|
Floor Area m2
|
0.03
|
0.05
|
The
food preparation area to be considered separately
Use
9.1 Restaurant / Café rate for beer garden and balance of area**
|
|
|
10.3
|
Cinema
/ Theatre / Public Entertainment**
|
Seat
|
0.01
|
0.01
|
|
|
|
10.4
|
Function
/ Conference Centre**
|
Floor Area m2
|
0.01
|
0.01
|
The
food preparation area to be considered separately
Use
9.0 Food Preparation
|
|
|
10.5
|
Special
Events and Festivals**
|
|
Separate
and assess the food preparation, entertainment, amenities individually
If
more toilets are required to service the events than the existing fixtures
then portable amenities may be used. Developer charges will not be
payable for the use of portable amenities that are not connected to water or
sewerage
|
|
|
10.6
|
Marina
|
Berth
|
0.60
|
0.90
|
|
|
|
11.0
|
Sporting
/ Spectator Facilities
|
|
|
General
|
|
|
11.1
|
Gym / yoga / fitness centre**
|
Floor Area m2
|
0.01
|
0.01
|
The
food preparation area to be considered separately
Use
9.0 Food Preparation
|
|
|
Specific
|
|
|
11.2
|
Hockey Field (artificial surface)
|
-
|
To
be considered on a case by case basis
|
|
|
11.3
|
Bowling Alley
|
Lane
|
0.35
|
0.55
|
The
food preparation and office areas to be considered separately.
|
|
|
11.4
|
Bowling Green
|
-
|
Separate
and assess the Food Preparation, Amenities, Irrigation areas individually.
|
|
9.2
|
Take Away / Fast Food
(no amenities)
|
Floor Area m2
|
0.02
|
0.01302
|
Also
use for general food preparation
Amenities
provided for “employees only”.
|
|
9.3
|
Take Away / Fast Food
(including amenities)
|
Floor Area m2
|
0.03
|
0.0532
|
Amenities
are toilets and hand wash basins provided for use by customers.
|
|
9.4
|
Catering
|
Floor Area m2
|
0.02
|
0.0213
|
The
food preparation area to be considered separately
|
|
Specific
|
|
9.5
|
Bakery
|
-
|
Use 9.2
Take Away / Fast Food (no amenities)
|
|
9.6
|
Butcher
|
-
|
Use 9.2
Take Away / Fast Food (no amenities)
|
|
9.7
|
Fishing Co-op
|
-
|
Use
9.2 Take Away / Fast Food (no amenities)
|
|
9.8
|
Bulk Food/Product Storage Area**
|
-
|
Use
13.2 Light Industrial. The food preparation, storage, office areas to
be considered separately.
|
|
10.0
|
Entertainment
|
|
10.1
|
Licensed
Club
|
Floor Area m2
|
The
food preparation, entertainment, office areas to be considered
separately.
|
|
10.2
|
Pub /
Bar
|
Floor Area m2
|
0.03
|
0.03205
|
The
food preparation area to be considered separately
Use 9.1
Restaurant / Café rate for beer garden and balance of area**
|
|
10.3
|
Cinema
/ Theatre / Public Entertainment**
|
Seat
|
0.01
|
0.01
|
|
|
10.4
|
Function
/ Conference Centre**
|
Floor Area m2
|
0.01
|
0.01
|
The
food preparation area to be considered separately
Use 9.0
Food Preparation
|
|
10.5
|
Special
Events and Festivals**
|
|
Separate
and assess the food preparation, entertainment, amenities individually
If
more toilets are required to service the events than the existing fixtures then
portable amenities may be used. Developer charges will not be payable
for the use of portable amenities that are not connected to water or sewerage
The normal calculation for such types of events nominates
1 WC for each 100 males, 1 urinal for every 10 males, and 1 WC for every 25
females. These calculations arise from the Building Code of Australia
tables, with some interpretation for events i.e. may require more WCs if
serving alcohol at the event.
|
|
10.6
|
Marina
|
Berth
|
0.60
|
0.585990
|
|
|
11.0
|
Sporting
/ Spectator Facilities
|
|
General
|
|
11.1
|
Gym / yoga / fitness centre**
|
Floor Area m2
|
0.01
|
0.01
|
The
food preparation area to be considered separately
Use 9.0
Food Preparation
|
|
11.2
|
Hockey Field (artificial surface)
|
-
|
To be
considered on a case by case basis
|
|
11.3
|
Bowling Alley
|
Lane
|
0.35
|
0.35755
|
The
food preparation and office areas to be considered separately.
|
|
11.4
|
Bowling Green
|
-
|
Separate
and assess the Food Preparation, Amenities, Irrigation areas individually.
|
|
|
|
|
|
|
|
|
|
|
|
|
|
11.6
|
Swimming Pool - Indoor
|
ML
|
To
be considered on a case by case basis
|
|
11.7
|
Swimming Pool - Outdoor
|
ML
|
To
be considered on a case by case basis
|
|
12.0
|
Assembly
Type Facilities
|
|
12.1
|
Child
Care Centre / Pre-school
|
Person
|
0.06
|
0.10
|
|
|
12.2
|
Education
- School (primary & secondary)
|
Person
|
0.03
|
0.05
|
|
|
12.3
|
Education
- College, University (tertiary)
|
Person
|
0.02
|
0.02
|
Consider
and assess the Food Preparation separately
|
|
12.4
|
Correctional
Centre
|
Person
|
0.50
|
0.75
|
Example:
Prison, Gaol
|
|
12.5
|
Church
/ Place of Worship**
|
Floor Area m2
|
0.005
|
0.005
|
|
|
12.6
|
Community Building /
Hall / Library**
|
Floor Area m2
|
0.005
|
0.005
|
Refer
to dictionary in the Byron Local Environment Plan 1988 for Community Building
|
|
12.7
|
Parks
/ Gardens / Reserves (Irrigation)
|
-
|
To
be considered on a case by case basis
|
|
12.8
|
Public
Amenities (per shower)
|
Shower
|
0.40
|
0.63
|
|
|
12.9
|
Public
Amenities (per WC or Urinal)
|
WC
or Urinal
|
0.40
|
0.63
|
The
equivalent width of one urinal equals 600mm
|
|
Industrial
User Categories - Standard ET Figures
|
|
13.0
|
Industrial
General
|
|
13.1
|
Light
Industrial
|
Gross Ha
|
15.00
|
15.00
|
Gross
Ha includes Road Area
(i.e.
Length of parcel road frontage x ½ road reserve width)
|
|
13.2
|
Light
Industrial**
|
Floor Area m2
|
0.003
|
0.003
|
For
mixed use sites
|
|
13.3
|
Future
Unknown - Light
|
Gross Ha
|
15.00
|
15.00
|
Gross
Ha includes Road Area as per comments at 13.1
|
|
13.4
|
Future
Unknown - Medium
|
Gross Ha
|
30.00
|
30.00
|
Gross
Ha includes Road Area as per comments at 13.1
|
|
13.5
|
Future
Unknown - Heavy
|
Gross Ha
|
50.00
|
50.00
|
Gross
Ha includes Road Area as per comments at 13.1
|
|
|
|
**
Rate set by Local Precedence
|
|
|
|
|
|
|
|
|
|
Notes on following page.
|
11.5
|
Private Residential Swimming Pool
|
Litres
|
Not
considered as per Res 13-134
|
|
11.6
|
Commercial/Public Swimming Pool - Indoor or Outdoor
|
Litres
|
To
be considered on a case by case basis
Commercial/public
swimming pool or spa pool means a swimming pool or spa pool to which the
public is admitted, whether free of
charge, on payment of a fee or otherwise, including:
(a) a pool to which the
public is admitted as an entitlement of membership of a club, or
(b) a pool provided at
a workplace for the use of employees, or
(c) a pool provided at
a hotel, motel or guest house (including Bed & Breakfast) or at holiday
units, or similar facility, for the use of guests, or
(d) a pool provided at
a school or hospital.
|
|
12.0
|
Community
Facilities
|
|
12.1
|
Child
Care Centre / Pre-school
|
Person
|
0.06
|
0.06510
|
A person includes a student/pupil, teacher and
staff member
|
|
12.2
|
Education
– School (primary & secondary)
|
Person
|
0.03
|
0.0532
|
A person includes a student/pupil,
teacher and staff member
|
|
12.3
|
Education
- College, University (tertiary)
|
Person
|
0.02
|
0.0213
|
Consider
and assess the Food Preparation separately
|
|
12.4
|
Correctional
Centre
|
Person
|
0.50
|
0.75487
|
Example:
Prison, Gaol
|
|
12.5
|
Church
/ Place of Worship**
|
Floor Area m2
|
0.005
|
0.005
|
|
|
12.6
|
Community
Building / Hall / Library**
|
Floor Area m2
|
0.005
|
0.005
|
See Clause 6. Notes & Definitions
|
|
12.7
|
Parks /
Gardens / Reserves (Irrigation)
|
-
|
To be
considered on a case by case basis
|
|
12.8
|
Public
Amenities (per shower)
|
Shower
|
0.40
|
0.40963
|
|
|
12.9
|
Public
Amenities (per WC or Urinal)
|
WC
or Urinal
|
0.40
|
0.40963
|
The
equivalent width of one urinal equals 600mm
|
|
Industrial
User Categories - Standard ET Figures
|
|
13.0
|
Industrial
General
|
|
13.1
|
Light Industrial
|
Gross Ha
|
15.00
|
15.00
|
Gross
Ha includes Road Area
(i.e.
Length of parcel road frontage x ½ road reserve width)
|
|
13.2
|
Light
Industrial**
|
Floor Area m2
|
0.003
|
0.003
|
For
mixed use sites
|
|
13.3
|
Future
Unknown - Light
|
Gross Ha
|
15.00
|
15.00
|
Gross
Ha includes Road Area as per comments at 13.1
|
|
13.4
|
Future
Unknown - Medium
|
Gross Ha
|
30.00
|
30.00
|
Gross
Ha includes Road Area as per comments at 13.1
|
|
13.5
|
Future
Unknown - Heavy
|
Gross Ha
|
50.00
|
50.00
|
Gross
Ha includes Road Area as per comments at 13.1
|
|
|
|
** Rate
set by Local Precedence
|
|
Notes
|
|
a.
|
One (1) Local ET = Town Water Usage of 630 L/day & Sewerage
Loading of 590 L/day
|
|
b.
|
A “bedroom”
is any habitable room that, in the opinion of Council, by its physical
design, designated or capable of being used as a bedroom including separably
accessible rooms designated a bedroom, study, studio, den, attic, media room,
home office or the like other than a kitchen, WC, bathroom, dining room,
lounge room, laundry or rumpus room.
|
|
c.
|
The ET rate for units
shall be calculated on the basis of each bedroom or a room that could be used
as or perceived as a bedroom.
|
|
d.
|
“Bed” is
taken to be a single bed equating to one person
|
|
e.
|
“Floor
Area” is taken to be the “Gross Floor Area” of a
development, except where usage is proposed outside of the “Gross Floor
Area”, in which case the “Floor Area” shall be equal to the
“Gross Floor Area” plus additional area
|
|
f.
|
Assessed ET rounded to
the second decimal place e.g. calculated at 7.456 ET = 7.46 ET
|
|
g.
|
Additional definitions
– utilise dictionary in the Byron Local Environment Plan 1988
|
6. NOTES
& DEFINITIONS
|
a.
|
One (1)
Local ET = Town Water Usage of 630 L/day & Sewerage Loading of 590 L/day
|
|
b.
|
The ET rate for units
shall be calculated on the basis of each bedroom or a room that could be used
as or perceived as a bedroom.
|
|
c.
|
Assessed ET rounded to
the second decimal place e.g. calculated at 7.456 ET = 7.46 ET
|
|
d.
|
Ancillary use:
Ancillary means 1.
Subordinate; subsidiary. 2. Auxiliary; helping - The definition of ancillary
means something that is helping or subordinate, but not as necessary.
A conference room in a
holiday complex is NOT ancillary and will attract ET loading. It is an
additional feature of the holiday complex which is essentially approved for
short term accommodation.
A bathroom or toilet
servicing a number of offices/retail stores in the same building can be
considered as ancillary –the bathroom is subordinate to the office in
that it is a requirement for people working in the office/retail store. The
offices/retail stores attract the ET load already.
A baggage store at a
hotel can argued to be ancillary as it is only used for temporary storage and
security of luggage for people prior to departure. It’s not
occupied by people that would create an ET load.
The use of the word
Ancillary in the EP&A Act and Regulations is not the same as it is used
in this policy.
|
|
e.
|
“Bed”
is taken to be a single bed equating to one person
|
|
f.
|
A “bedroom”
is any habitable room that, in the opinion of Council, by its physical
design, designated or capable of being used as a bedroom including separably
accessible rooms designated a bedroom, study, studio, den, attic, media room,
home office or the like other than a kitchen, WC, bathroom or laundry.
|
|
g.
|
A "bulk store" means
a building or place used for the warehousing of goods, where the goods stored
or to be stored are not required for use in a shop or commercial premises on
the same parcel of land or on the adjoining land in the same ownership.
|
|
h.
|
A “community
building” means a building or place owned, occupied or operated by
the council or another public or local authority and used to provide facilities
comprising or relating to any one or more of the following:
(a)
a library, rest room, meeting room, neighbourhood centre, senior citizens
centre, youth centre, welfare centre or any similar place, or
(b)
health centre or place providing similar services, or
(c)
indoor recreation, child minding or any similar activity, or
(d)
arts and craft centre, information centre or kiosk.
|
|
i.
|
Developable Size: refer to Byron Local Environment Plan 2014
and/or Council’s current Development Control Plan for guidance on
minimum size of a Developable Lot.
|
|
j.
|
Dry weather flow
definition:
The average daily flow
to the treatment works during seven consecutive days without rain (excluding
a period which includes public holidays) following seven days during which the
rainfall did not exceed 0.25 millimetres on any one day.
|
|
k.
|
“Floor Area”
is taken to be the “Gross Floor Area” of a development, except
where usage is proposed outside of the “Gross Floor Area”, in
which case the “Floor Area” shall be equal to the “Gross
Floor Area” plus additional area
|
|
l.
|
Restaurant versus Take Away:
Restaurant or cafe means a building or place the principal purpose of
which is the preparation and serving, on a retail basis, of food and drink to
people for consumption on the premises.
Take Away food and drink premises means
premises that are predominantly used for the preparation and retail sale of
food or drink (or both) for immediate consumption away from the premises.
|
|
m.
|
A
“swimming pool”, including a spa, is subject to Public
Health Act 2010 & Regulation 2012 requirements.
Water
and sewerage load demands from the pool will be generated by top-up water
requirements due to splash-out, evaporation, backwash water demand and
backwash water discharged to sewer. Reference is made to the “NSW Heath
- Swimming Pool and Spa Advisory Document 2013” to calculate loadings,
consideration is given to:
• The
volume of the pool.
• cross-sections
of the pool structure which show depths.
• The
turnover rate of the pool.
• The
daily volume of make-up water required for the pool.
• The
daily volume of backwash water discharged to sewer.
|
|
n.
|
Torrens Title Lot
versus Strata Lot:
Strata
lots are only air space sitting on a parent Torrens Title Lot; it is intent
of the policy to deal only with Torrens title lots. Hence, a strata lot
is assessed as a dwelling or for the land use category itself.
A
vacant strata lot, without a specified land use, will be assessed as one (1)
ET.
From Water Management
Regulations:
WATER MANAGEMENT
(GENERAL) REGULATION 2011 - REG 139 Sewerage service not to be shared
Subclause (4) For the
purposes of this clause, the separate lots in a strata scheme under the
Strata Schemes (Freehold Development) Act 1973 or the Strata Schemes
(Leasehold Development) Act 1986 are taken to constitute a single parcel of
land.
|
|
o.
|
Additional
definitions – may use
dictionary in the Byron Local Environment Plan 2014 or words and phrases are
not defined in LEP 2014 then refer to the meaning defined in the Dictionary
contained in Appendix A1 of the Byron Shire Development Control Plan 2014
|
|
POLICY TITLE
|
IN CAPS, NOT BOLD
|
Staff Reports - Infrastructure Services 4.4
Report No. 4.4 State
Government Water and Sewerage Performance Reports
Directorate: Infrastructure
Services
Report
Author: Peter
Rees, Manager Utilities
File No: I2017/1234
Theme: Community Infrastructure
Water Supplies
Summary:
The attached documents are the Department of Primary
Industries (Water) triple bottom line Performance Report for Byron Shire
Council’s Water and Sewerage operations in 2015-16. This report is
prepared by the DPI Water for all Local Government water and sewerage
authorities. It is prepared from data submitted by Councils through
financial special schedules and operational data annual submissions.
The Best Practice Guidelines and performance reports have
proved to be valuable tools for assessing the performance of the Water Supply
and Sewerage operations. The performance reports provide a benchmark tool
for setting operational targets and continuously improving performance.
Water and Sewerage operations have embedded the key KPIs in monthly management
reports. This has streamlined the data collating and analysis process and
provided significant benefits to the overall performance of the group.
It forms part of the National Water Initiative of the
Federal Government for Water Utilities with greater than 10,000 assessments.
|
RECOMMENDATION:
That the Water Waste and Sewer Advisory Committee note
the continuing improving performance in both cost and service delivery for
the Water and Sewer services.
|
Attachments:
1 Water
Supply TBL 2015-16 BYRON, E2017/82391
, page 65⇩ 
2 Water
Supply Action Plan 2015-16 - Byron Shire Council, E2017/82390 , page 67⇩
3 SewerageTBL
2015-16 BYRON, E2017/82389 , page 70⇩
4 Sewerage
Action Plan 2015-16 - Byron Shire Council, E2017/82388
, page 72⇩
Report
The NSW Best Practice Management Guidelines for Water Supply
and Sewerage were developed to encourage effective and efficient delivery of
water supply and sewerage services. The guidelines set out six criteria
for achievement of best practice management. Byron Shire Council has
conducted audits and achieved compliance with all of the best practice
guidelines for both Water and Sewerage.
It should be noted however, to continue to achieve BPM
Council needs to prepare a new 30 year Integrated Water Cycle Management
Strategy. Utilities has commenced this process and expect to finalise a
draft early in the new year.
Performance reporting is one of the best practice
criteria. The data submitted covers the triple bottom line concept of
performance measurement. The triple bottom line concepts are economic,
environmental and social. One key element of the compilation of the
performance report is the collection of accurate data. The water and
sewerage business has, over the past fifteen years, progressively implemented
systems to enable the accurate and timely collection of the required data.
The businesses utilize this performance data to produce monthly production
reports that measure the performance of the operations.
The Best Practice Guidelines and performance reports have
proved to be valuable tools for assessing the performance of the Water Supply
and Sewerage operations. The performance reports provide a benchmark tool
for setting operational targets and continuously improving performance. Water
and Sewerage operations have embedded the key KPIs in monthly management
reports. This has streamlined the data collating and analysis process and
provided significant benefits to the overall performance of the group.
The performance data for 2015-16 was submitted to DPI Water
in the time frames required. Copies of the Water Supply and Sewerage 2015-16
Performance Reports are included as attachments to this report. Also included
in the report this year are recommended action plans as a result of the
reported data.
Characteristics
A significant indicator in this group is the number of
employees per 1000 properties. Byron Shire has a slightly higher than average
result for sewerage operations with 1.8 employees per 1000 properties, whereas
water operations has a lower than average with 0.8 employees per 1000
properties. In Byron Shire however, there is a high degree of multi skilling
with many employees working across both areas of operation. If the groups are
combined there are a total of 2.6 employees per 1000 properties compared to the
state median of 3.2.
A key characteristic of Byron Shire’s water and
sewerage employee profile is the high proportion of staff in the field versus
staff in the office (Engineers and Managers). In the operations section we have
29 field staff and 4 office based staff; with 10% of the field staff being apprentices
and trainees.
Social – Charges & Bills
Byron Shire has been rated as satisfactory to very good in
all Social – Charges performance indicators. The typical residential bill
for water is less than the state median. The typical residential bill for
sewerage remains significantly higher but the gap will close over the coming
years.
Social – Health
Byron Shire’s social – health performance
remains in the highest performance percentile for all the water
indicators. For sewerage the ratings were satisfactory to very good.
Social – Levels of Service
Byron Shire continues to achieve excellent results in both
the water and sewerage key indicators of customer service. For water the result
0 complaints per 1000 properties versus a state median of 3. For sewerage the
result was 1 versus a state median of 0.9. For water supply, quality
performance still outperforms the state median with only 1.0 complaint per 1000
properties versus 3 across the state.
One area of concern that continues to require monitoring is
odour complaints in the sewerage performance. Council’s result has
improved in recent years from 2.1 to 1.0 complaints per 1000 properties
compared to a state median of 0.9. These complaints are associated with
sewer pump stations. Council has several pump stations located in heavily
populated areas. Odour control devices have been installed on all of
these sites however more work is required.
Environmental
Water – The “Average Annual Residential Water
Consumption” for coastal LWUs indicator has fallen to 169
kL/property. The Real Losses/ Leakage indicator curiously however, has increased
from 50 litres/service connection/day to 90. This data requires more analysis.
Sewer – The key sewer environmental performance was
positive with most key indicators being rated as good to very good. Compliance
with Suspended Solids in EPA licences was highlighted as “may require
review”. This result was entirely attributable to the aging Ocean Shores
STP. Council has prepared a process review and has commenced the project to
either upgrade this facility – which would require a total rebuild
– or transfer to the new Brunswick Valley STP.
The latter option has the potential to reduce the whole of
life NPV of the required Ocean Shores STP upgrade project by approximately
$12.6 million as well as allowing the construction of the originally proposed
wetlands and effluent storage ponds for the Brunswick Valley Sewage Augmentation
scheme. Council is progressing the project and has resolved to undertake a Risk
Assessment analysis of the transfer option. This work is in progress.
Another indicator that has reduced in relative terms is the
percentage of effluent recycled. This has fallen from 14% in 2014-15 to 11% in
2015-16. This is due to one of the two farmers utilising the Main Arm scheme
not using water and the maturation of both the Byron bay 24 Hectare Melaleuca
and the Bangalow Bamboo plantations reducing the volume of water required.
It should be noted however, these figures do not include the
water recycled in Councils 27 hectares of wetlands at Byron Bay and Ocean
Shores. It is estimated that approximately 300 megalitres per annum of
recycled water is utilised by these schemes. This usage has not been reported
– an oversight that will be corrected in the current year reporting. If
this figure is included, Council’s percentage of effluent recycled would
increase to approximately 20%.
Economic
Water – The water fund is free from debt and is
forecast to be cash positive for the foreseeable future with significant levels
of cash to be generated that will provide flexibility when considering capital
projects such as the Mullumbimby Water Treatment Plant upgrade.
The water economic efficiency was excellent with all the key
measures (Management, Treatment, and Water Mains) at less than the State median
cost. The break up of the total Operations and Maintenance Cost per property is
Rous Bulk Water $211
Management $137
Operations $89
Maintenance
$30
Chemicals $5
Clearly the largest cost source is Rous Water which has been
the sole driver of the increase in this cost indicator over the past 10 years.
During this time O&M and Management costs controlled by Council have
actually decreased.
Sewer – The sewer financial economic performance
achieved significant improvement this year with loan repayments dropping from
$489 to $347 per property; return on assets increasing to 3.6% (up from 1.6%)
and the Economic Real Rate of Return increasing from 4% to 6% this year. This
is due in part to rationalising of the loan portfolio and active management of
the financial assets by Council’s Finance Manager.
The Sewer Fund still has a large outstanding debt due to the
$80 million capital upgrade programme completed in 2011. The recently
completed Strategic Business Plan indicates the Sewer Fund could become debt
free by 2021. As with the Water Fund this will provide flexibility when
planning for the next round of major capital works of the Ocean Shores STP
upgrade (2020) and the Byron Bay STP upgrade (2025).
One issue that needs to be considered is the rehabilitation
of the decommissioned sewage treatment plant sites at South Byron, Brunswick
Heads and Mullumbimby. It has always been assumed these would be revenue
neutral. This currently does not look like being achieved and will need
to be factored into future planning although it is not expected to have a
material impact.
The sewer economic efficiency has also demonstrated significant
improvement with the all key indicators either static or falling. The
operating cost per property / per 100 km of main / per kilolitre all fell this
year and continue to show a 10 year downward trend. The graph of
the OMA over the past 10 years clearly demonstrates Council has held costs
static over this time which represents a real reduction after inflation.
This compares favourably to the state situation where
overall costs have been increasing and has been achieved without compromising
the outputs of lower overflows, improved odour complaints, higher safety
standards and higher standards of sewage treatment. It is expected Council will
achieve a quantum reduction in OMA if the aging Ocean Shores treatment plant is
closed and transferred to the new Brunswick Valley facility.
This overall financial health is due to the economic
efficiency of the day to day operations and the efficient execution of the
major capital projects. Council recently commissioned 2 new reservoirs
(Cooper Shoot and Bangalow) which were both completed within the forecast
budget of $5 million. This reflects the active approach to overall cost control
in the Water and Sewer Services.
Financial Implications
The continued good performance in the water and sewerage
operations is contributing to the overall health of the water and sewerage
funds. This provides Council with the financial capacity to implement community
aspirations in these areas.
Statutory and Policy Compliance Implications
It is a requirement of the NSW DPI Water Best Practice
Management Guidelines that these performance reports are reported to Council.
Staff Reports - Infrastructure Services 4.4 - Attachment 1

Staff Reports - Infrastructure Services 4.4 - Attachment 2
WS Action Plan 2015-16 - Byron Shire
Council
Byron Shire Council Water Supply – Action Plan Page 1
|
|
Summary
In 2015-16, Byron Shire Council implemented all the water supply outcomes
required by the NSW Best-Practice Management Framework and its
performance has been [to be completed by Council].
Key actions from Council's Strategic
Business Plan:
- Insert achievements for Key Action 1 here for Byron
Shire Council
- Insert achievements for Key Action 2 here for Byron
Shire Council
|
|
|
|
INDICATOR
|
RESULT2
|
COMMENT/DRIVERS
|
ACTION
|
|
|
Best-Practice
Management Framework
|
Implemented all the
Best-Practice Required Outcomes1
|
Very good
|
Implementation
demonstrates effectiveness and sustainability of water supply business. 100%
implementation is required for eligibility to pay an ‘efficiency
dividend’.
|
Prepare a new 30-year
IWCM Strategy, Financial Plan and Report in accordance with the July 2014
IWCM Check List (www.water.nsw.gov.au).
|
|
CHARACTERISTICS
|
|
5
|
Connected property
density
|
43 per km of main
|
|
A connected property
density below 30 can significantly increase the cost per property of
providing services, as will also a high number of small discrete water supply
schemes.
|
|
|
Highest ranking (1, 1)
|
|
9
|
Renewals expenditure
|
2.9%
|
Very good
|
Adequate funds must be
programmed for works outlined in the Asset Management Plan – page 3 of
the 2014-15 NSW Performance Monitoring Report.
|
FOR INDICATORS 9 to 56
Where ranking is low, investigate reasons including past performance and
trends, develop remedial action plan and summarise in this column.
|
|
Highest ranking (1, 1)
|
|
10
|
Employees
|
0.8 per 1,000 props
|
|
|
|
|
Highest ranking (1, 1)
|
|
SOCIAL -
CHARGES
|
|
12
|
Residential water usage
charge
|
247 c/kL
|
Good
|
Benefits of strong
pricing signals are shown on page 5 of the 2014-15 NSW Performance Monitoring
Report.
|
|
|
High ranking (2, 2)
|
|
13
|
Residential access
charges
|
$179 per assessment
|
Good
|
|
See 16.
|
|
Highest ranking (1, 1)
|
|
14
|
Typical residential bill3
(TRB)
|
$596 per assessment
|
Good
|
TRB should be consistent
with projection in the financial plan. Drivers – OMA Management Cost
and Capital Expenditure.
|
See 43.
|
|
High ranking (2, 2)
|
|
15
|
Typical developer charges
|
$3600 per ET
|
|
|
|
|
Low ranking (4, 4)
|
|
16
|
Residential revenue from
usage charges
|
70% of residential bills
|
Satisfactory
|
≥ 75% of
residential revenue should be generated through usage charges.
|
|
|
Median ranking (3, 3)
|
|
SOCIAL –
HEALTH
|
|
19
|
Physical quality compliance
|
Yes
|
Very good
|
|
|
|
Highest ranking (1, 1)
|
|
19a
|
Chemical quality
compliance
|
Yes
|
Very good
|
|
|
|
Highest ranking (1, 1)
|
|
20
|
Microbiological
compliance4
|
Yes
|
Very good
|
Critical indicator. LWUs
should annually review their DWMS in accordance with NSW guidelines4.
|
|
|
Highest ranking (1,
1)
|
1.
Council needs to annually ‘roll forward’, review and update its
30-year total asset management plan (TAMP) and 30-year financial plan, review
Council's TBL Performance
Report and prepare an Action Plan to Council. The Action Plan is to
include any actions identified in Council’s annual review of its DWMS
(Indicator 20) and any section 61 Reports from DPI Water. Refer to pages 21, 98
and 102 of the 2015-16 NSW Water Supply and Sewerage Performance Monitoring
Report.
2. The ranking relative to
similar size LWUs is shown first (Col. 2 of TBL Report) followed by the ranking
relative to all LWUs (Col. 3 of TBL Report).
3. Review and comparison of
the 2016-17 Typical Residential Bill (Indicator 14) with the projection
in the later of your IWCM Strategy and financial
plan and your Strategic Business Plan is mandatory.
In addition, if both indicators 43 and 44 are negative, you
must report your proposed 2017-18 typical residential bill to achieve full cost
recovery.
4.
Microbiological compliance (Indicator 20) is a high priority for
each NSW LWU. Corrective action for non-compliance (≤97%), or any
‘boil water
alerts’ must be reported in your Action Plan.
Refer to pages 5, 6 and 21 of the 2015-16 NSW Water Supply and Sewerage
Performance Monitoring
Report (www.water.nsw.gov.au) and NSW Guidelines for drinking water quality
management systems, NSW Health and NSW Office of Water, 2013.
|
Byron Shire Council Water Supply – Action Plan Page 2
|
|
|
|
INDICATOR
|
RESULT
|
COMMENT/DRIVERS
|
ACTION
|
|
SOCIAL –
LEVELS OF SERVICE
|
|
25
|
Water quality complaints
|
1.4 per 1,000 props
|
Satisfactory
|
Critical indicator of
customer service.
|
|
|
Median ranking (3, 3)
|
|
26
|
Service complaints
|
0 per 1,000 props
|
Very good
|
Key indicator of customer
service.
|
|
|
Highest ranking (1, 1)
|
|
27
|
Average frequency of
unplanned interruptions
|
13 per 1,000 props
|
Good
|
Key indicator of customer
service, condition of network and effectiveness of operation.
|
|
|
High ranking (2, 3)
|
|
30
|
Number of main breaks
|
7 per 100km of main
|
Good
|
Drivers – condition
and age of water mains, ground conditions.
|
|
|
High ranking (2, 2)
|
|
32
|
Total Days Lost
|
0.3%
|
Good
|
|
|
|
High ranking (2, 2)
|
|
ENVIRONMENTAL
|
|
33
|
Average annual
residential water supplied
|
169 kL per prop
|
|
Drivers – available
water supply, climate, location (Inland or coastal), pricing signals
(Indicator 3), restrictions.
|
|
|
Median ranking (3, 2)
|
|
34
|
Real losses (leakage)
|
90 L/c/d
|
May require review
|
Loss reduction is
important where an LWU is facing drought water restrictions or the need to
augment its water supply system.
|
|
|
Low ranking (4, 3)
|
|
ECONOMIC
|
|
43
|
Economic Real Rate of
Return (ERRR)
|
3.1%
|
Good
|
Reflects the rate of
return generated from operating activities (excluding interest income and
grants).
An ERRR or ROA of ≥
0% is required for full cost recovery.
|
|
|
High ranking (2, 1)
|
|
44
|
Return on assets (ROA)
|
3.6%
|
|
See 43.
|
|
|
High ranking (2, 2)
|
|
45
|
Net debt to equity
|
11%
|
Good
|
LWUs facing significant
capital investment are encouraged to make greater use of borrowings –
page 13 of the 2014-15 NSW Performance Monitoring Report.
|
|
|
High ranking (2, 1)
|
|
46
|
Interest cover
|
3
|
|
Drivers – in general,
an interest cover > 2 is satisfactory.
|
|
|
Highest ranking (1, 1)
|
|
47
|
Loan payment
|
$0 per prop
|
|
The component of TRB
required to meet debt payments.
Drivers – expenditure on capital works, short term loans.
|
|
|
Low ranking (4, 3)
|
|
49
|
Operating cost (OMA)
|
$471 per prop
|
May require review
|
Prime indicator of the
financial performance of an LWU.
Drivers – development density, level of treatment, management cost,
topography, number of discrete schemes and economies of scale.
|
Review components
carefully to ensure efficient operating
cost.
|
|
Low ranking (4, 2)
|
|
51
|
Management cost
|
$137 per prop
|
Good
|
Typically about 40% of
the OMA.
Drivers – No. of
employees. No. of small discrete water schemes.
|
|
|
High ranking (2, 2)
|
|
52
|
Treatment cost
|
$21 per prop
|
Very good
|
Drivers – type and
quality of water source. Size of treatment works
|
|
|
Highest ranking (1, 1)
|
|
53
|
Pumping cost
|
|
Not reported
|
Drivers –
topography, development density and location of water source.
|
|
|
|
|
55
|
Water main cost
|
$54 per prop
|
Very good
|
Drivers – age and
condition of mains. Ground conditions. Development density.
|
|
|
Highest ranking (1, 1)
|
|
56
|
Capital expenditure
|
$243 per prop
|
Satisfactory
|
An indicator of the level
of investment in the business.
Drivers – age and
condition of assets, asset life cycle and water source.
|
|
|
Median ranking (3, 2)
|
Staff Reports - Infrastructure Services 4.4 - Attachment 3
Staff Reports - Infrastructure Services 4.4 - Attachment 4
SGE Action Plan 2015-16 - Byron Shire
Council
Byron Shire Council Sewerage – Action Plan Page 1
|
|
Summary
In 2015-16, Byron Shire Council implemented all the sewerage outcomes
required by the NSW Best-Practice Management Framework and its
performance has been [to be completed by Council].
Key actions from Council's Strategic
Business Plan:
- Insert achievements for Key Action 1 here for Byron
Shire Council
- Insert achievements for Key Action 2 here for Byron
Shire Council
|
|
|
|
INDICATOR
|
RESULT2
|
COMMENT/DRIVERS
|
ACTION
|
|
|
Best-Practice
Management Framework
|
Implemented all the Best
Practice Required Outcomes1
|
Very good
|
Implementation
demonstrates effectiveness and sustainability of water supply and sewerage
business. 100% implementation is required for eligibility to pay an
‘efficiency dividend’.
|
Prepare a new 30-year
IWCM Strategy, Financial Plan and Report in accordance with the July 2014
IWCM Check List (www.water.nsw.gov.au).
|
|
CHARACTERISTICS
|
|
5
|
Connected property
density
|
38 per km of main
|
Similar to the statewide
median of 38
|
A connected property
density below about 30 can significantly increase the cost per property of
providing services.
|
|
|
7
|
Renewals expenditure
|
0.6%
|
Good
|
Adequate funds must be
programmed for works outlined in the Asset Management Plan – page 3 of
the 2014-15 NSW Performance Monitoring Report.
|
FOR INDICATORS 7 to 57
Where ranking is low, investigate reasons including past performance and
trends, develop remedial action plan and summarise in this column.
|
|
High ranking (2, 3)
|
|
8
|
Employees
|
1.8 per 1,000 props
|
Satisfactory
|
|
|
|
Median ranking (3, 3)
|
|
SOCIAL –
CHARGES
|
|
12
|
Typical residential bill3
(TRB)
|
$1149 per assessment
|
|
TRB should be consistent with
projection in the financial plan.
Drivers – OMA
Management Cost and Capital Expenditure.
|
|
|
Lowest ranking (5, 5)
|
|
13
|
Typical Developer Charges
|
$9990 per ET
|
Good
|
|
|
|
Highest ranking (1, 1)
|
|
14
|
Non-residential sewer
usage charge
|
247c/kL
|
Good
|
Similar to OMA cost of
221c/kL.
|
|
|
High ranking (2, 1)
|
|
SOCIAL - HEALTH
|
|
16
|
Sewerage coverage
|
99.6%
|
Very good
|
|
|
|
Highest ranking (1, 1)
|
|
17
|
Percent sewage treated to
tertiary level
|
100%
|
Good
|
|
|
|
High ranking (2, 2)
|
|
18
|
Percent of sewage volume
that complied
|
94%
|
Satisfactory
|
Key indicator of
compliance with regulator.
|
|
|
Median ranking (3, 3)
|
|
19
|
Sewage treatment works
compliant at all times
|
1 of 4
|
|
Key indicator of
compliance with regulator.
|
|
|
|
|
SOCIAL –
LEVELS OF SERVICE
|
|
21
|
Odour Complaints
|
1 per 1,000 props
|
May require review
|
Critical indicator of
customer service and operation of treatment works.
|
|
|
Low ranking (4, 4)
|
|
22
|
Service complaints
|
1 per 1,000 props
|
Very good
|
Key indicator of customer
service.
|
|
|
Highest ranking (1, 1)
|
|
23a
|
Average Duration of
Interruption
|
60 minutes
|
Very good
|
Key indicator of customer
service, condition of network and effectiveness of operation.
|
|
|
Highest ranking (1, 1)
|
|
25
|
Total Days Lost
|
0.3%
|
Good
|
|
|
|
High ranking (2, 2)
|
1.
Council needs to annually ‘roll forward’, review and update its
30-year total asset management plan (TAMP) and 30-year financial plan, review
Council's TBL Performance
Report and prepare an Action Plan to Council. The Action Plan is to
include any actions identified in Council’s section 61 Reports from DPI
Water. Refer to pages 21, 98 and 102 of the 2015-16 NSW Water Supply and
Sewerage Performance Monitoring Report.
|
Byron Shire Council Sewerage – Action Plan Page 2
|
|
|
|
INDICATOR
|
RESULT
|
COMMENT/DRIVERS
|
ACTION
|
|
ENVIRONMENTAL
|
|
26
|
Volume of sewage
collected per property
|
299 kL
|
|
Compare sewage collected
to water supplied.
|
|
|
Lowest ranking (5, 5)
|
|
27
|
Percentage effluent
recycled
|
11%
|
Satisfactory
|
Key environmental
indicator.
Drivers – availability of potable water, demand, proximity to
customers, environment.
|
|
|
Median ranking (3, 3)
|
|
28
|
Biosolids reuse
|
100%
|
Very good
|
Key environmental
indicator.
|
|
|
Highest ranking (1, 1)
|
|
32
|
Net Greenhouse gas
emissions (WS & Sge)
|
170 t CO2/1000 props
|
Very good
|
Drivers – gravity
vs pumped networks, topography, extent of treatment.
|
|
|
Highest ranking (1, 1)
|
|
34
|
Compliance with BOD in
licence
|
100%
|
Very good
|
Key indicator of
compliance with regulator requirements.
|
|
|
Highest ranking (1, 1)
|
|
35
|
Compliance with SS in
licence
|
98%
|
May require review
|
Drivers – algae in
maturation ponds, impact of drought.
|
|
|
Lowest ranking (5, 4)
|
|
36
|
Sewer main breaks and
chokes
|
21 per 100km of main
|
Good
|
Drivers – condition
and age of assets, ground conditions.
|
|
|
High ranking (2, 2)
|
|
37a
|
Sewer overflows to the
environment
|
2 per 100km of main
|
Very good
|
Drivers – condition
of assets, wet weather and flooding.
|
|
|
Highest ranking (1, 3)
|
|
39
|
Non-residential
percentage of sewage collected
|
25%
|
|
For non-residential,
compare % of sewage collected to indicator 43
(% of revenue).
|
|
|
Median ranking (3, 2)
|
|
ECONOMIC
|
|
43
|
Non-residential revenue
|
25%
|
Good
|
See 39 above.
|
|
|
High ranking (2, 2)
|
|
46
|
Economic Real Rate of
Return (ERRR)
|
6%
|
Good
|
Reflects the rate of
return generated from operating activities (excluding interest income and
grants).
An ERRR or ROA of ≥
0% is required for full cost recovery.
|
|
|
Highest ranking (1, 1)
|
|
46a
|
Return on assets
|
3.6%
|
|
See 46.
|
|
|
Highest ranking (1, 1)
|
|
47
|
Net debt to equity
|
11%
|
Good
|
LWUs facing significant
capital investment are encouraged to make greater use of borrowings –
page 14 of the 2014-15 NSW Performance Monitoring Report.
|
|
|
High ranking (2, 1)
|
|
48
|
Interest cover
|
3
|
|
Drivers – in general,
an interest cover of > 2 is satisfactory.
|
|
|
Highest ranking (1, 1)
|
|
48a
|
Loan payment
|
$347 per prop
|
Good
|
The component of TRB
required to meet debt payments.
Drivers – expenditure on capital works, short term loans.
|
|
|
Highest ranking (1, 1)
|
|
50
|
Operating cost (OMA)
|
$662 per prop
|
May require review
|
Prime indicator of the
financial performance of an LWU.
Drivers – development density, level of treatment, management cost,
topography, number of discrete schemes and economies of scale.
|
Review carefully to
ensure efficient operating cost.
|
|
Lowest ranking (5, 5)
|
|
52
|
Management cost
|
$158 per prop
|
Good
|
Drivers –number of
discrete schemes, number of employees. Typically about 40% of OMA.
|
|
|
High ranking (2, 3)
|
|
53
|
Treatment cost
|
$268 per prop
|
May require review
|
Drivers – type and
level of treatment, economies of scale.
|
|
|
Lowest ranking (5, 5)
|
|
54
|
Pumping cost
|
$117 per prop
|
May require review
|
Drivers –
topography, development density, effluent recycling.
|
|
|
Lowest ranking (5, 5)
|
|
56
|
Sewer main cost
|
$103 per prop
|
May require review
|
Drivers –
topography, development density, effluent recycling.
|
|
|
Lowest ranking (5, 5)
|
|
57
|
Capital expenditure
|
$110 per prop
|
May require review
|
An indicator of the level
of investment in the business.
Drivers – age and
condition of assets, asset life cycle.
|
|
|
Lowest ranking (5, 4)
|
2. The ranking relative to
similar size LWUs is shown first (Col. 2 of TBL Report) followed by the ranking
relative to all LWUs (Col. 3 of TBL Report).
3. Review and comparison of
the 2016-17 Typical Residential Bill (Indicator 12) with the projection
in your Strategic Business Plan is mandatory.
In
addition, if both indicators 46 and 46a are negative, you must report your
proposed 2017-18 typical residential bill to achieve full cost recovery.
Staff Reports - Infrastructure Services 4.5
Report No. 4.5 Byron
Shire Effluent Management Strategy (Draft)
Directorate: Infrastructure
Services
Report
Author: Peter
Rees, Manager Utilities
File No: I2017/1235
Theme: Community Infrastructure
Sewerage Services
Summary:
The attached document has been prepared as a shire wide
effluent management strategy replacing the 2006 adopted Byron Bay Effluent
Management Strategy. The Byron Bay strategy focussed on 3 streams of
recycled water use:-
- Urban
Reuse Corridor
- Regeneration
Projects
- Rural
Lands Project
Of these streams, the urban reuse corridor has been the most
successful in terms of identified connections with over 70% of the identified
users being connected. The quantity of recycled water used however has
been low with the largest user being the Byron Bay Golf Course.
Regeneration projects have been the most successful as far
as recycled water usage particularly if the wetlands are considered for their
water usage. The number of projects, however, has been limited with only
the West Byron Wetlands and the Melaleuca Plantation being implemented.
The largest identified project in the 2006 strategy was the
Tyagarah Turf Farm. The project was put on hold by Council in 2007 when
the Turf Farm pulled out of the project and it became unviable. Ironically, the
new owner of the Turf farm has approached Council to restart the project.
For the shire wide strategy, it is therefore recommended
Regeneration and Rural lands (including Biomass cropping) projects be the
mainstay of the Effluent Management Strategy with continued expansion of the
Byron Bay Urban Reuse corridor.
|
RECOMMENDATION:
That the Water Waste and Sewer Advisory
Committee note the Byron Shire Effluent Management Strategy and recommend its
adoption by Council.
Or
The Committee have an extraordinary meeting to workshop
the strategy.
|
Attachments:
1 Byron
Shire Effluent Management Strategy Rev 2, E2017/86469
, page 77⇩
Report
In 2006 Council adopted the Byron Bay Effluent Management
Strategy which has directed Council’s recycled water schemes. When
expanding the Byron Bay urban recycled water scheme in 2016, it was suggested
by the General Manager that it was an appropriate time to review the strategy
and consider the whole shire when doing so.
The draft strategy has been developed for the next 10 years
and is attached. It has built on Council’s successes to date and
also the general industry progression in recycled water use. For Byron
Shire’s strategy the important points to note are
Urban recycled water schemes (dual reticulation) generally
do not provide the biggest volume of recycled water usage. The strategy
therefore does not propose development of any further schemes in the Shire
other than maximising the usage of the existing scheme in Byron Bay.
The strategy pursues schemes that provide Council with a
large degree of control of the amount of recycled water usage – projects
such as wetlands and biomass cropping.
The key points of the draft strategy are therefore:-
· Dual reticulation has
been allowed for in the new West Byron development in accordance with the
current draft DCP for the area.
· Expansion of the urban
scheme west along Ewingsdale Road to the farm and the Hospital site.
· Reactivation of the
Tyagarah Turf Farm recycled water project following discussions with the new
owner.
· Wetland expansion in the
Belongil catchment.
· Wetland expansion at
Brunswick Valley STP
· Wetland expansion at the
old Ocean Shores STP
· Biomass crops at
Brunswick Valley and Bangalow STPs.
The draft strategy has to date been driven by staff and is
now ready to be workshopped through the Councillors and the Water Waste and
Sewer Committee.
Financial Implications
Not applicable
Statutory and Policy Compliance Implications
Not applicable
Staff Reports - Infrastructure Services 4.5 - Attachment 1

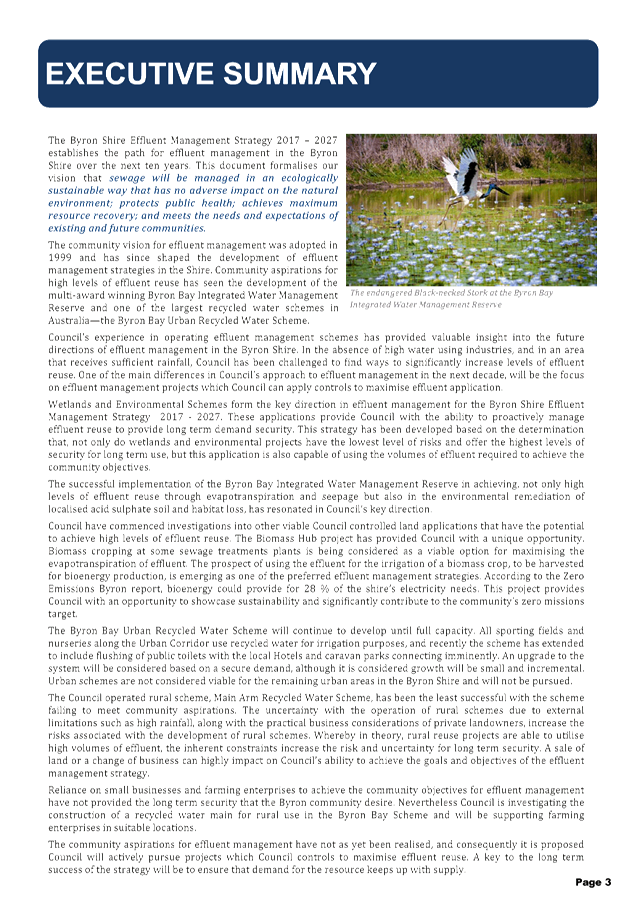

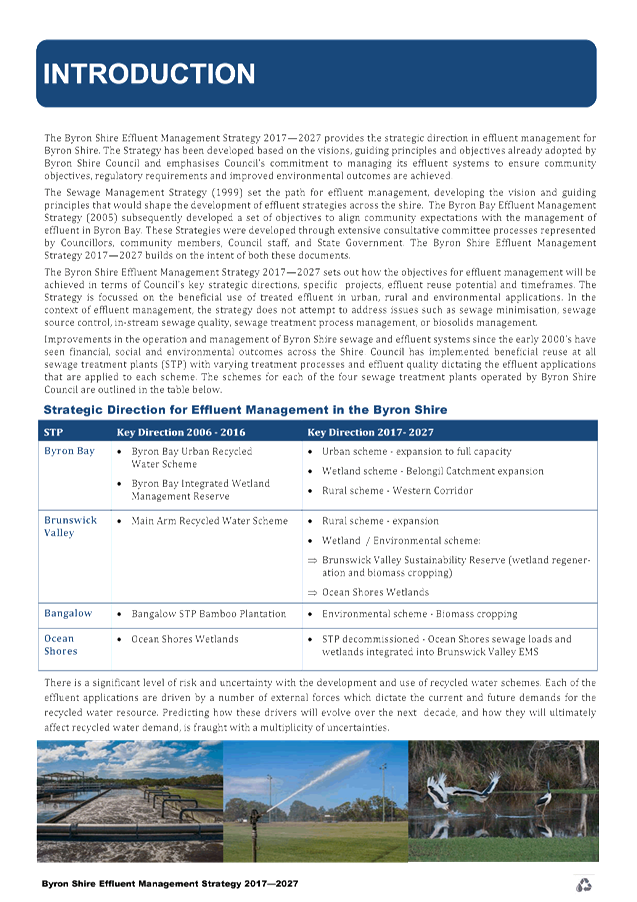
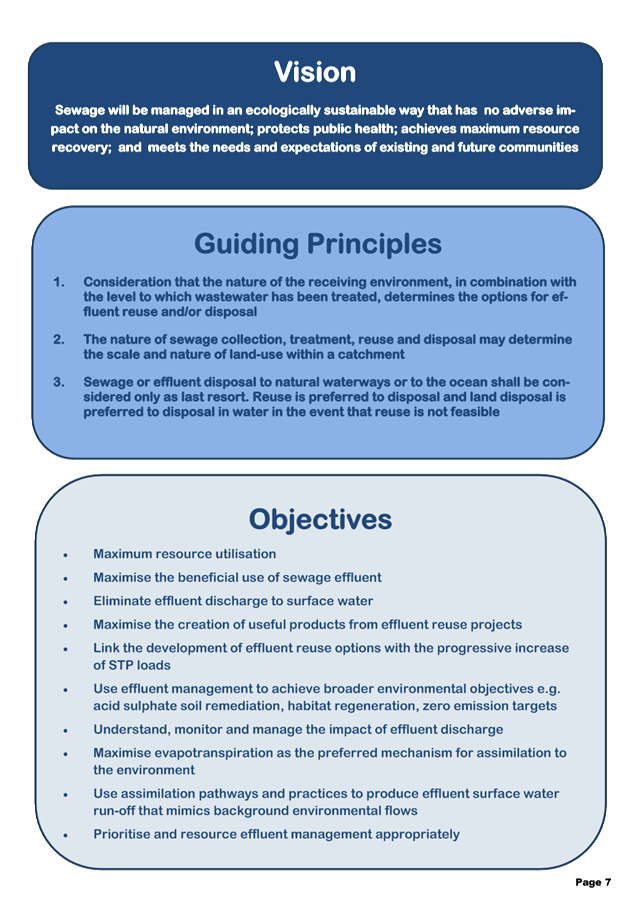
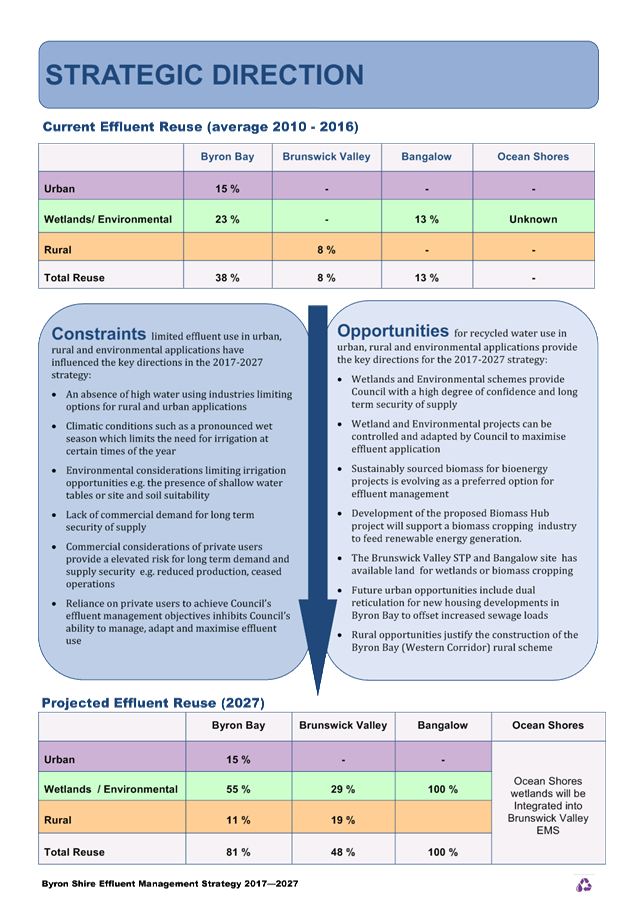
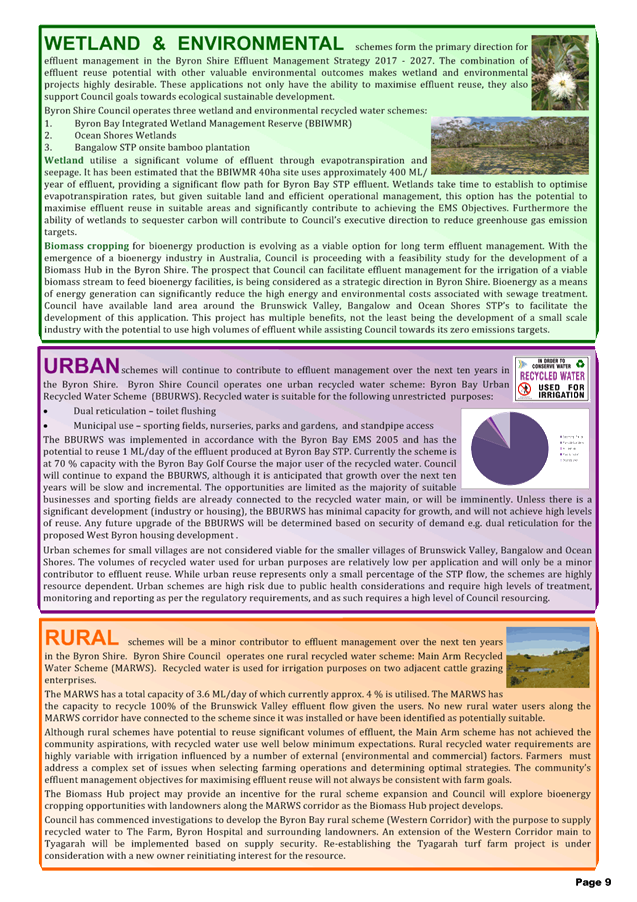
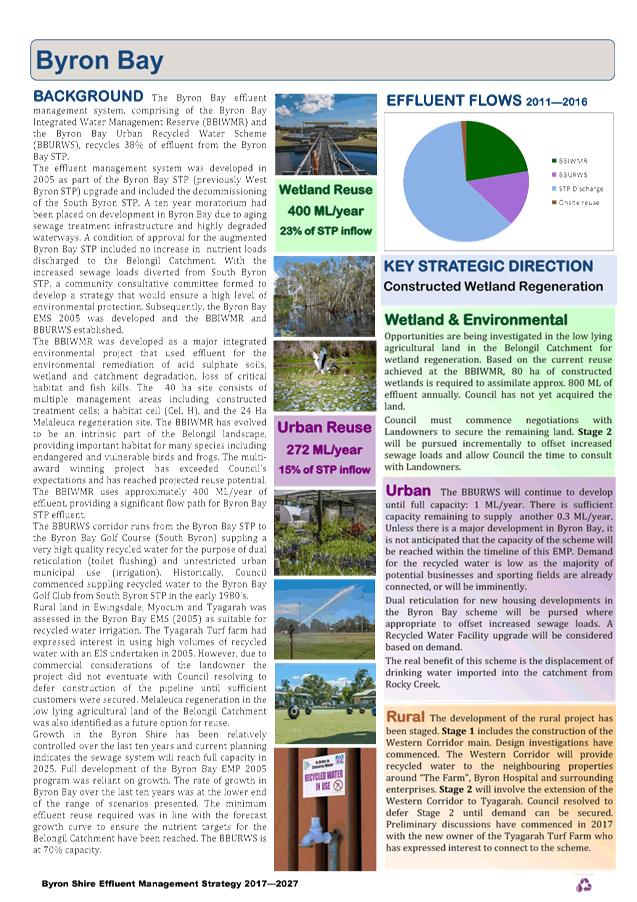
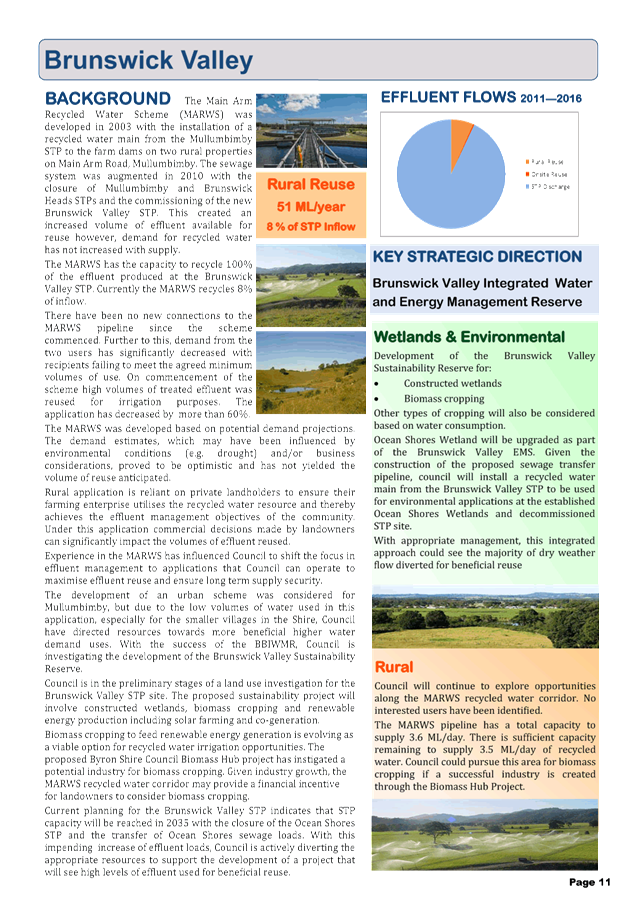
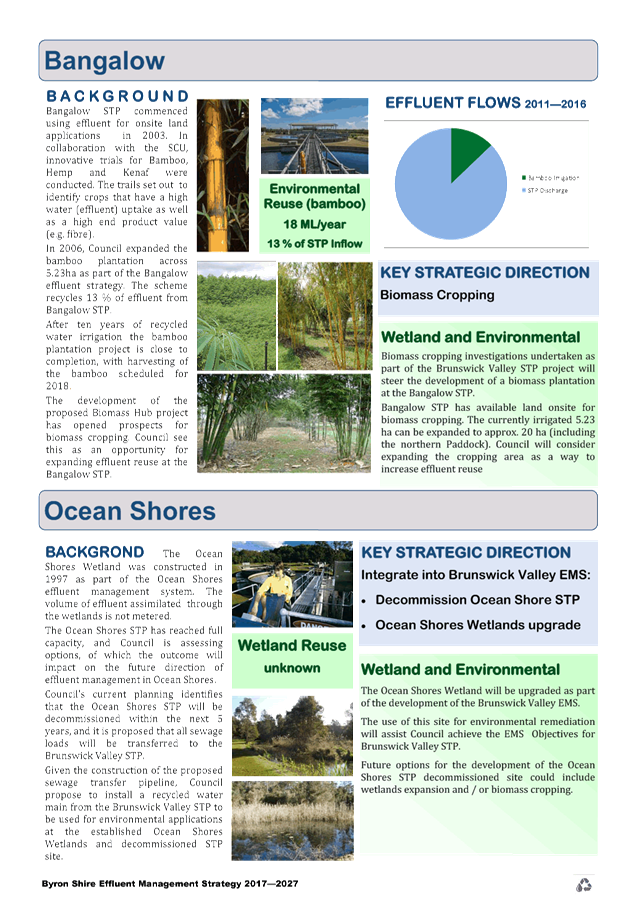
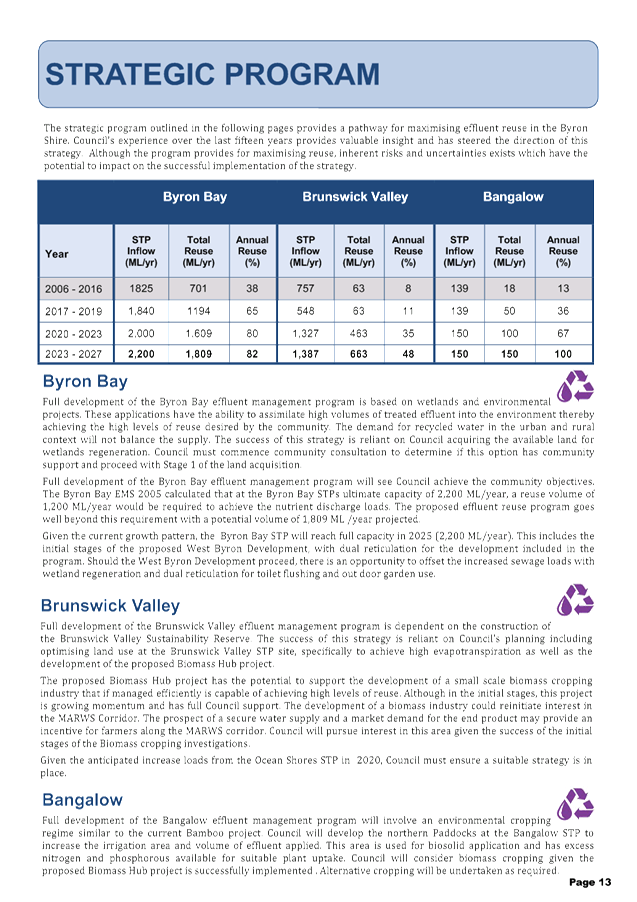
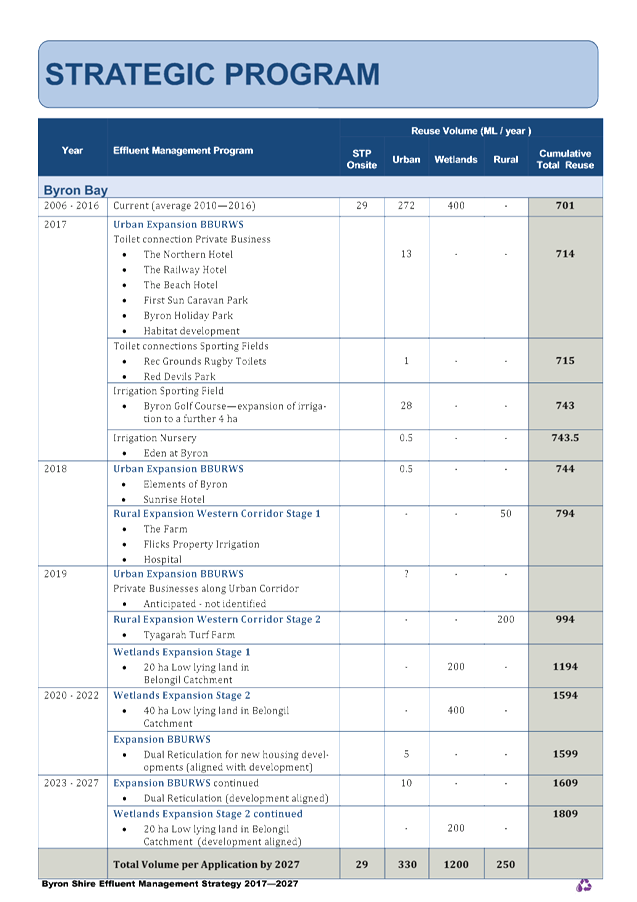
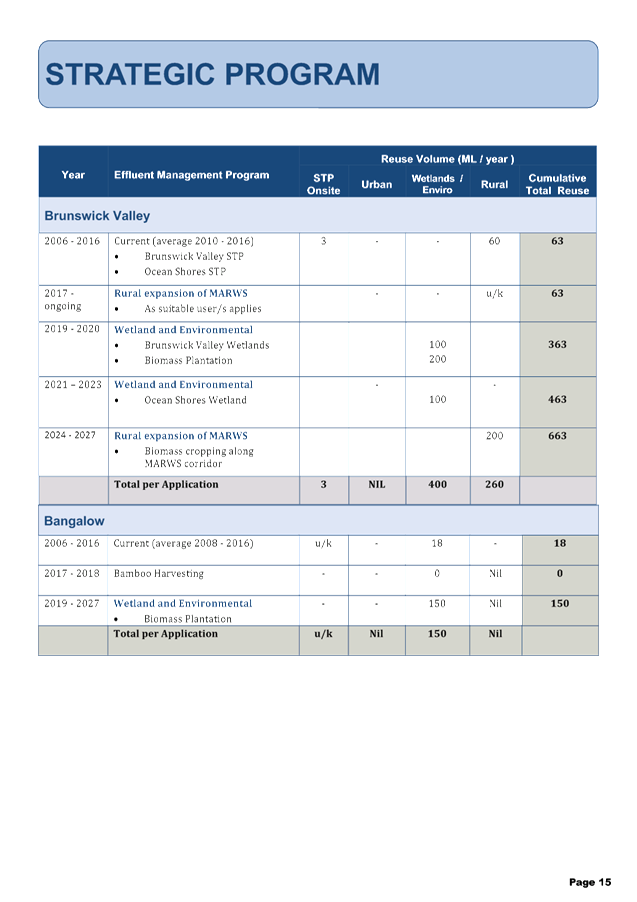
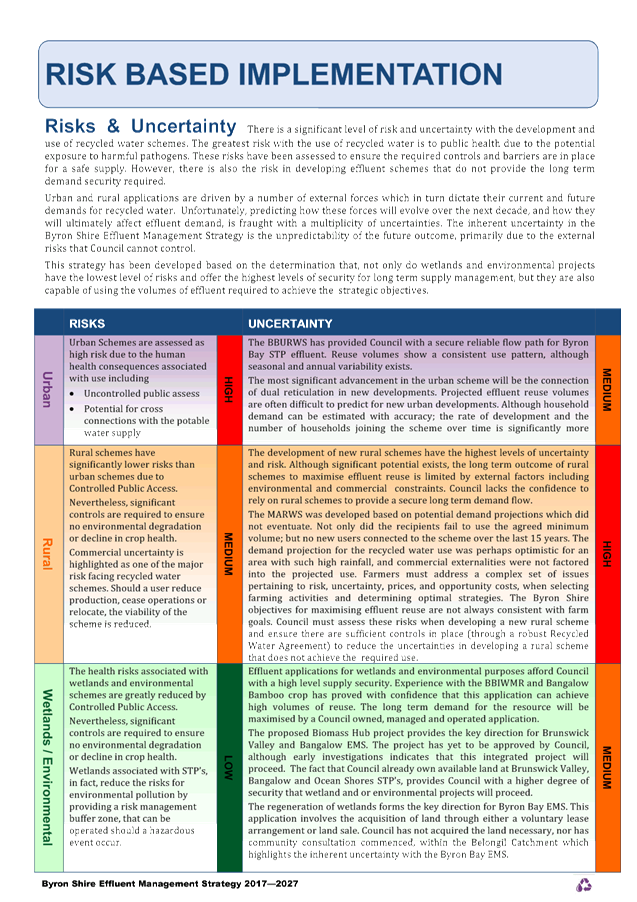
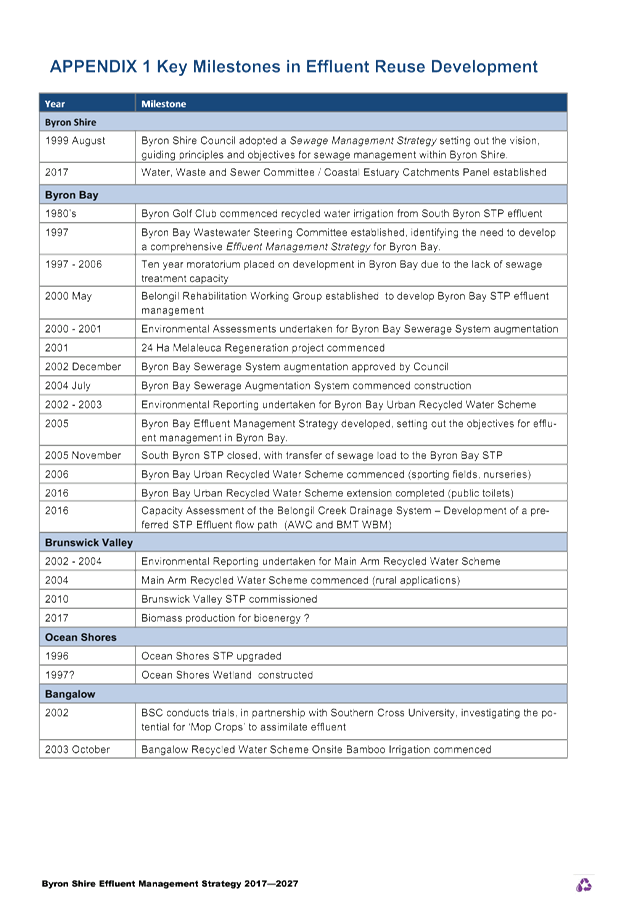
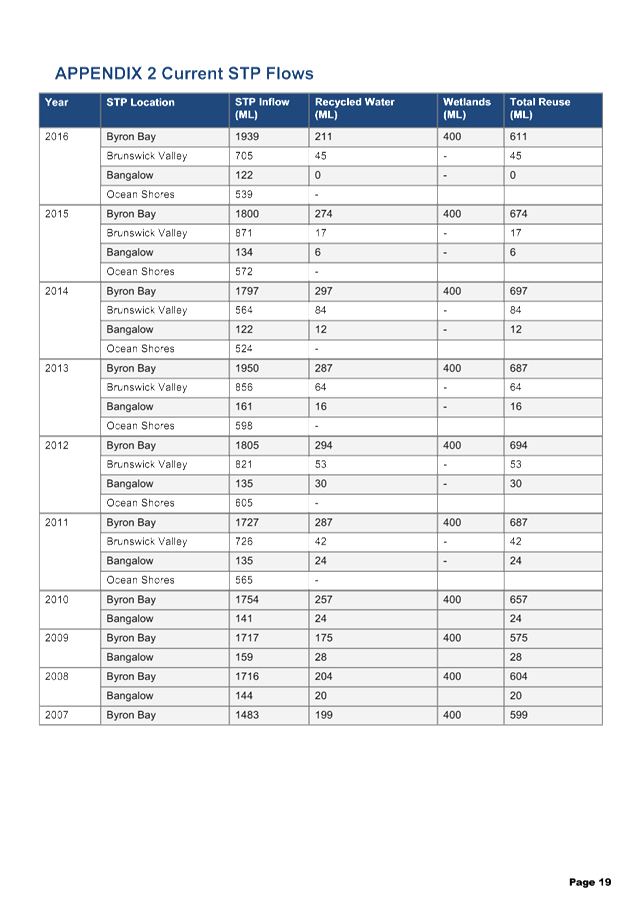
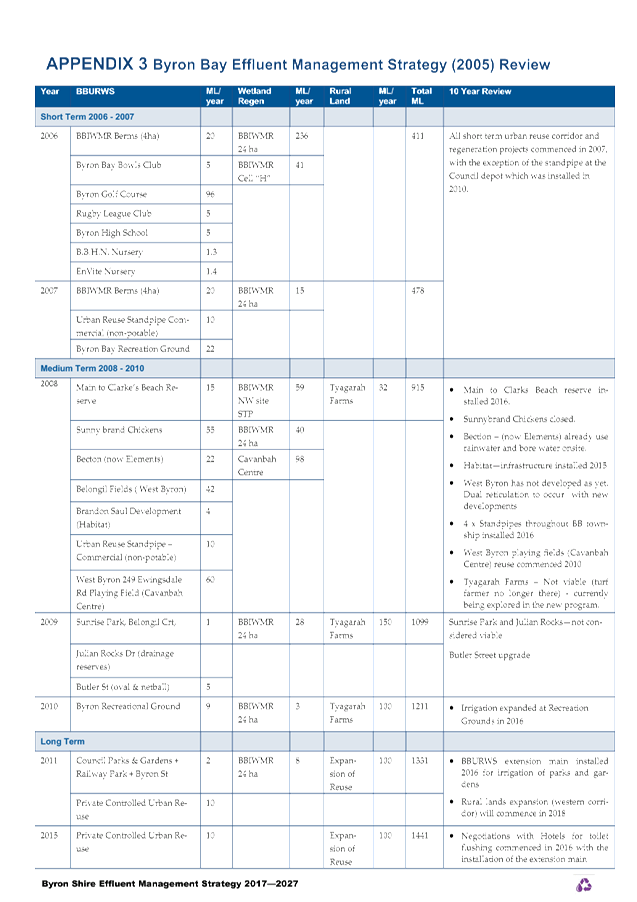
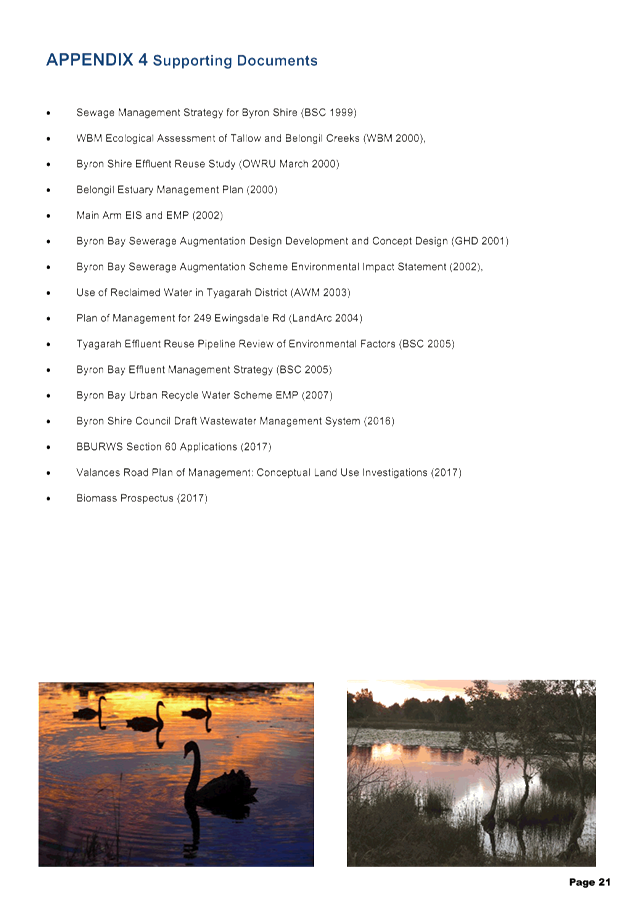
Staff Reports - Infrastructure Services 4.6
Report No. 4.6 Update
on the Container Deposit Legislation
Directorate: Infrastructure
Services
Report
Author: Lloyd
Isaacson, Team Leader Resource Recovery and Quarry
File No: I2017/1254
Theme: Community Infrastructure
Waste and Recycling Services
Summary:
Since the previous report to the June 2017 WWSAC meeting
further detail has been released by the State Government regarding the
implementation of the NSW Container Deposit Scheme.
This report provides an update on limitations with regard to
Council’s control over the number and location of collection sites within
the Shire and opportunity to discuss the preferred option for the allocation of
revenue received from the Materials Recycling Facility for eligible containers
collected within the kerbside recycling stream.
|
RECOMMENDATION:
1. That
the WWSAC note the report on the update of the Container Deposit
Legislation and the legislative limitations for Council to nominate the
number and location of collection points.
2. That
the WWSAC recommend to Council the preferred direction for the
allocation of revenue received from the Materials Recycling Facility for
eligible containers collected within the kerbside recycling stream.
|
Report
Return and Earn, the NSW container deposit scheme, will commence
across NSW on 1 December 2017. The NSW EPA has recently released a series
of factsheets providing high level information for each of the relevant
stakeholders likely to be impacted. These can be viewed online at http://www.epa.nsw.gov.au/resources/waste/container/Container%20deposit%20scheme_fact%20sheets.pdf.
The NSW Minister for the Environment recently announced the
Scheme Coordinator and Network Operator who are responsible for delivery of the
Scheme via a two-part structure:
· The Scheme
Coordinator, Exchange for Change (a joint venture of 5 of Australia’s
beverage companies: Asahi, Carlton & United Breweries, Coca-Cola Amatil,
Coopers Brewery and Lion) will be responsible for financial management,
education and communication and ensuring the Scheme meets its statewide access
and recovery targets; and
· The Network
Operator, TOMRA-Cleanaway will set up and run a statewide network of collection
points; they can build and operate these themselves or contract other
organisations to operate them on their behalf.
TOMRA is a company that
specialises in the manufacture and operation of Reverse Vending Machines (RVMs)
worldwide. Recent rhetoric from TOMRA-Cleanaway indicates their focus
will be on rolling out reverse vending machines and supporting these with
manual drop off centres.
Staff have been in discussion
with TOMRA-Cleanaway and were provided with a copy of a presentation (attached)
that has been delivered to stakeholders in the metropolitan areas of NSW
(Sydney and Newcastle) where TOMRA-Cleanaway have focused attention to date.
Staff have been advised that
during these presentations TOMRA-Cleanaway have stated that they are not
dependent on councils to operate the scheme and do not see the scheme as
a new revenue stream for councils. They believe councils have spare space
and manpower on their sites to undertake manual collection centres and do not
anticipate they would be paying any handling fee associated with running a
collection point.
Key implications for Council include:
1. Engagement
with TOMRA-Cleanaway
Proactively engaging with
TOMRA-Cleanaway in an attempt to facilitate establishment of collection points
throughout the shire to achieve the key scheme objective of reducing litter.
The council resolution resulting
from the June 1 2017 WWSAC recommendation states:
That Council includes in this
LGA’s roll out of the Container Deposit Legislation at least two other
collection points, for example, one at Byron Bay and another at Ocean Shores
(shopping centre).
Unfortunately, Council do not
have any legislative power to implement this resolution. Under the Container
Deposit Legislation, Councils have no control over the implementation of
collection points. Additionally, there is no legislative requirement for
TOMRA-Cleanaway to engage with Council or utilise Council land or facilities
for collection points.
There is however legislation on
accessibility requirements for regional collection points. Staff are seeking
clarification on the exact implications of this legislation with regard to the
number of collection points required in the Byron LGA, however current
interpretation indicates a minimum requirement of 2.
Cognisant of these statutory
limitations and TOMRA-Cleanaway’s’ abovementioned rhetoric, Staff
have been proactive in approaching and communicating with TOMRA-Cleanaway to
indicate Council’s desire (as per resolution) for collection points to be
implemented in Byron Bay, Ocean Shores and at the Byron Resource Recovery
Centre (BRRC). Staff have had constructive dialogue with TOMRA-Cleanaway
and at the time of writing this report have forwarded high level information on
potential precincts for installation of RVMs in Byron Bay and Ocean Shores in
addition to a manual collection point at the BRRC.
2. Impact
on Kerbside Recycling
Council will receive a 10c
payment for each eligible container delivered to the Lismore City Council (LCC)
MRF via its kerbside collection service (domestic, commercial and public
place). This will result in a revenue stream or reduced gate fee costs for
Council.
The EPA have stated they want to
minimise the impact of the scheme on domestic recycling services, and thus will
be promoting to the community that local Council’s will utilise this
share of the refund to reduce waste charges or provide additional waste
management services.
Staff will conduct further work
to quantify estimated revenue stream/reduced gate fee costs, and negotiate
terms with LCC. Council will need to develop a framework for the return of this
money to the community and Staff seek guidance from the WWSAC on the
recommended use of these funds. Some initial ideas for discussion include:-
· Assigning the money
received/saved to litter reduction (or other resource recovery) programs.
· Reducing
the annual Domestic and Commercial Waste Management charge by the equivalent
amount – there may be some challenges with regard to equality of
allocation across the range of services provided associated with varying
collection frequencies and recyclable bin compositions (e.g. commercial vs
domestic).
Financial Implications
Discussed above.
Statutory and Policy
Compliance Implications
Discussed above.
Staff Reports - Infrastructure Services 4.7
Report No. 4.7 Vallances
Road Plan of Management
Directorate: Infrastructure
Services
Report
Author: Peter
Rees, Manager Utilities
File No: I2017/1259
Theme: Community Infrastructure
Sewerage Services
Summary:
At the 23 February 2017 ordinary meeting Council resolved to
prepare a Plan of Management (POM) for the 108 hectare Vallances Road site
encompassing a suite of sustainability initiatives that demonstrate a virtuous
cycle that would be a showcase for the area and our community’s values.
The attached draft document presents the proposed Plan of
Management for the site. It should be noted, as discussed at the February 2017
Strategic Planning Workshop, it is proposed to undertake extensive community
consultation to identify activities to be undertaken on the Affordable Housing
and Community Initiatives project area.
|
RECOMMENDATION:
That the Water Waste and Sewer Advisory
Committee note the Vallances Road Plan of Management.
|
Attachments:
1 Vallances
Road Plan of Management - Rev 1, E2017/86476
, page 101⇩ 
Report
At the 23 February 2017 meeting, Council resolution 17-054
resolved:
1. That
Council note the report.
2. That
the proposed POM be prepared in conjunction with the Waste Water and Sewerage
Committee.
3. That
the terms of reference for the POM include the following:
a) Estimated
costing for the initiatives and their budgetary feasibility in light of related
projects in water and sewerage.
b) Possible
timeframes for their implementation.
c) Financial
viability of the potentially positive fiscal options.
d) Environmental
advantages and costs.
e) The
implications of not including the replacement of the Mullumbimby sewer system.
f) The
marginal utility of improving the quality of current treatment (without wetland
polishing) and utilising it in an effective reuse system.
g) considers
options for agricultural enterprises that utilises effluent reuse on the
property.
4. The
POM should clearly examine and advise on all and each of the initiatives in the
staff report in a holistic manner as they are part of a much bigger system with
increasing demands.
5. That
the Vallances Road Agistment contract review include eligibility criteria which
seeks to ensure that appointed contractors are of good character and have acted
lawfully and appropriately in previous contract activities
The attached document is the draft Plan of Management (POM)
for the Valances Rd site. The POM has essentially added more detail to
the original proposal presented to Council in February this year. The
draft document also complies with the State Government requirements for
development of a Plan of Management for Community Land.
The POM has divided the area into 7 key activity areas as
follows
1. Brunswick
Valley STP Project areas – this includes the process plant and proposed
wetlands and effluent storage areas
2. Solar
Farms – this is actually 2 areas with one for the BVSTP solar farm and
the other for a community solar farm
3. Biomass
project areas – for growing of biomass crops utilising biosolids and
recycled water and using the crops for power generation
4. Environmental
land use project areas – this will be a combination of revegetation
areas; rehabilitation of mangroves and billabongs; river bank stabilisation
works
5. Affordable
Housing and Community Initiatives project area – it is recommended this
area be put out for public consultation to determine the best use alternatives.
Some immediate land use options that are available are eco tourism;
educational/interpretative centres; and community gardens. It has not as yet
been determined if the existing structures on the site including the 2 existing
dwellings are a benefit or a hindrance at this stage.
6. Community
access – possibly somewhat controversially, the POM has identified the
main access thoroughfare to the site as being via the existing rail line and
bridge that connects to an inactive road reserve into the western boundary.
This would require significant will on the part of Council to bring to
fruition. Parking would be at Lot 4 at the end of Station Street with access
along the rail / road corridor by foot / bicycle / electric cars.
7. Throughout
the site would be a network of walkways and information portals explaining the
“virtuous cycle” of waste conversion to energy; solar power; carbon
sequestration; environmental habitat; mangroves and riparian protection.
The site has real potential to be both a showcase for the
area and our community’s values.
A catalyst to bringing the project alive is the proposed
closing of the Ocean Shores STP and transferring the effluent to the Brunswick
Valley site. The will initiate a $10 million plus spend that, given the
healthy financial position of the Sewer Fund, can be expanded to include many
of the ancillary projects identified in the draft POM.
In relation to Item 3(e) it should also be noted the issue
of reducing stormwater entering the gravity sewer system in Mullumbimby is a
separate project and has no impact on this proposed Plan of Management.
In relation to Item 3(f) there is considered to be no
marginal utility in removing wetlands and in lieu upgrading the BVSTP recycled
water system to include dual reticulation standard. These effluent streams can
happen in parallel as occurs at the Byron Bay STP.
Financial Implications
The implementation of the draft Plan of Management for
valances Rd could occur under the umbrella of the OSSTP transfer project with
little material impact on the sewer reserve funds. Depending on the final configuration
of the Affordable Housing and Community Initiatives project area; and the power
generation projects, the site could in effect generate income that would be
beneficial to the sewer reserve funds.
Statutory and Policy Compliance Implications
The draft Vallances Rd Plan of Management document has
attempted to embody Council’s strategic objectives embodied in
· Biodiversity
Conservation Strategy
· Sustainable
Agriculture Strategy
· Low Carbon
Strategy 2014
· Climate Change
Strategic Planning Policy
· Community Gardens
Policy
· Corporate
Sustainability Policy
Staff Reports - Infrastructure Services 4.7 - Attachment 1

Staff Reports - Infrastructure Services 4.7 - Attachment 1

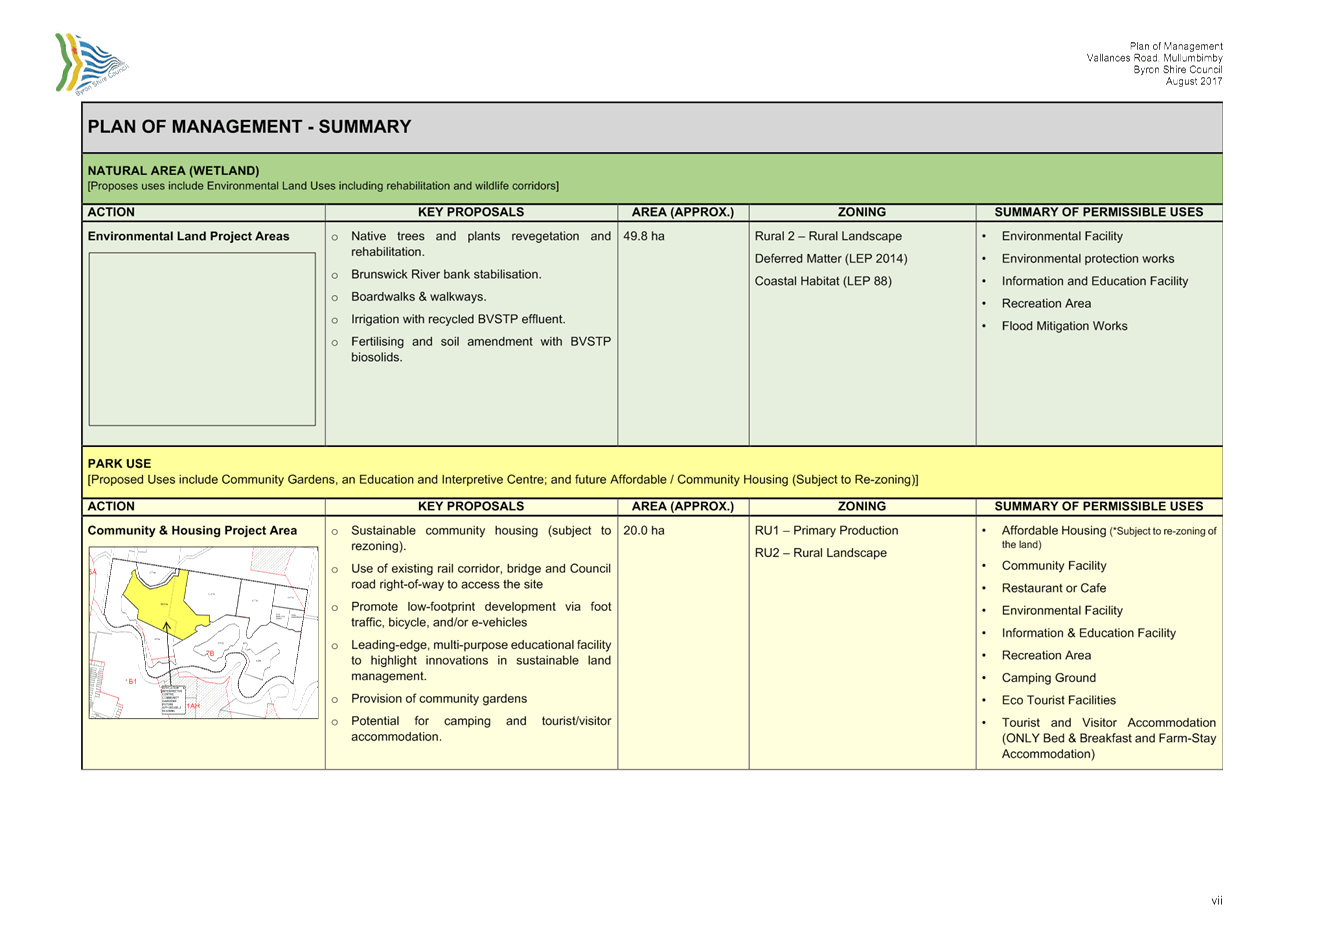
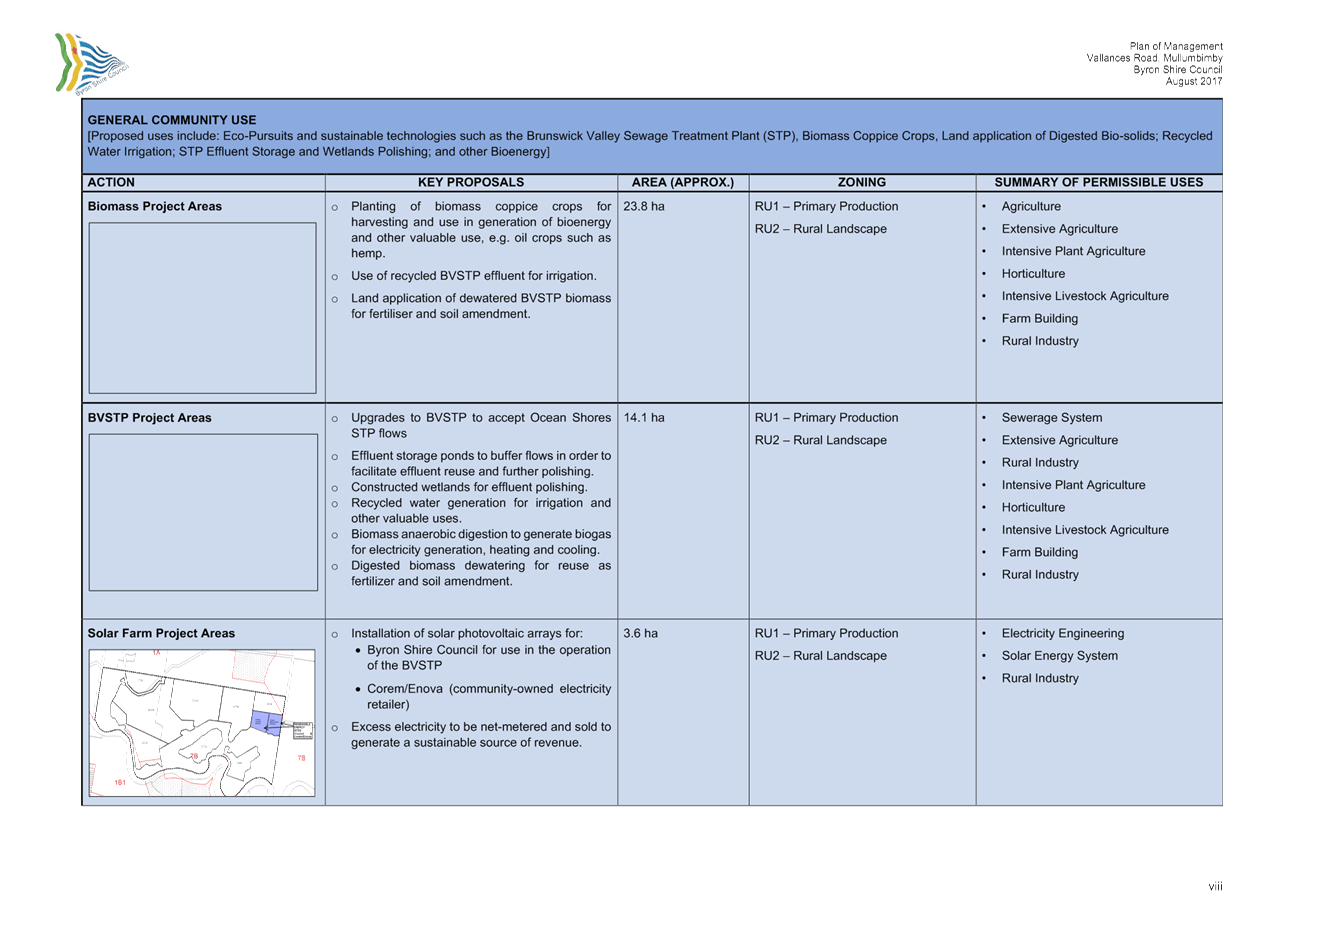
Staff Reports - Infrastructure Services 4.7 - Attachment 1


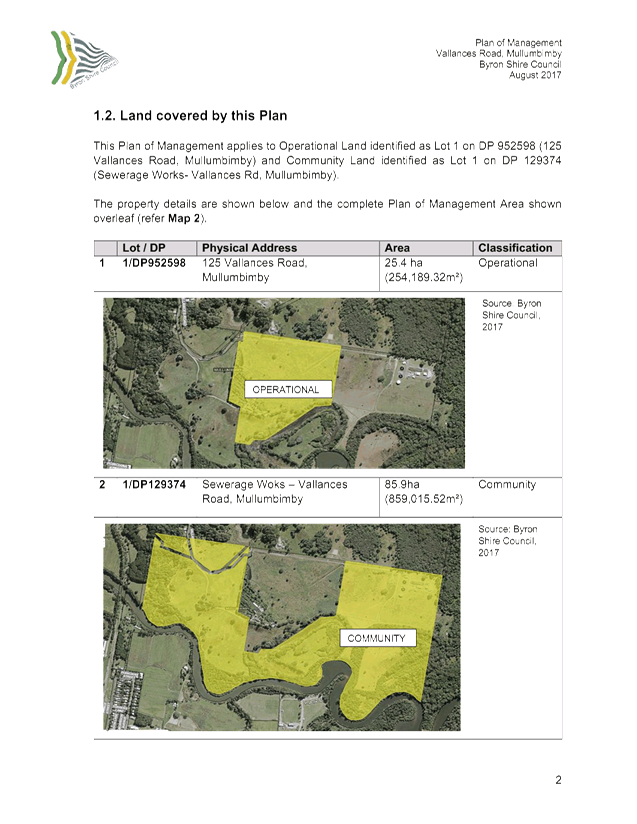
Staff Reports - Infrastructure Services 4.7 - Attachment 1
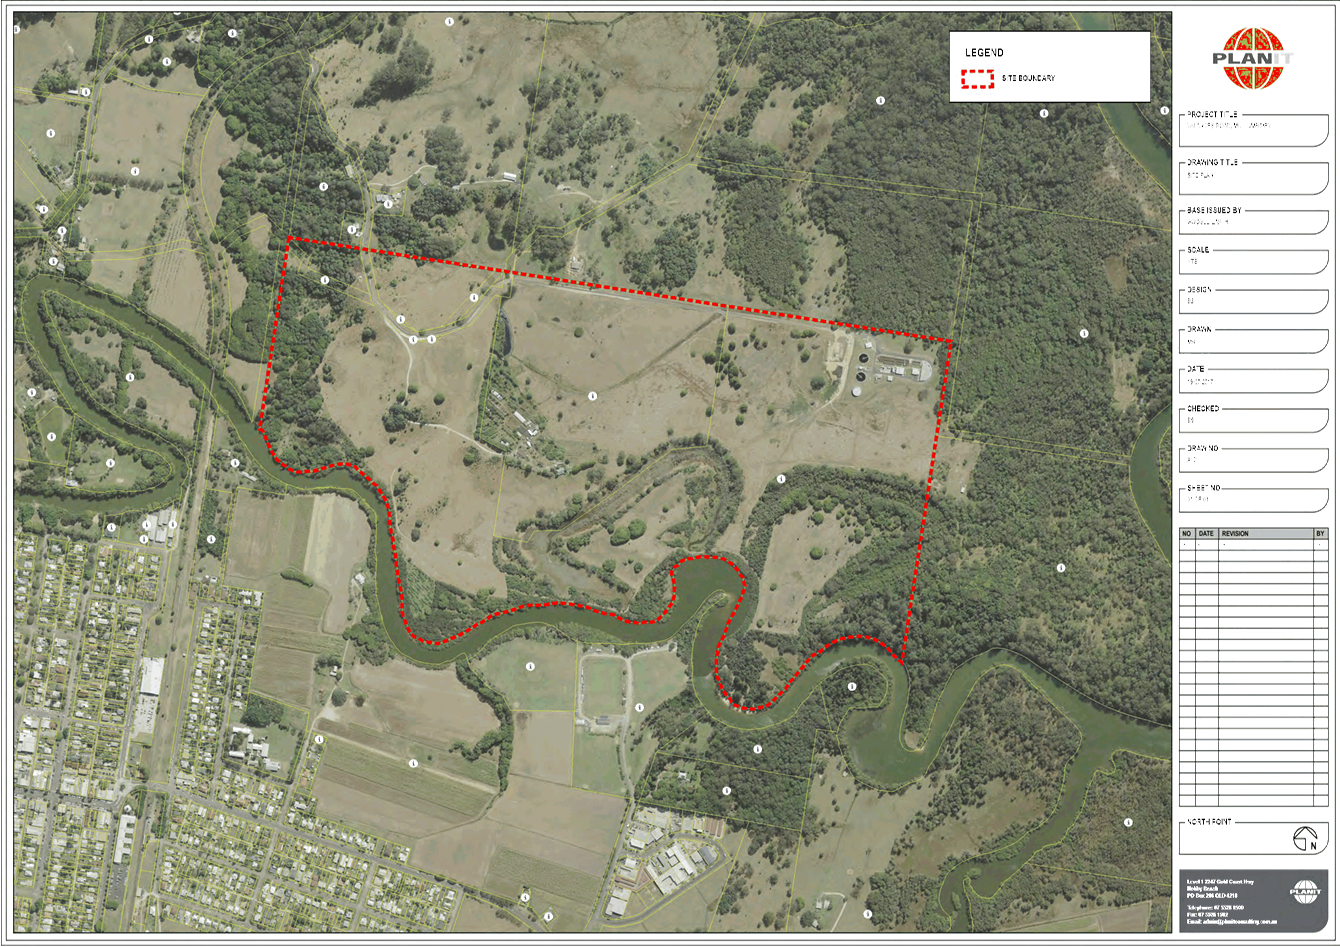
Staff Reports - Infrastructure Services 4.7 - Attachment 1
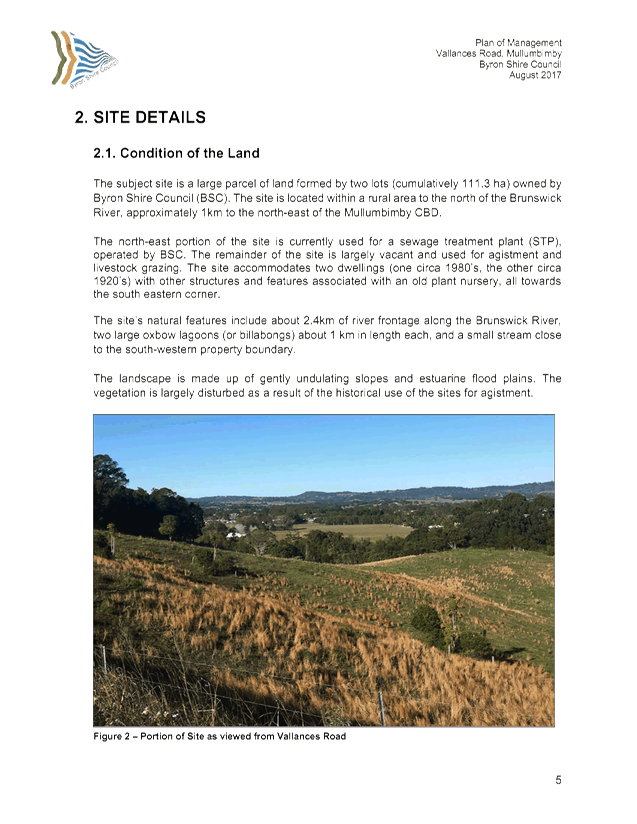
Staff Reports - Infrastructure Services 4.7 - Attachment 1
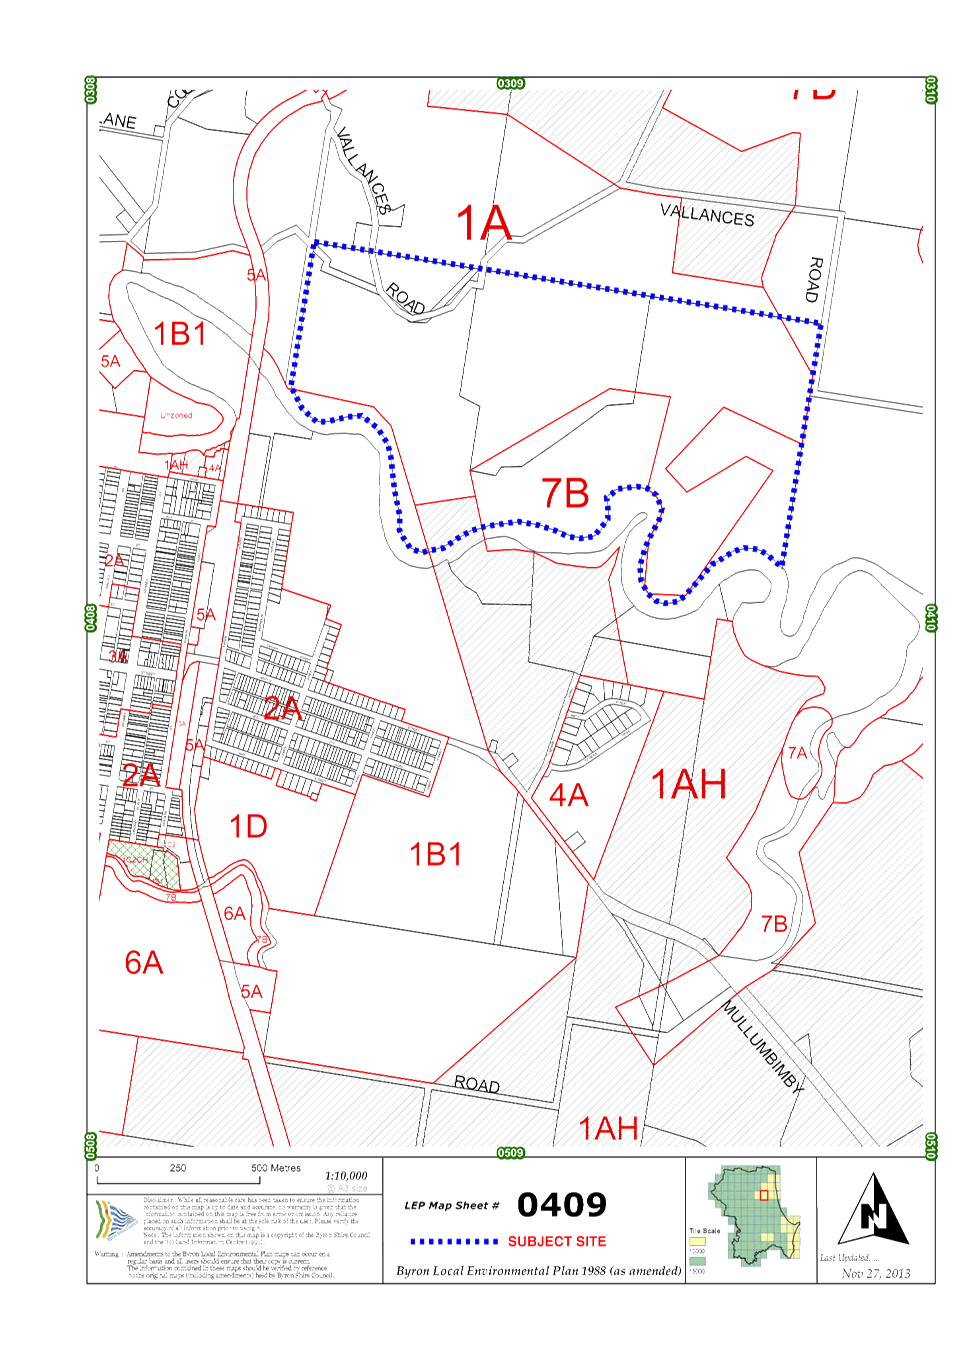
Staff Reports - Infrastructure Services 4.7 - Attachment 1
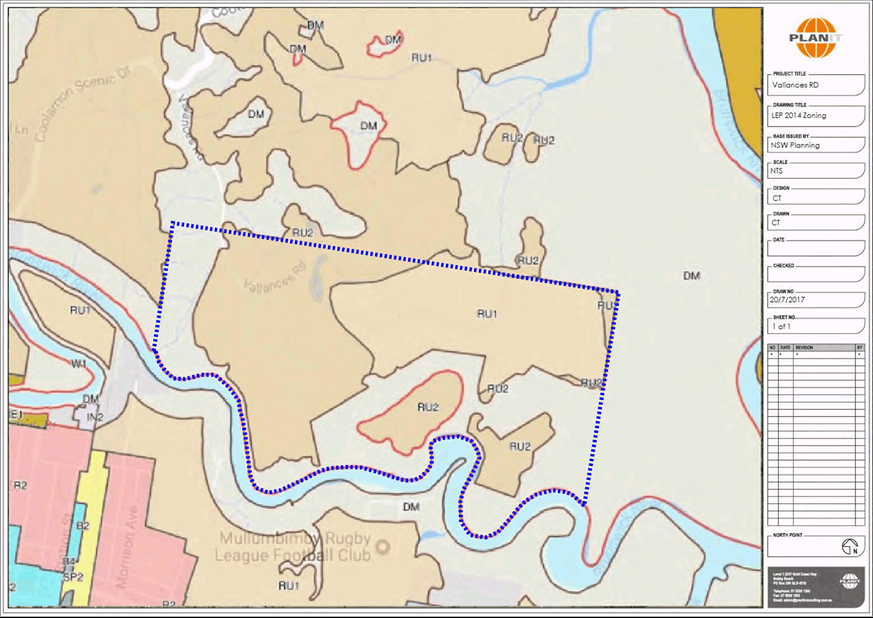
Staff Reports - Infrastructure Services 4.7 - Attachment 1
Staff Reports - Infrastructure Services 4.7 - Attachment 1
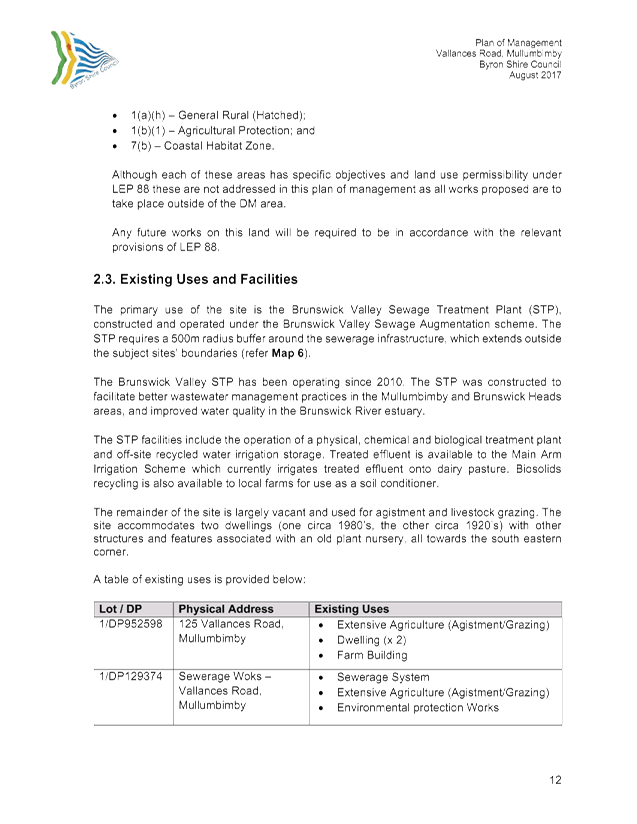
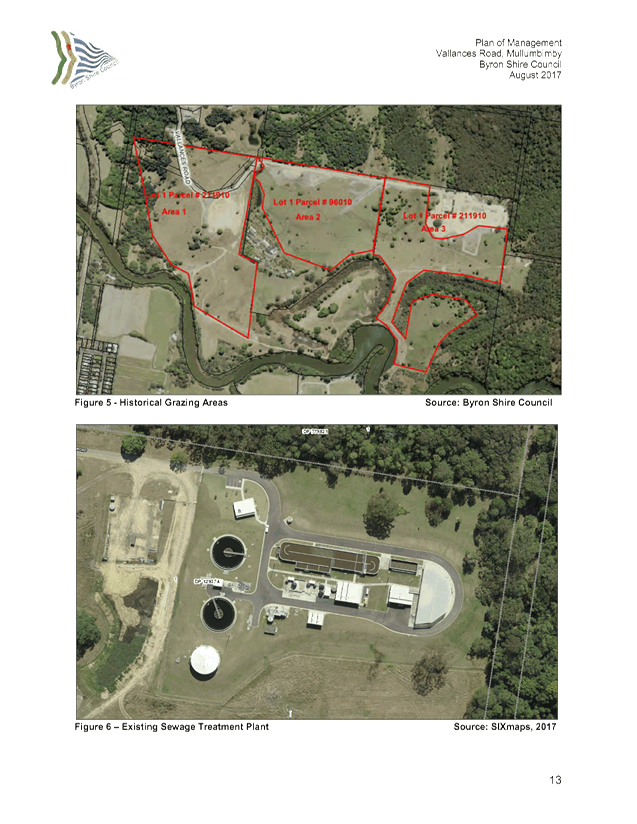
Staff Reports - Infrastructure Services 4.7 - Attachment 1
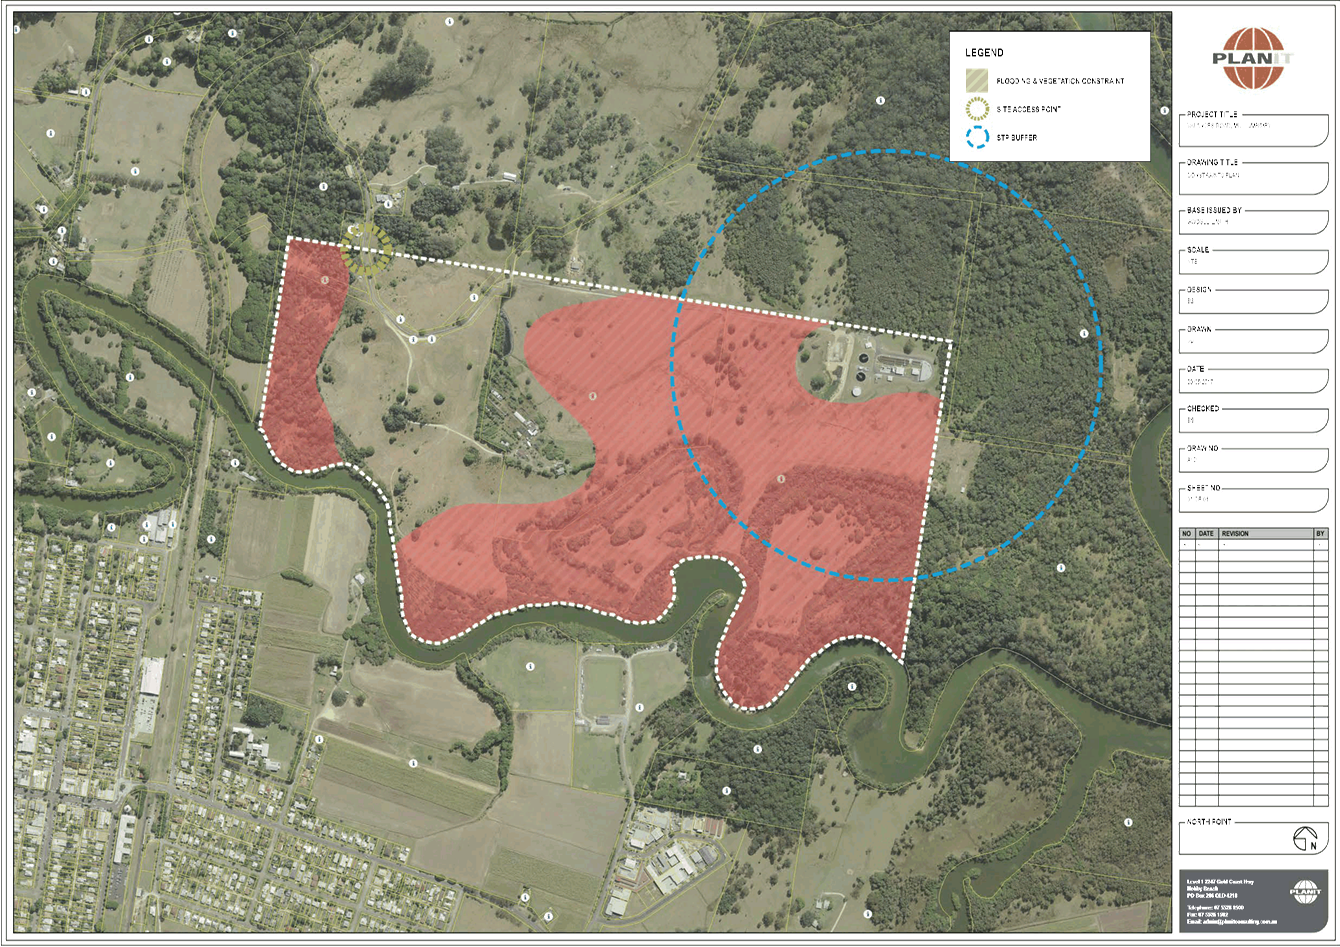
Staff Reports - Infrastructure Services 4.7 - Attachment 1
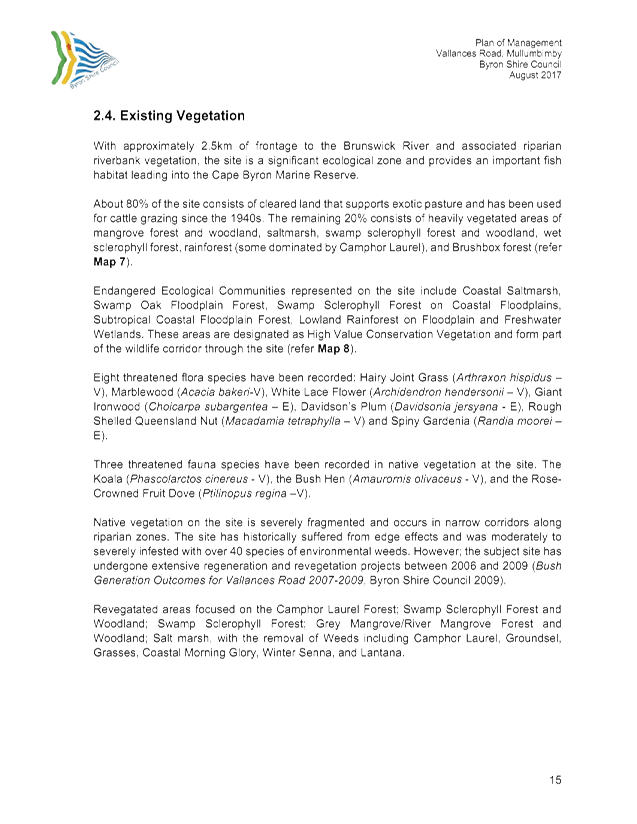
Staff Reports - Infrastructure Services 4.7 - Attachment 1
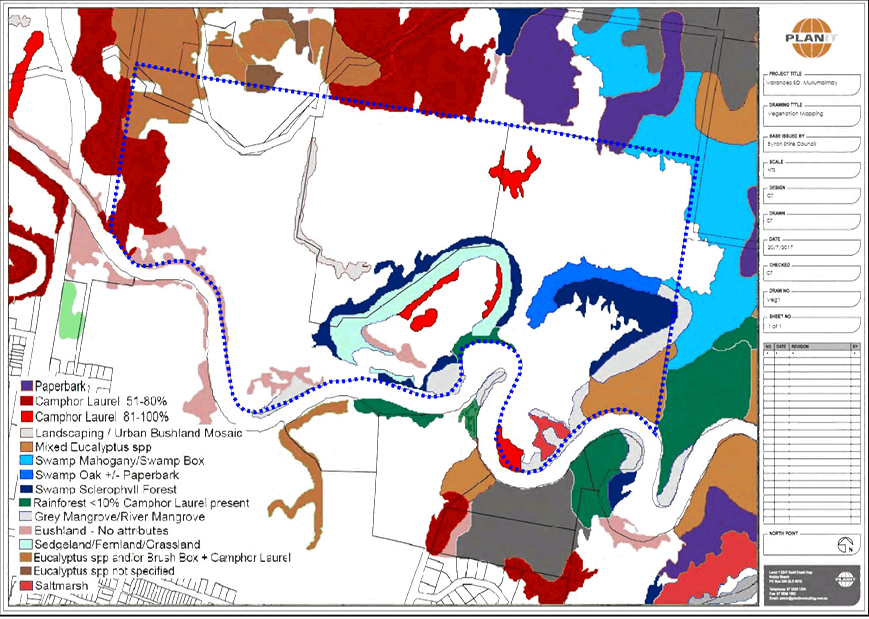
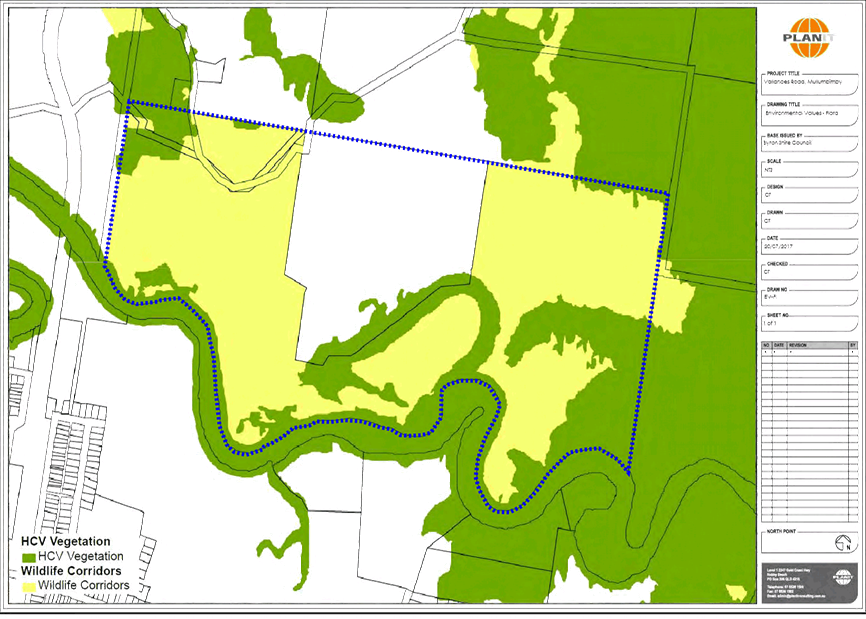
Staff Reports - Infrastructure Services 4.7 - Attachment 1
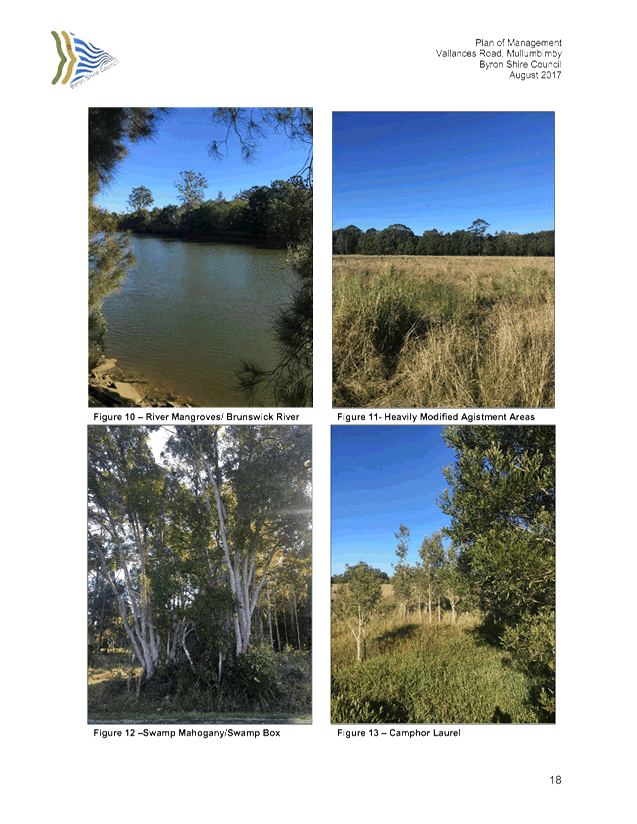

Staff Reports - Infrastructure Services 4.7 - Attachment 1
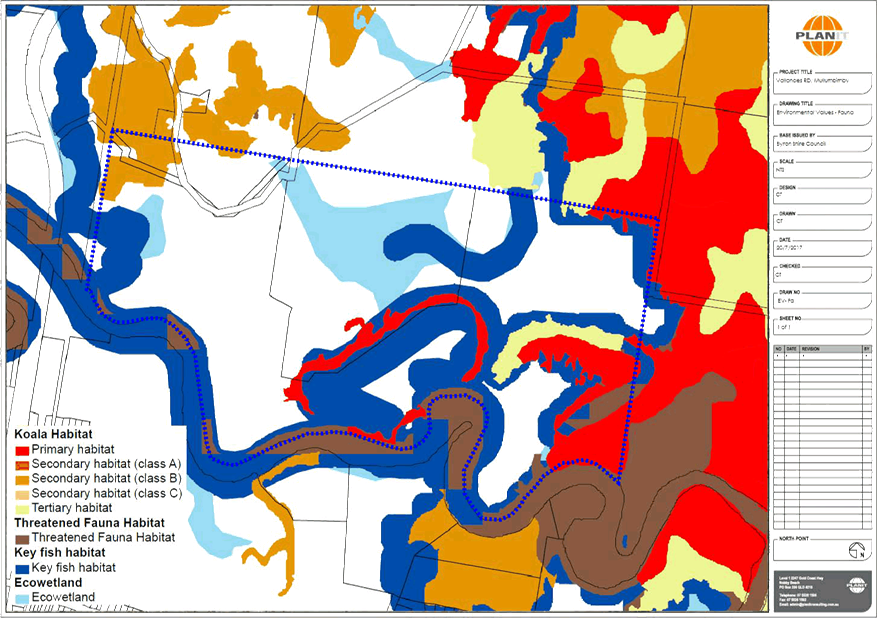
Staff Reports - Infrastructure Services 4.7 - Attachment 1
Staff Reports - Infrastructure Services 4.7 - Attachment 1
Staff Reports - Infrastructure Services 4.7 - Attachment 1
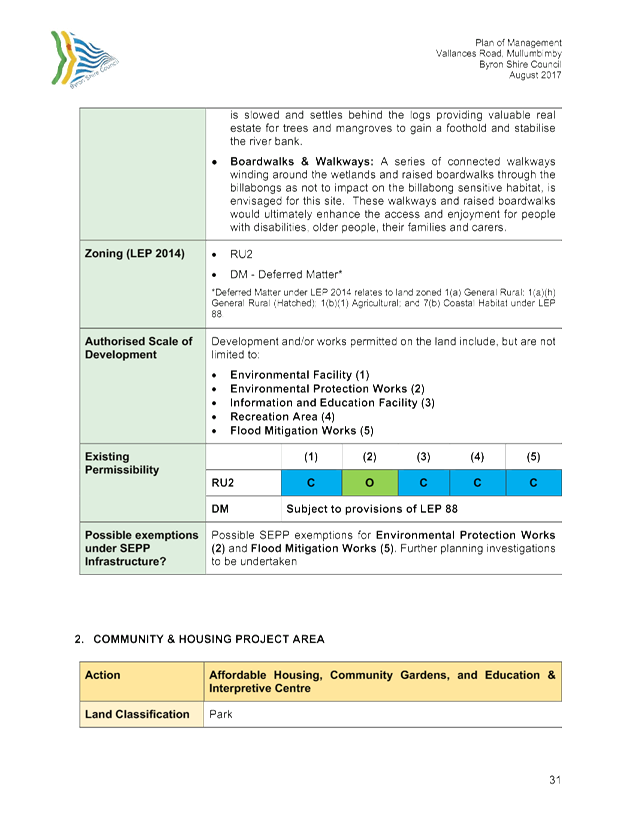
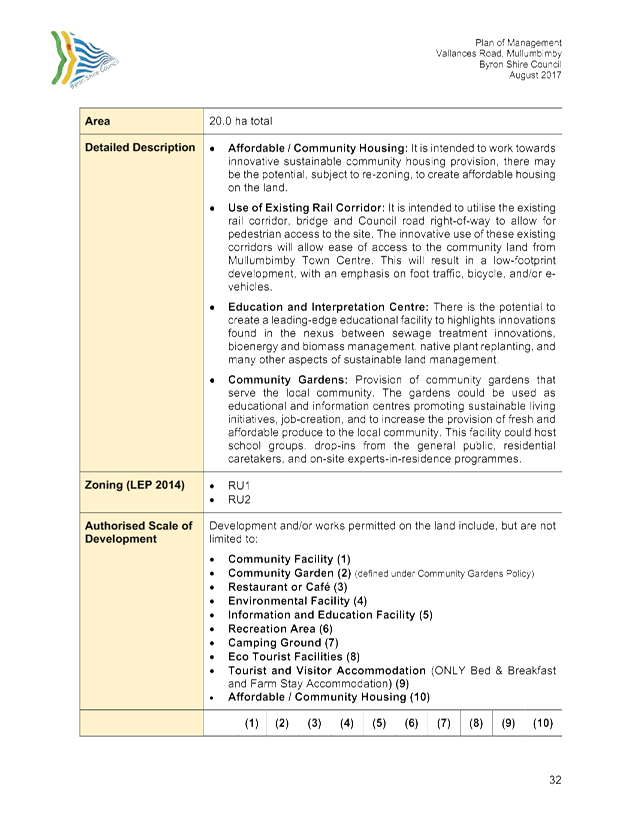
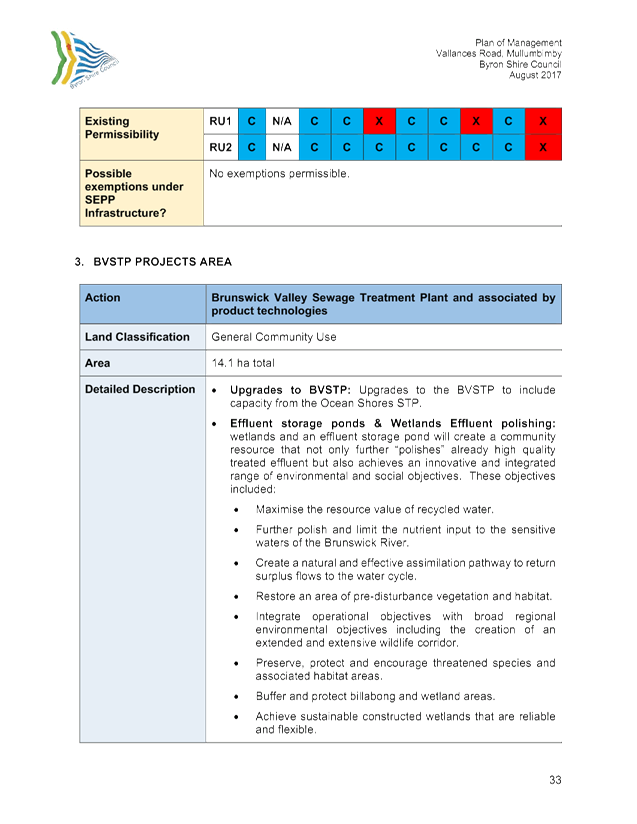
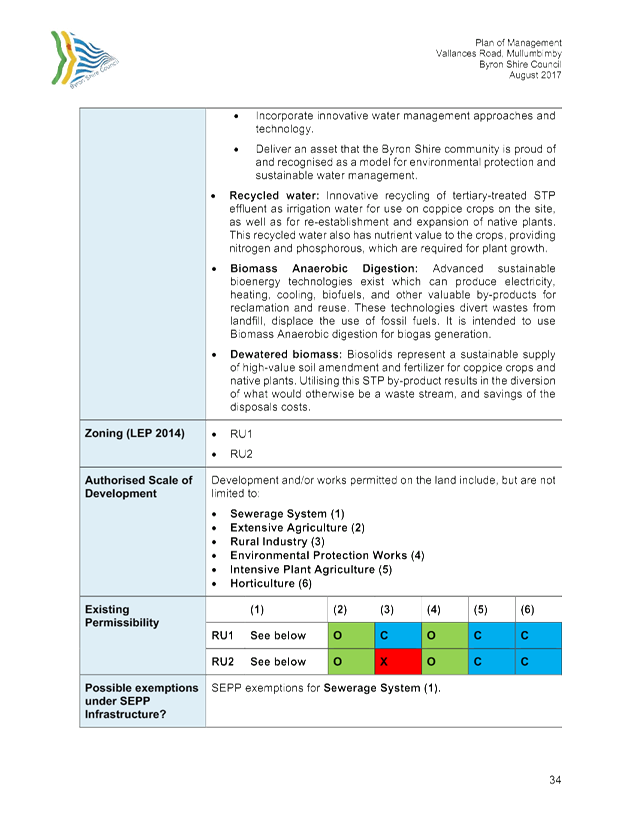
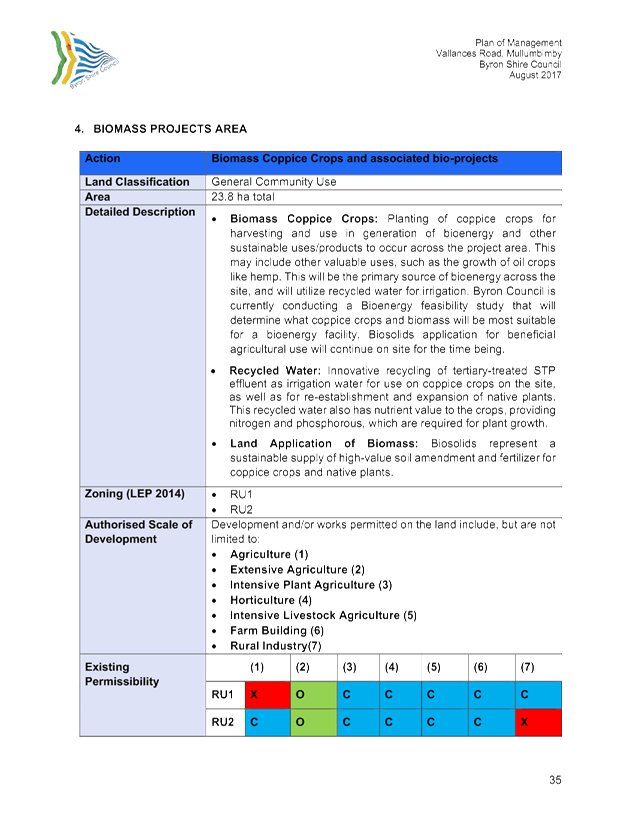
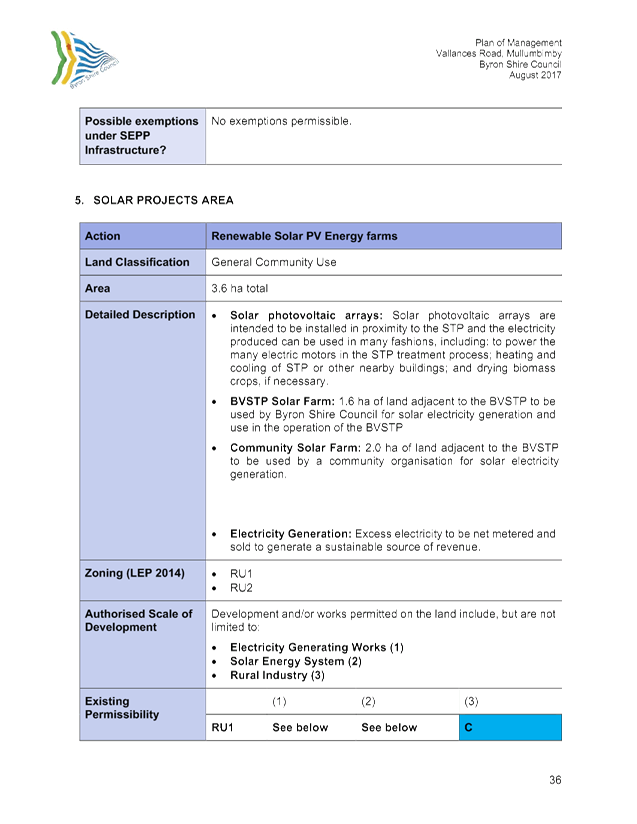

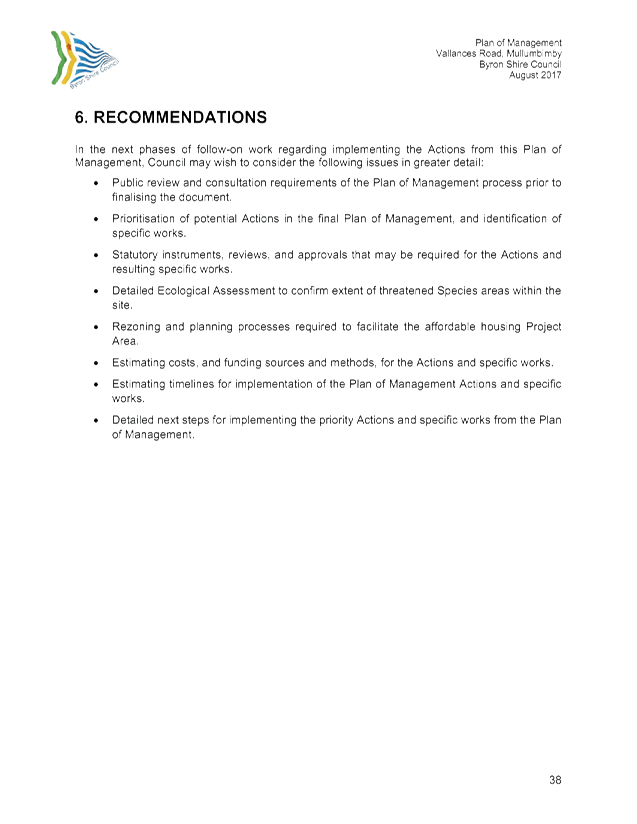
Staff Reports - Infrastructure Services 4.7 - Attachment 1
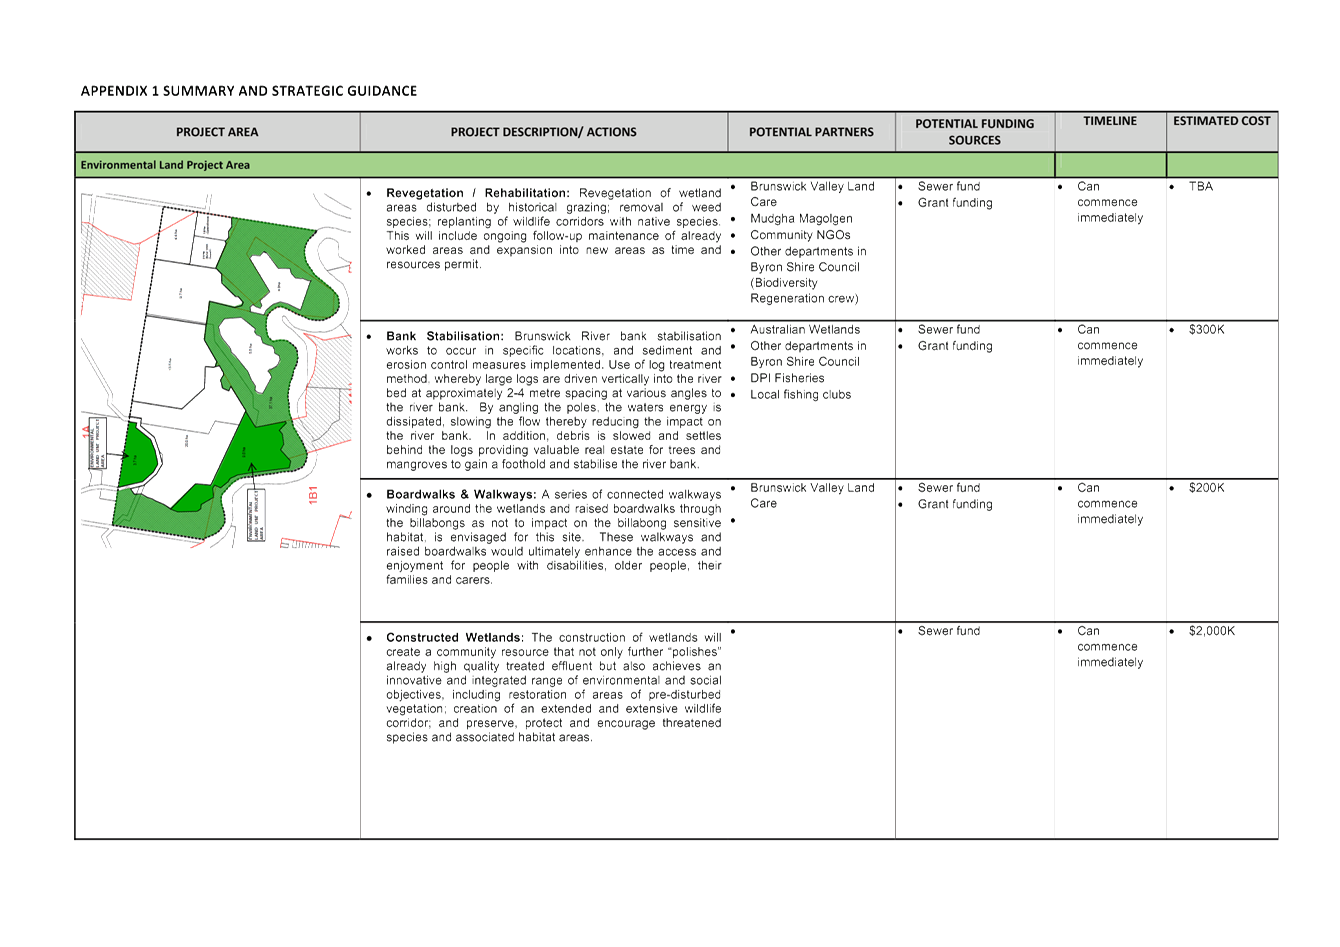
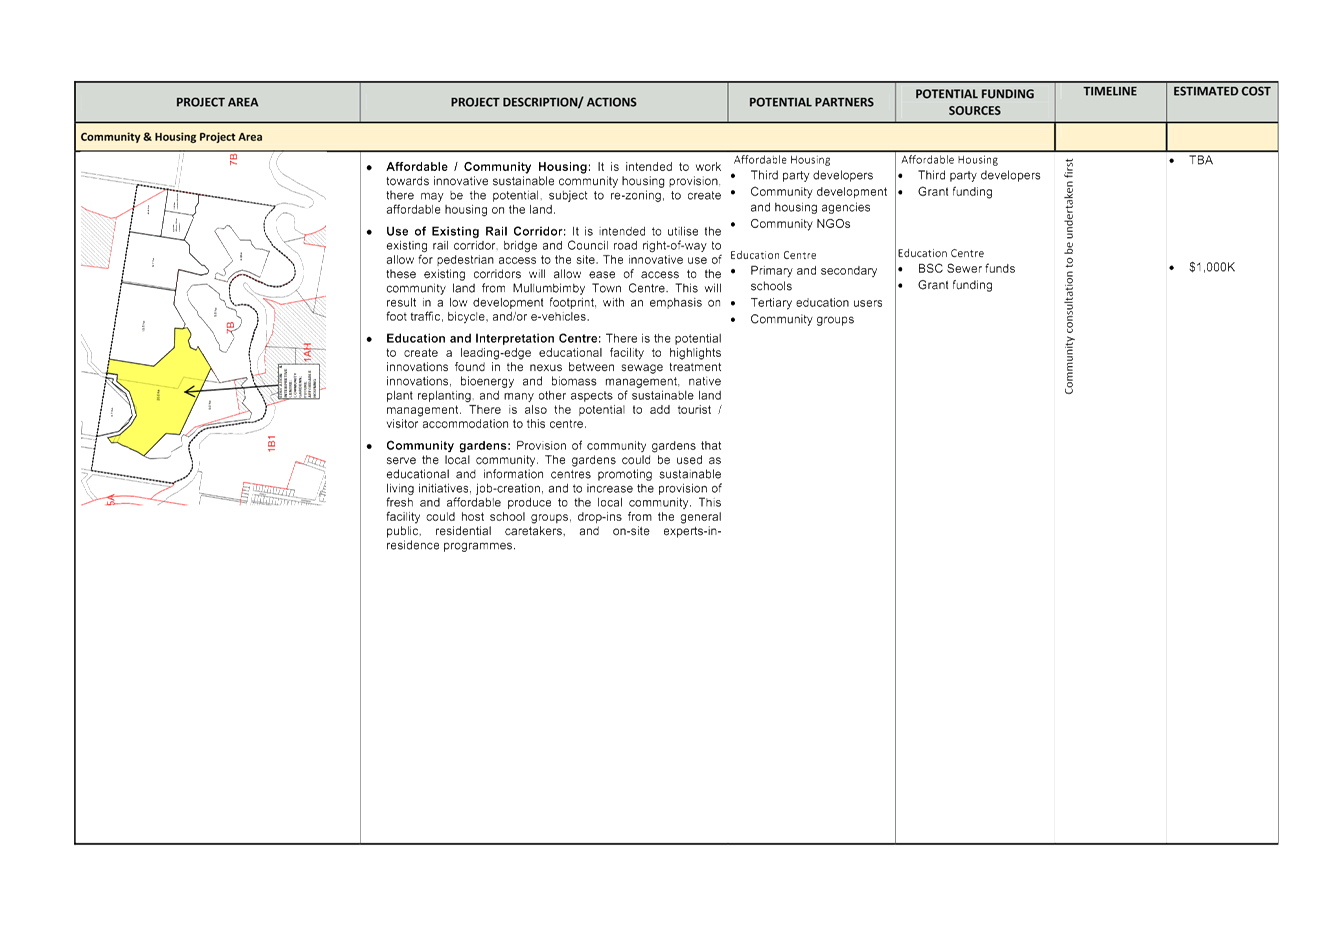
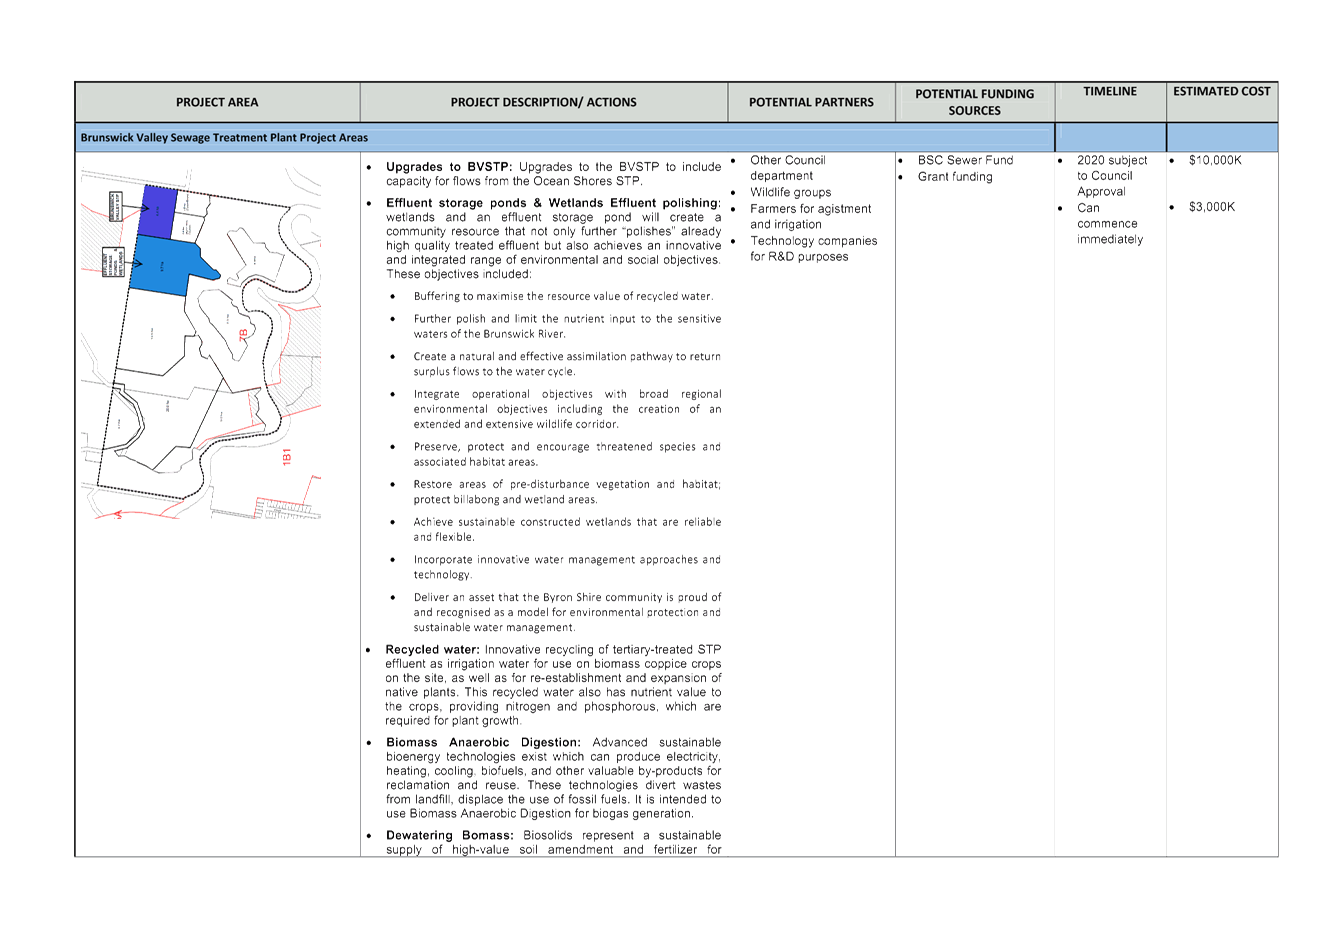
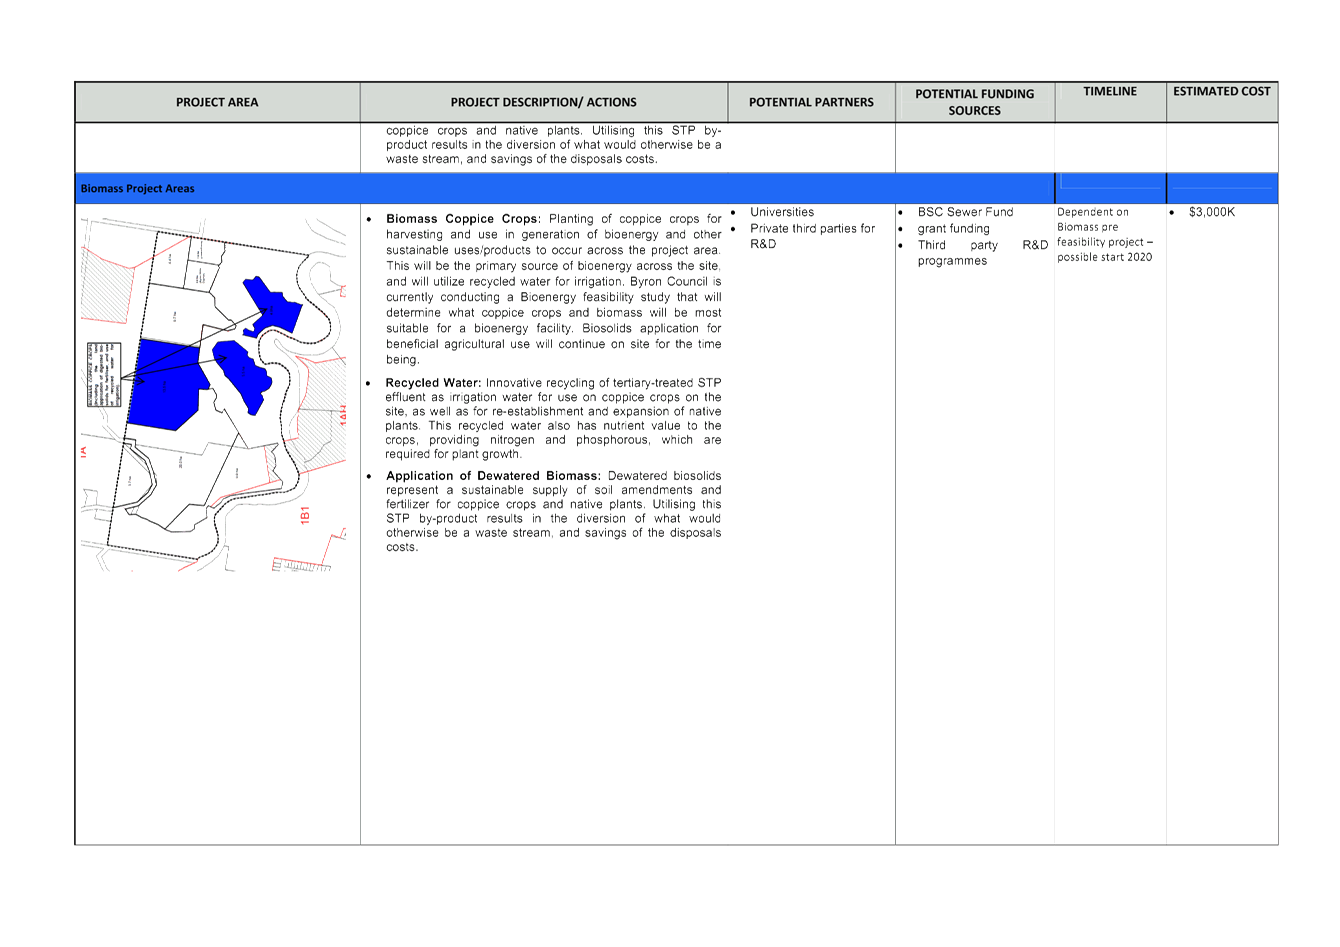
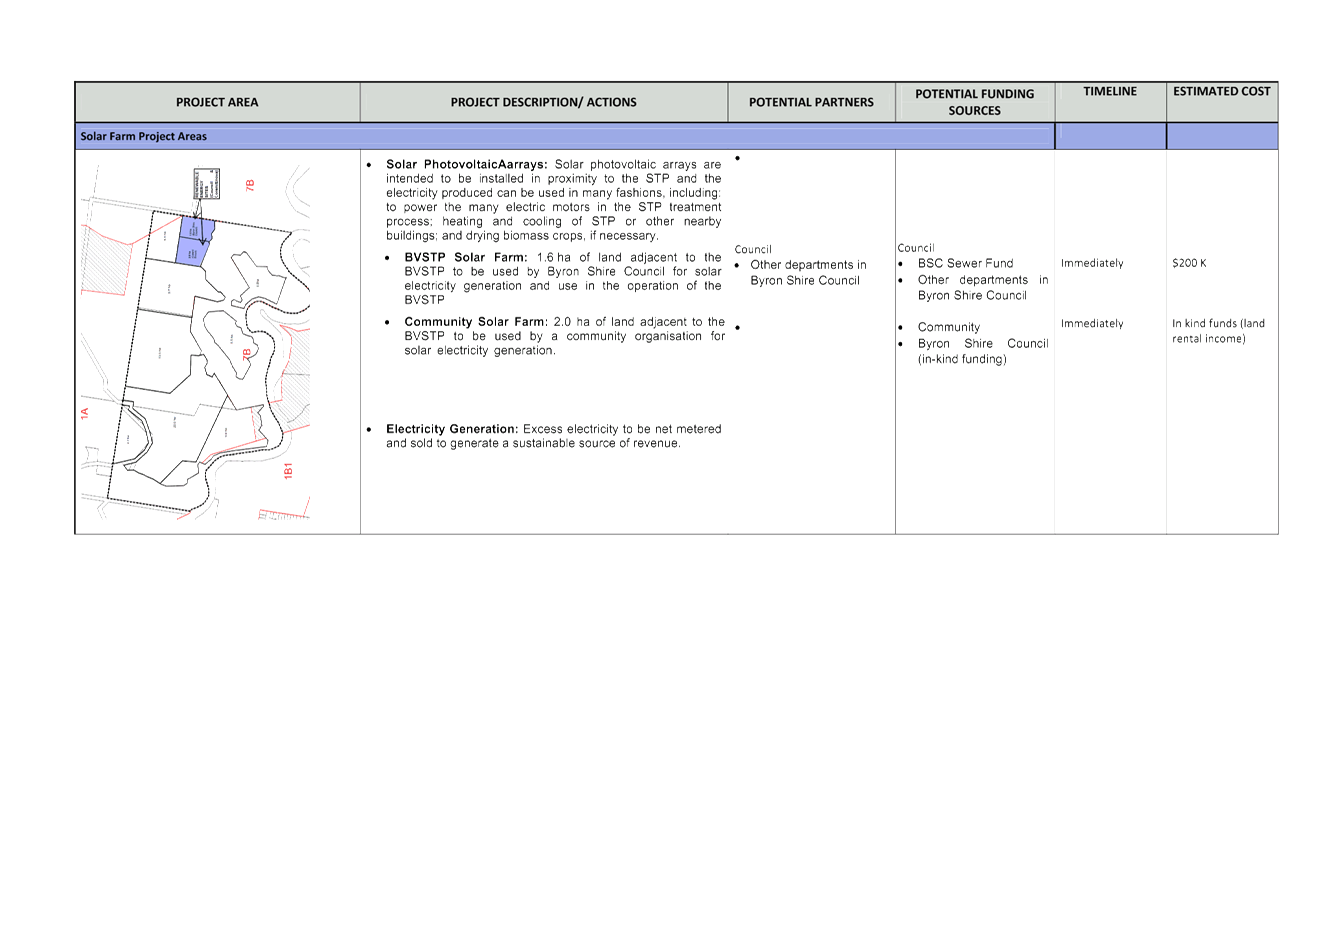
Staff Reports - Infrastructure Services 4.8
Report No. 4.8 Update
on the review of Council's Integrated Waste Management and Resource Recovery
Strategy
Directorate: Infrastructure
Services
Report
Author: Lloyd
Isaacson, Team Leader Resource Recovery and Quarry
File No: I2017/1262
Theme: Community Infrastructure
Waste and Recycling Services
Summary:
The attached presentation
provides an update on the status of the review of Council’s Integrated Waste Management and
Resource Recovery Strategy.
|
RECOMMENDATION:
That the report on the update of the review of
Council’s Integrated Waste Management and Resource Recovery Strategy be
noted.
|
Attachments:
1 Presentation
to September 2017 WWSAC - Update on the review of Council’s Integrated
Waste Management & Resource Recovery Strategy, E2017/88593 , page 101⇩
Report
The attached presentation
provides an update on the status of the review of Council’s Integrated Waste Management and
Resource Recovery Strategy
Financial Implications
Nil
Statutory and Policy Compliance Implications
Nil
Staff Reports - Infrastructure Services 4.8 - Attachment 1
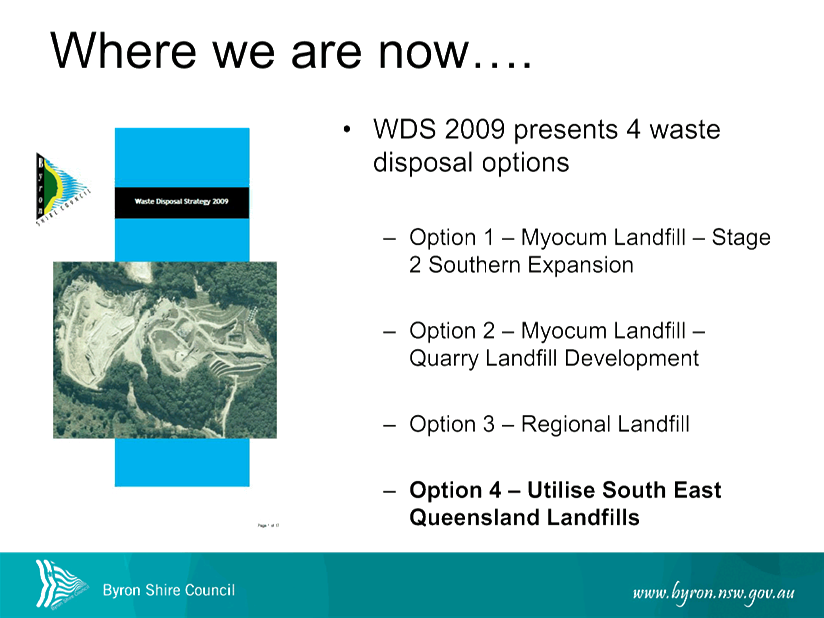
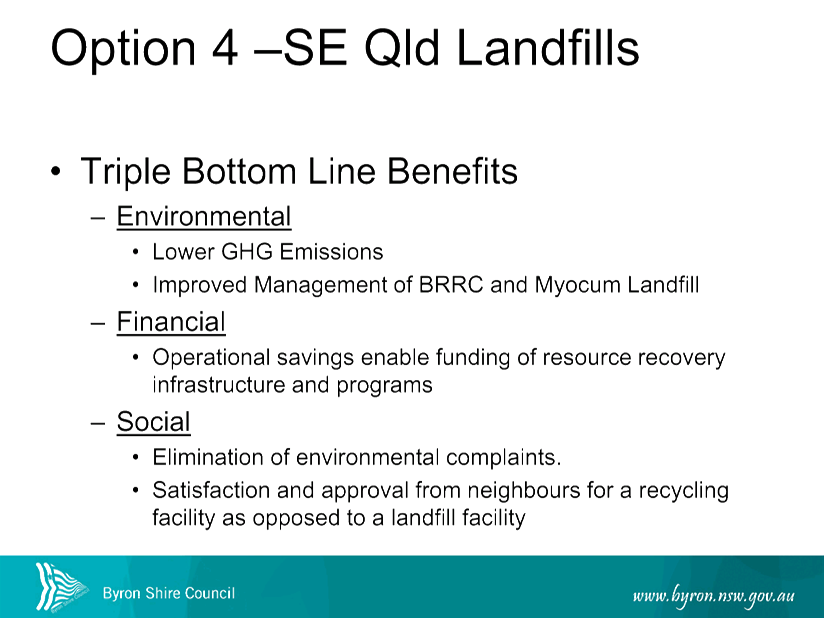
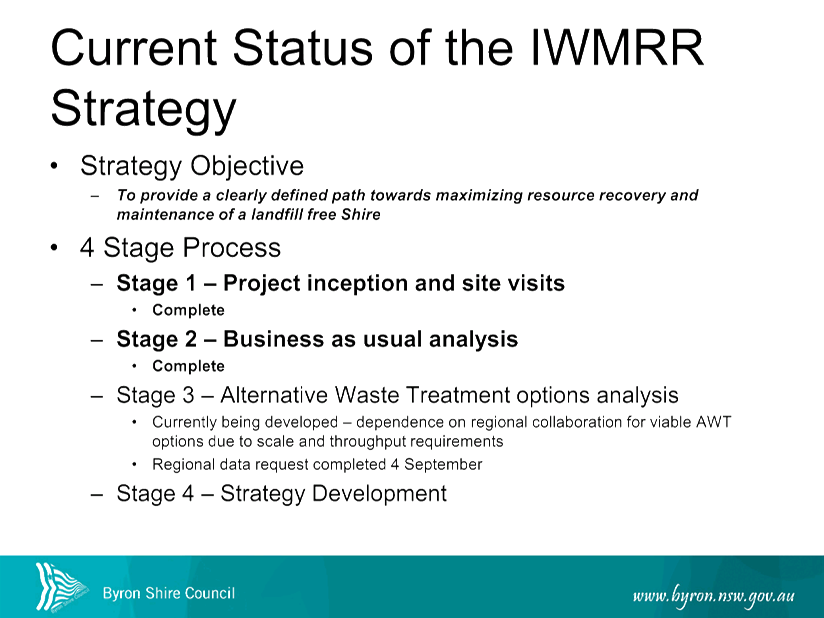
Staff Reports - Infrastructure Services 4.9
Report No. 4.9 Response
to Alan Dickens Questions
Directorate: Infrastructure
Services
Report
Author: Peter
Rees, Manager Utilities
File No: I2017/1268
Theme: Community Infrastructure
Sewerage Services
Summary:
Mr Alan Dickens as a member of the Water Sewer and Waste
Advisory Committee asked for questions to be tabled at the next committee
meeting.
|
RECOMMENDATION:
That the Committee note the report.
|
Attachments:
1 Ocean
Shores STS EPA Licence 784 Non compliance events 1999 to 2017, E2017/86814 , page 101⇩
Report
On July 27 2017, Mr Alan Dickens as a member of the Water
Sewer and Waste Advisory Committee asked for questions to be tabled at the next
committee meeting. Please find below the questions and responses for each.
How many EPA license breeches including dates and types
of breeches plus location have occurred at Ocean Shores Treatment Plant?
Please refer to the attached file for the requested
information.
The upgrading of Ocean Shores sewer pump stations 5004
and 5009, how will this effect the hydraulic load on Ocean
Shores STP?
The upgrades have no effect on the hydraulic loading of the
Ocean Shores STP – 5009 is being retrofitted with a pump to take care of
lower flows, 5004 renewal is for the civil structures [existing pumps being
utilised].
Why when asked by a member of Brunswick Progress
Association in 2016 did the utility manager supply that the Design size for
Ocean Shores STP was 1.9 ML/day when he had a report from GH&D presented in
2005 stating Ocean Shores could only treat 1.1 ML/day?
The Manager Utilities did not have access to the 2005 report
at the time of preparing the response.
The Manager Utilities role was created in 2014/15 and was an
amalgamation of Strategic Planning and Operations of Water and Sewerage under
the one role.
Financial Implications
Nil
Statutory and Policy Compliance Implications
Nil
Staff Reports - Infrastructure Services 4.9 - Attachment 1
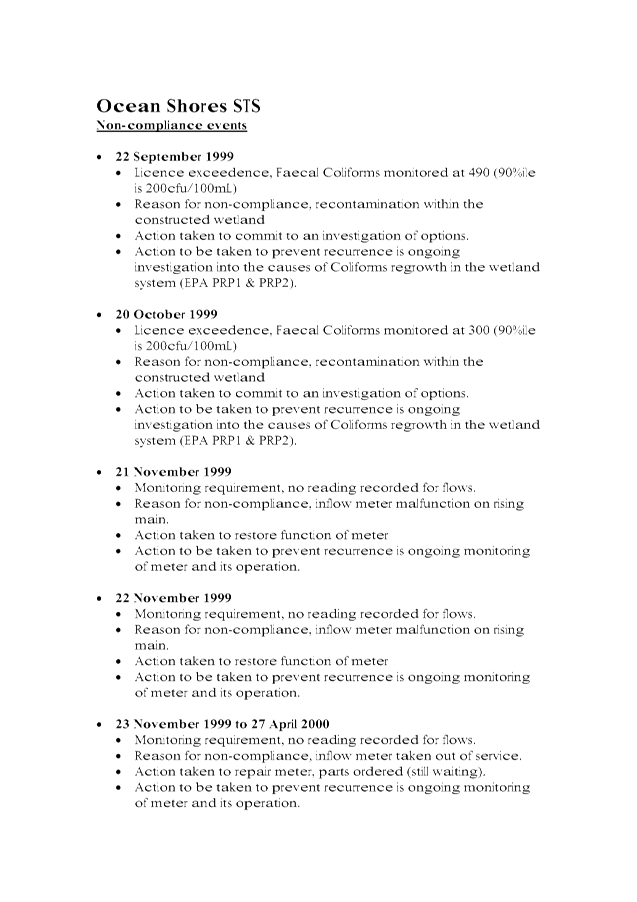
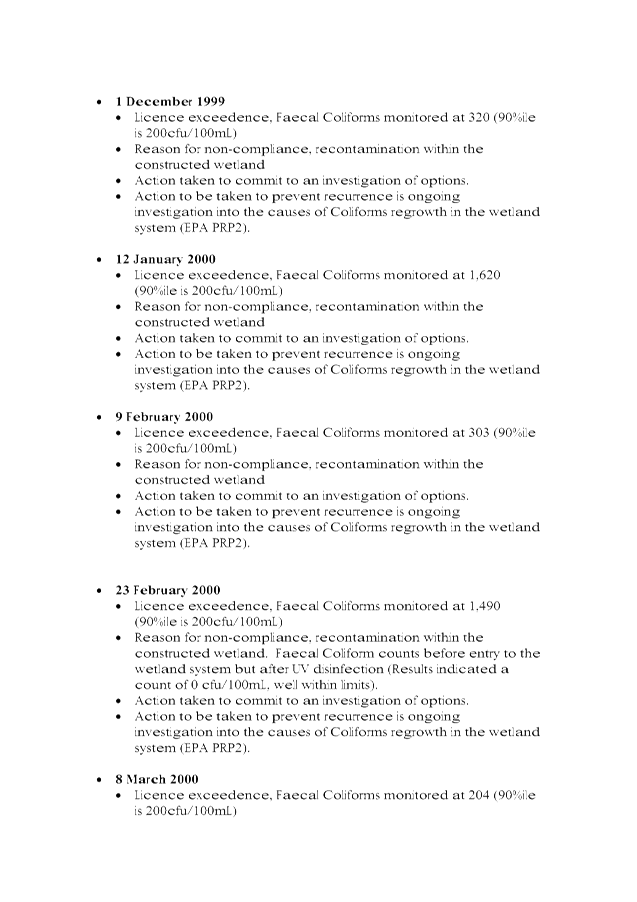
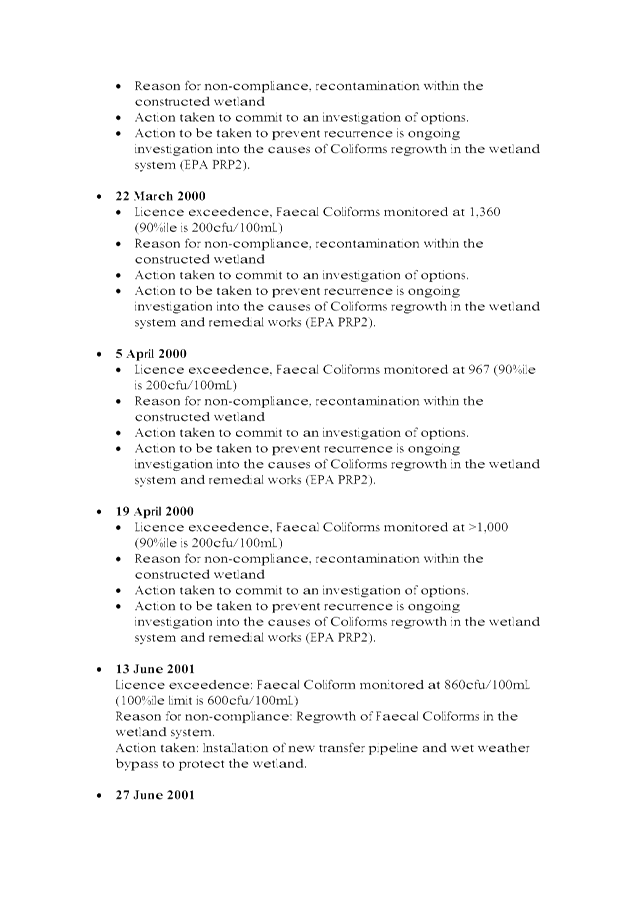
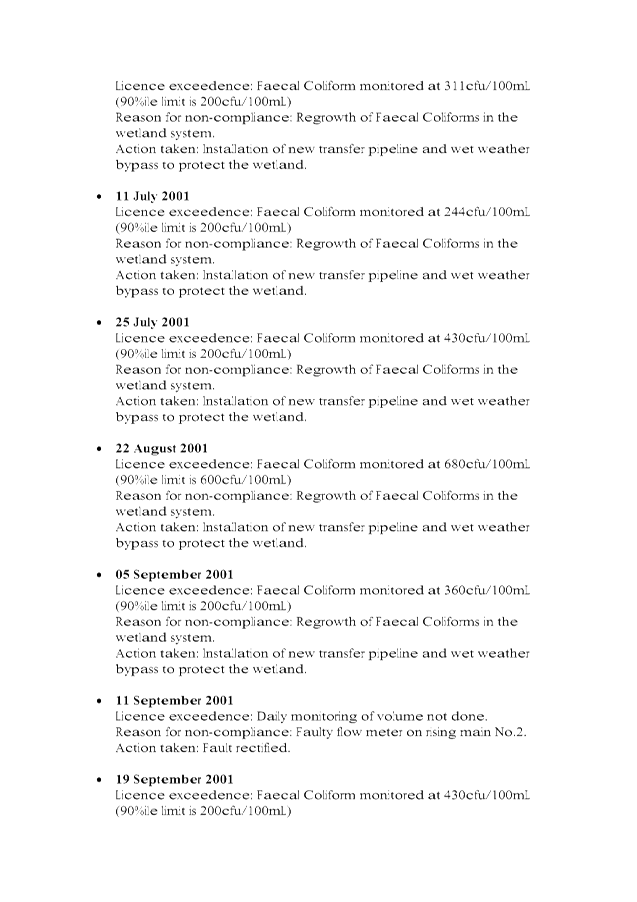
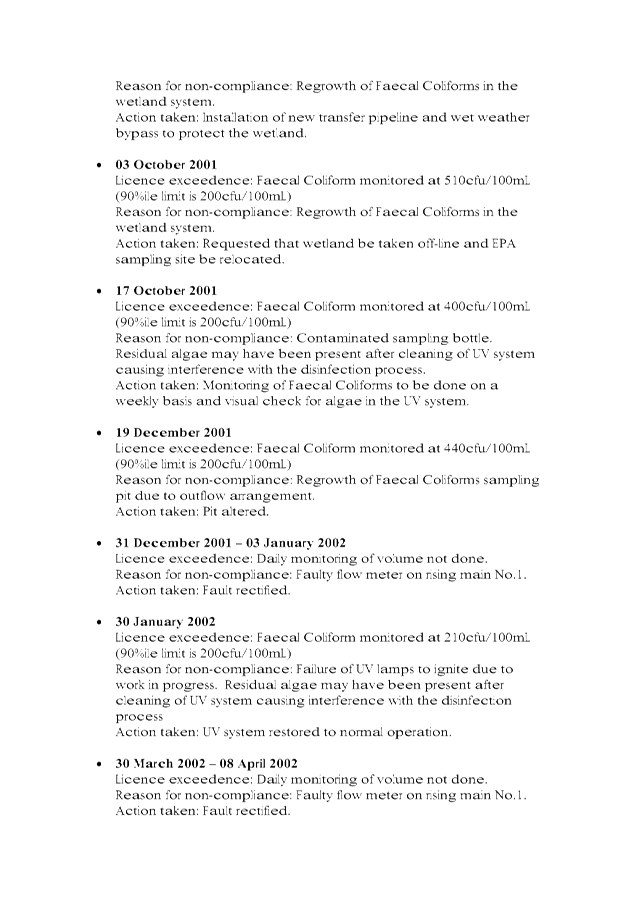
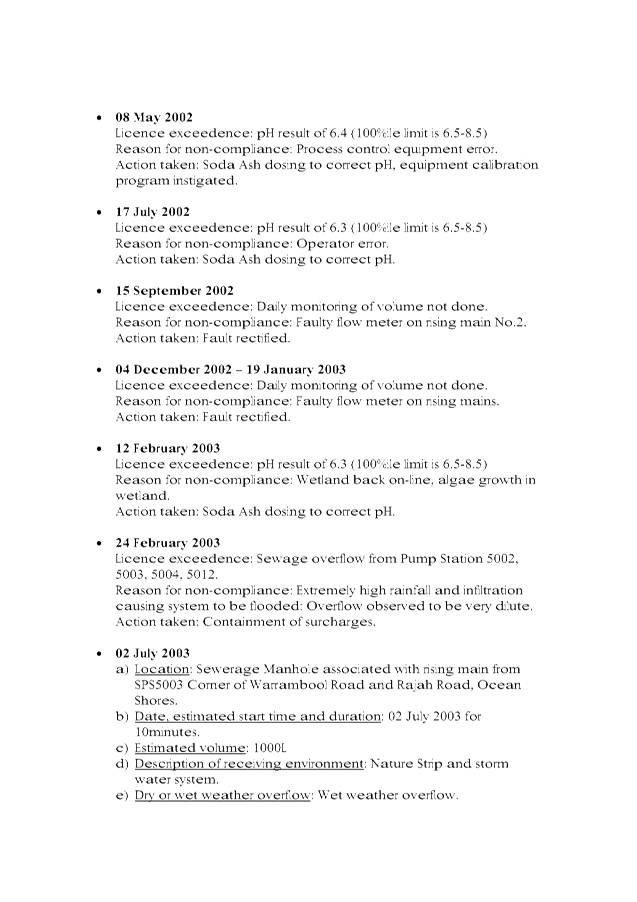

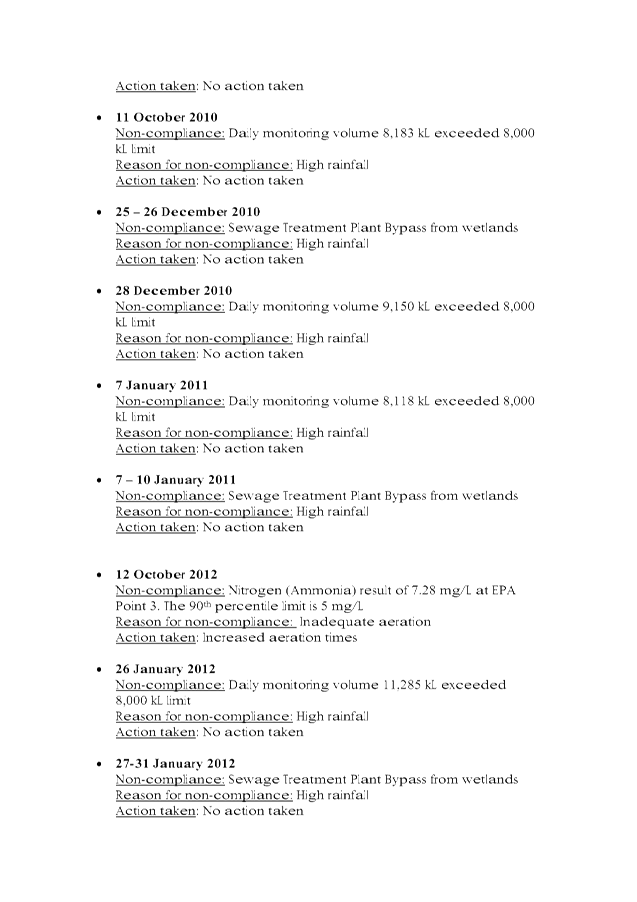
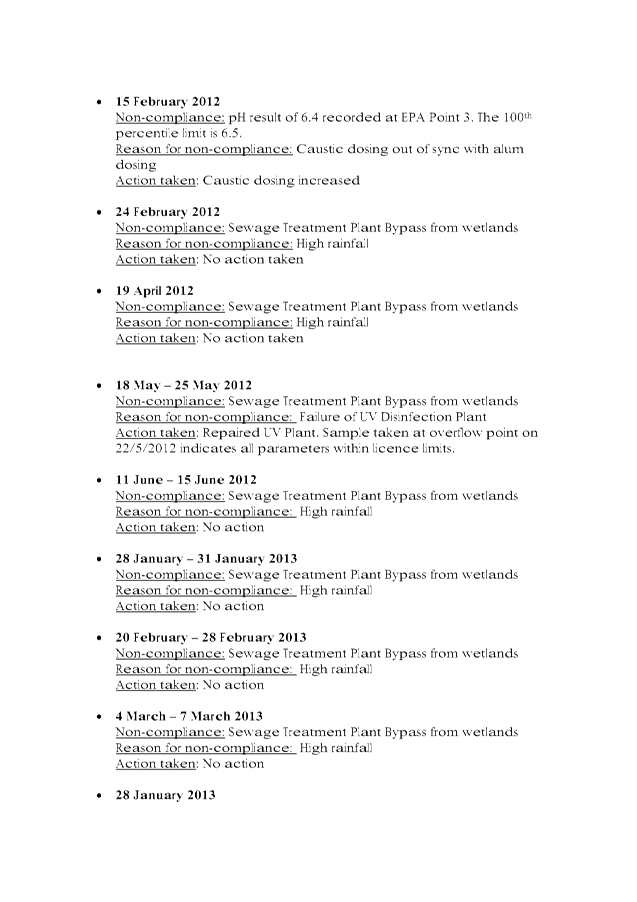
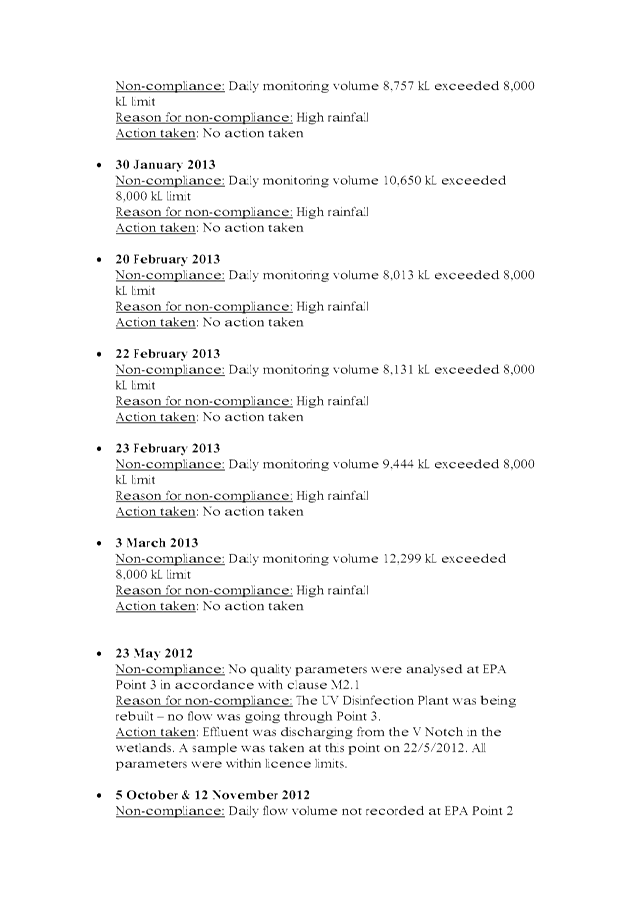
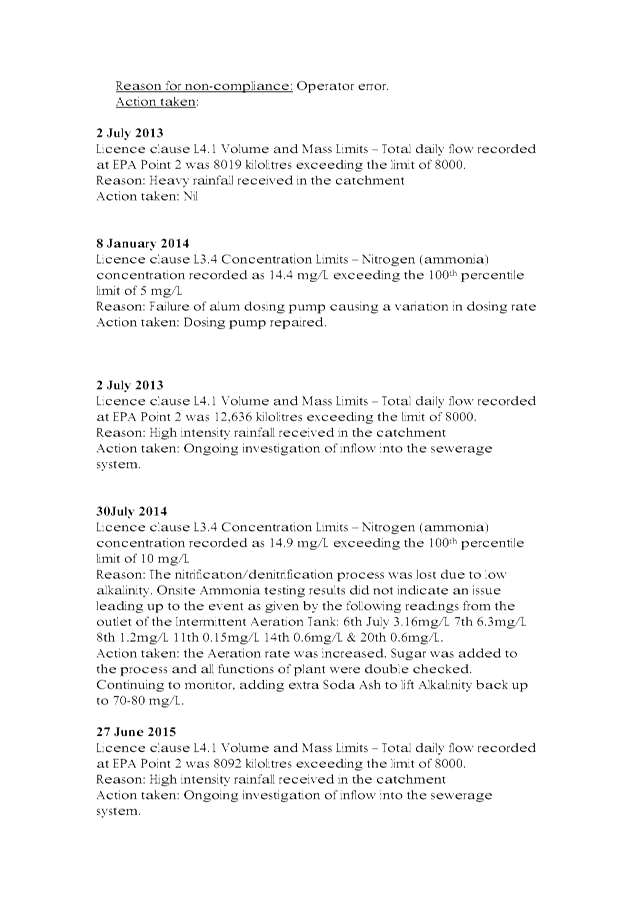

Staff Reports - Infrastructure Services 4.10
Report No. 4.10 Items
For the Committee Requested by Duncan Dey
Directorate: Infrastructure
Services
Report
Author: Peter
Rees, Manager Utilities
File No: I2017/1269
Theme: Community Infrastructure
Sewerage Services
Summary:
This report has presented 2 topics for discussion as
requested by committee member Duncan Dey.
|
RECOMMENDATION:
That the Committee note the report.
|
Attachments:
1 Capacity
Assessment of the Belongil Creek Drainage System Report No
16722b_ByronSTP_AlternativeFlowPath_BSC_opt, E2017/13761
, page 101⇩
Report
It was requested by committee member Duncan Dey to table the
following items at the next Water Waste and Sewer Advisory Committee meeting.
1. the capacity (and its exceedence) of the receiving
environment downstream from Byron STP;
2. the
comparative values of increasing size of STPs versus reducing stormwater sent
to them, and for Brunz Valley STP in particular.
In relation to question 1, Council initiated a 12 month study
on the sustainable capacity of the Belongil. The resulting report was presented
to the Coastal Estuary Catchment Panel at its March 2017 meeting.
The study found the capacity of the Belongil was adequate to
undertake planning an upgrade of the Byron Bay Sewage Plant to 10 ML/day
average dry weather flow. On this basis it could be concluded there have been
no exceedences of the receiving environment downstream of the Byron Bay STP.
The study’s report is attached for information.
For the second item, it is proposed this item be discussed
at the meeting.
Financial Implications
Nil
Statutory and Policy
Compliance Implications
Nil
Staff Reports - Infrastructure Services 4.10 - Attachment 1
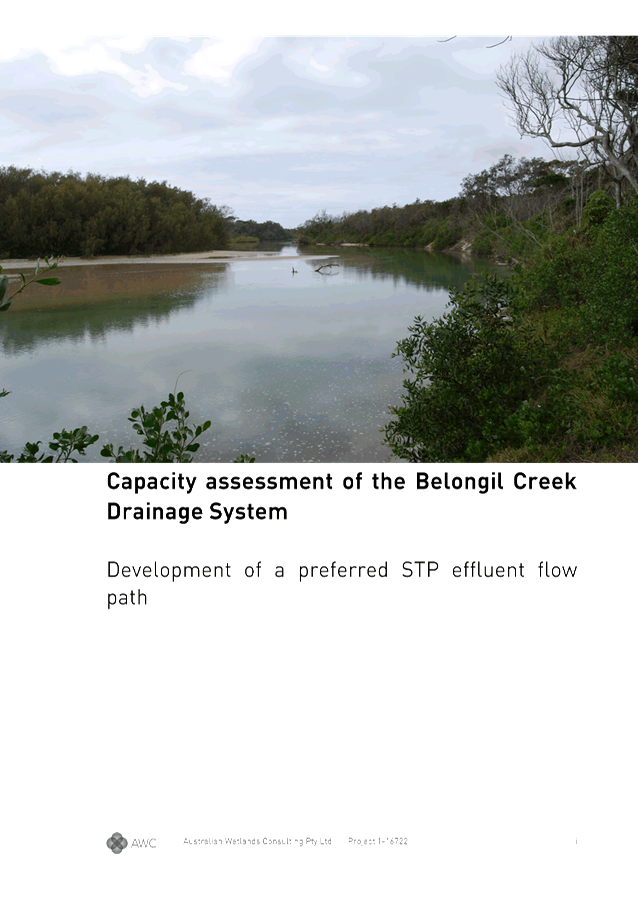
Staff Reports - Infrastructure Services 4.10 - Attachment 1
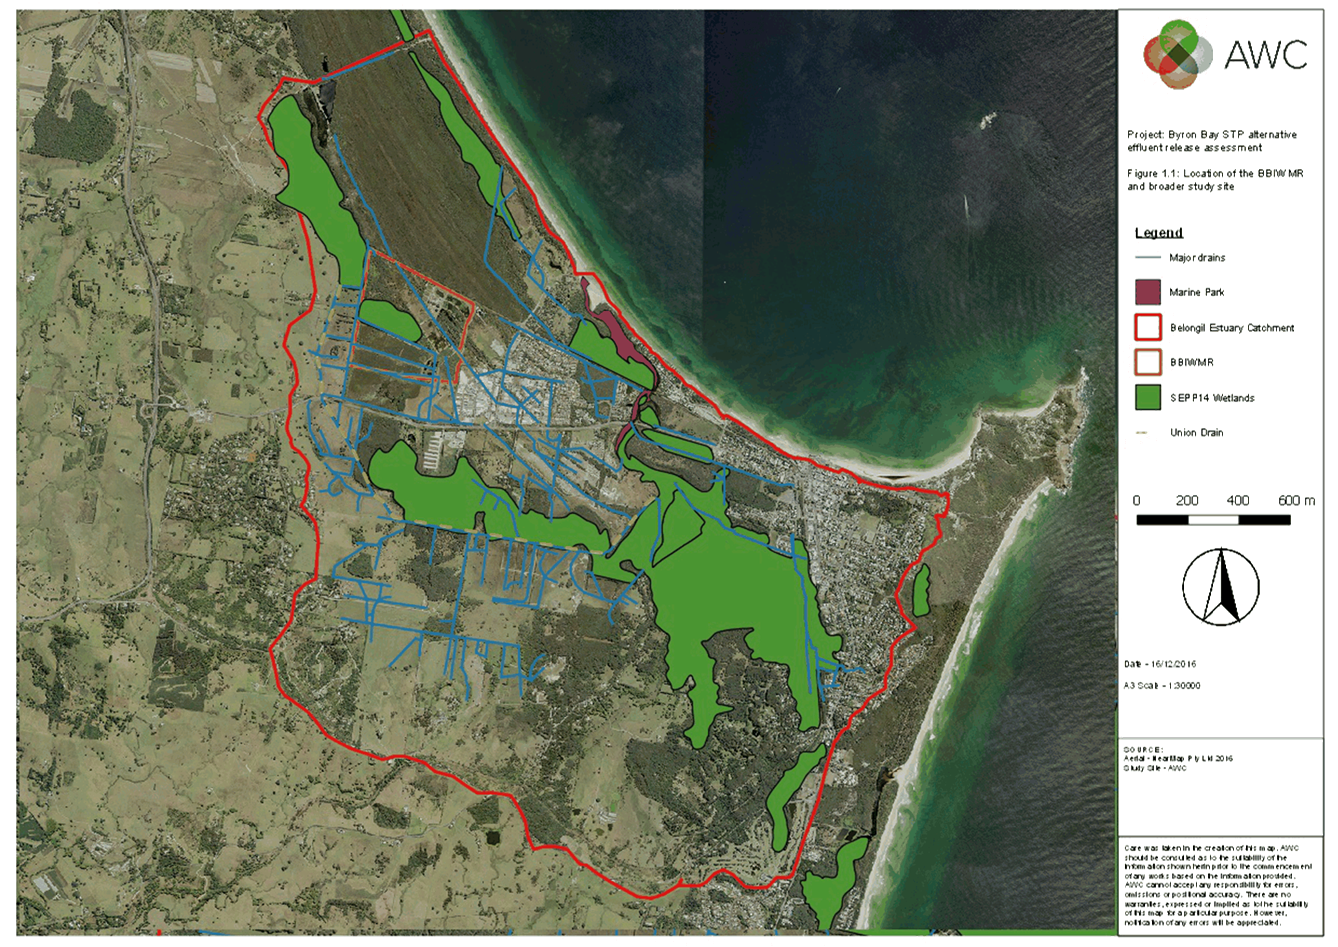
Staff Reports - Infrastructure Services 4.10 - Attachment 1
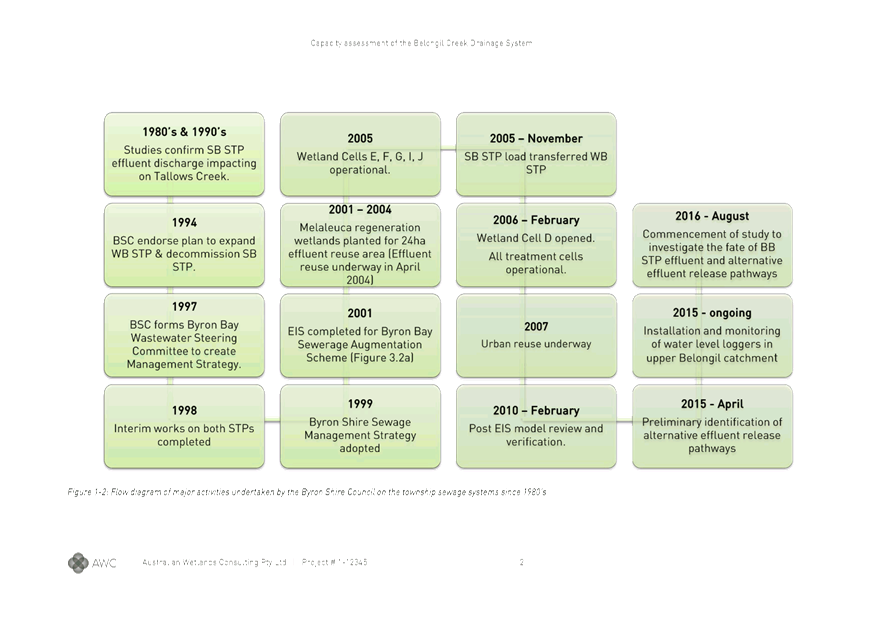
Staff Reports - Infrastructure Services 4.10 - Attachment 1
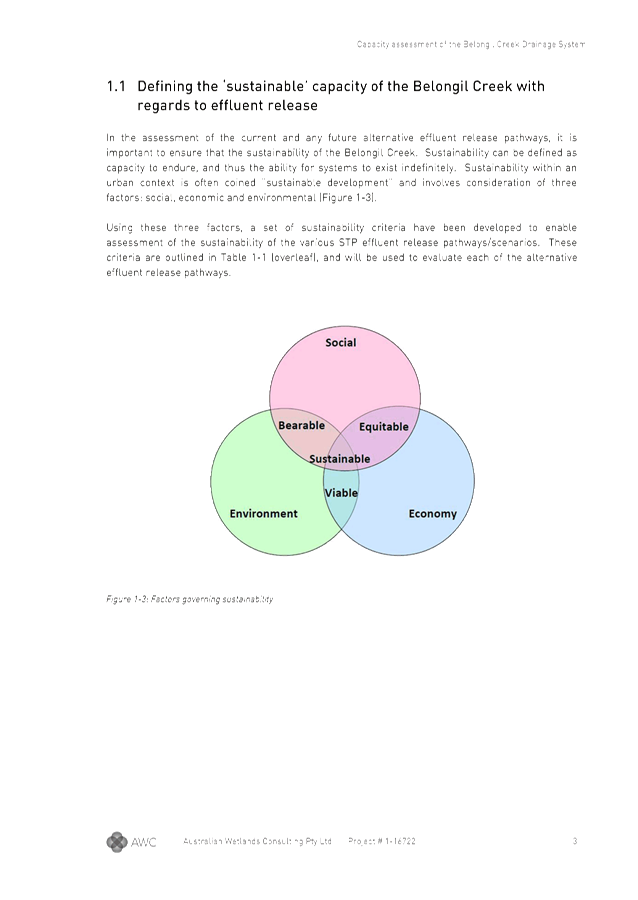
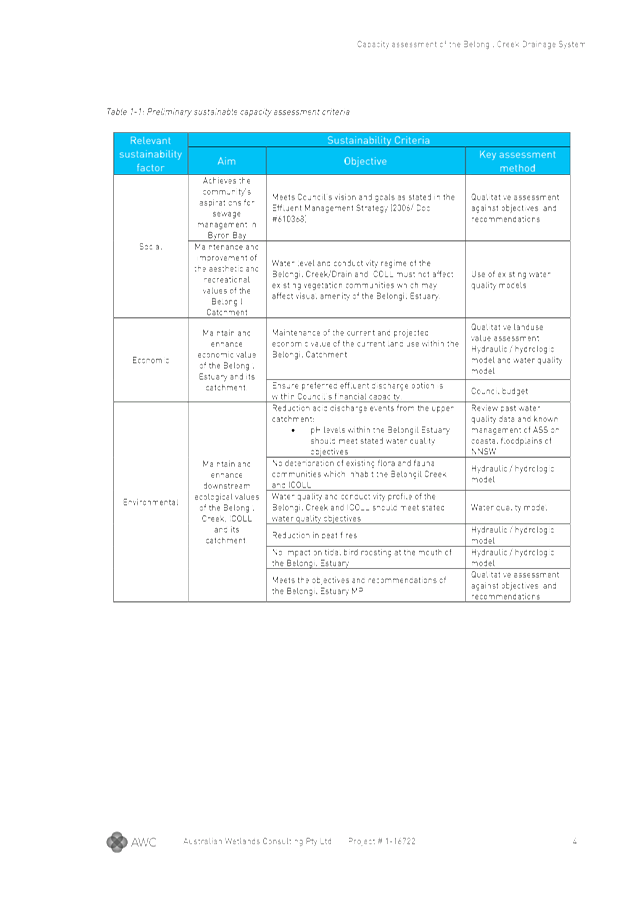
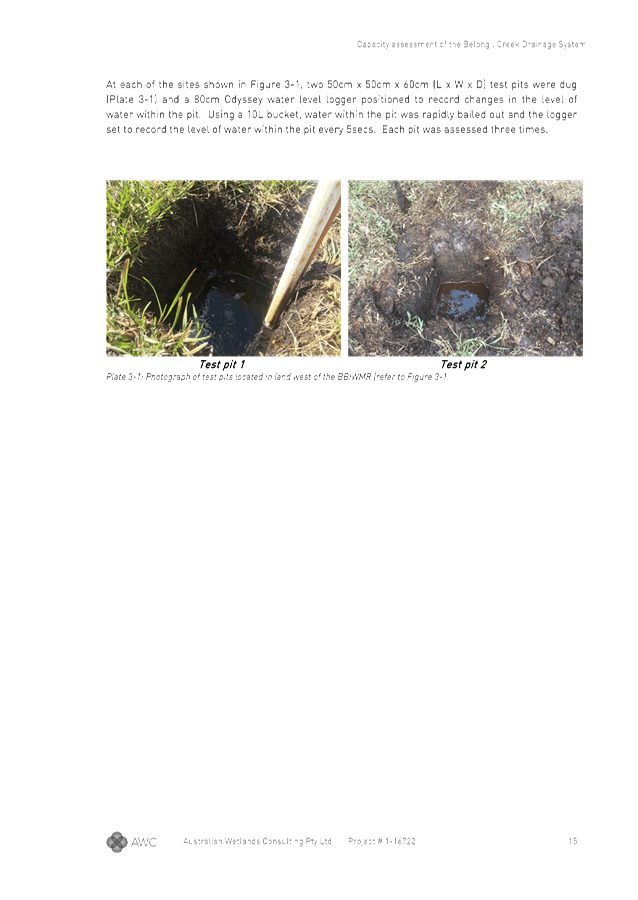
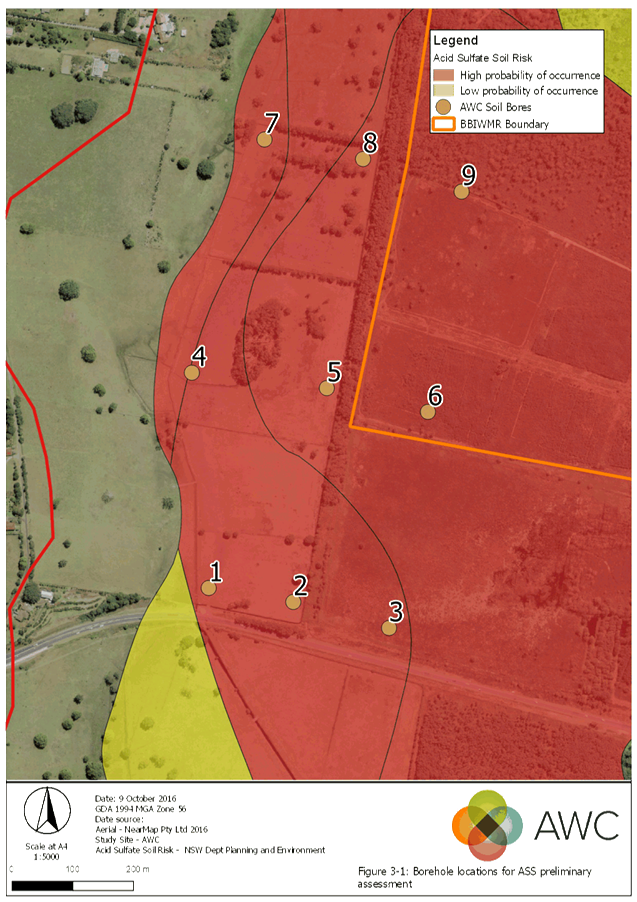
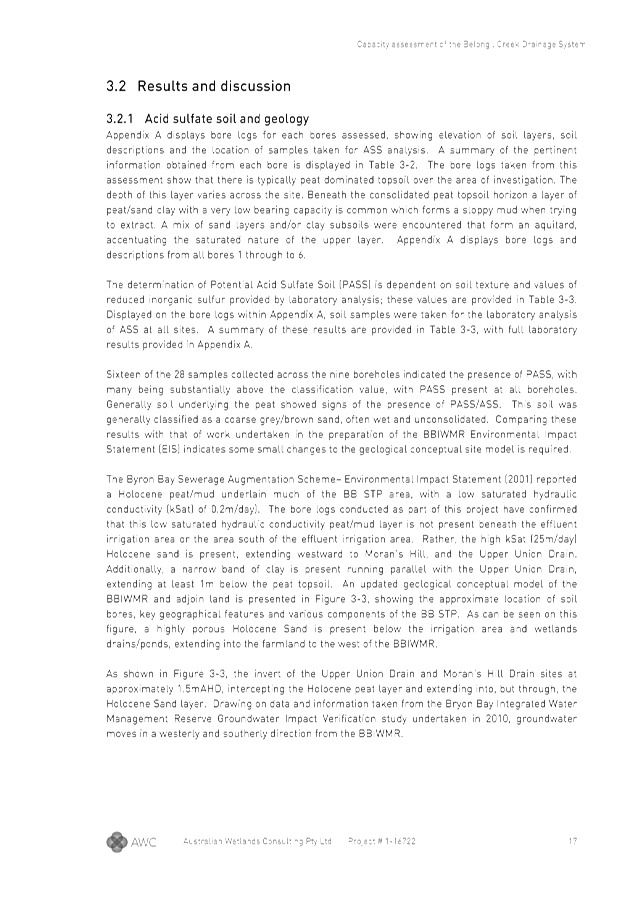
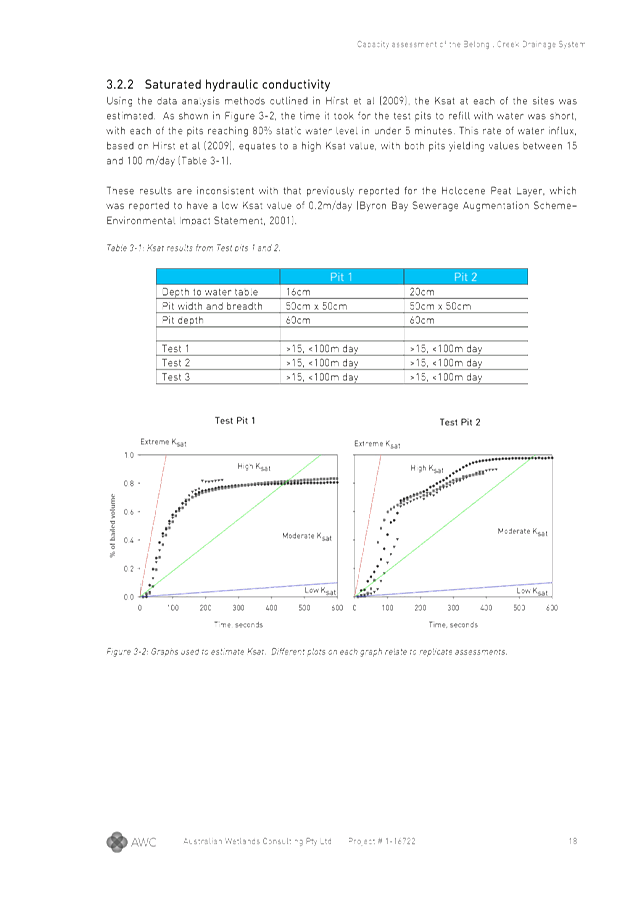
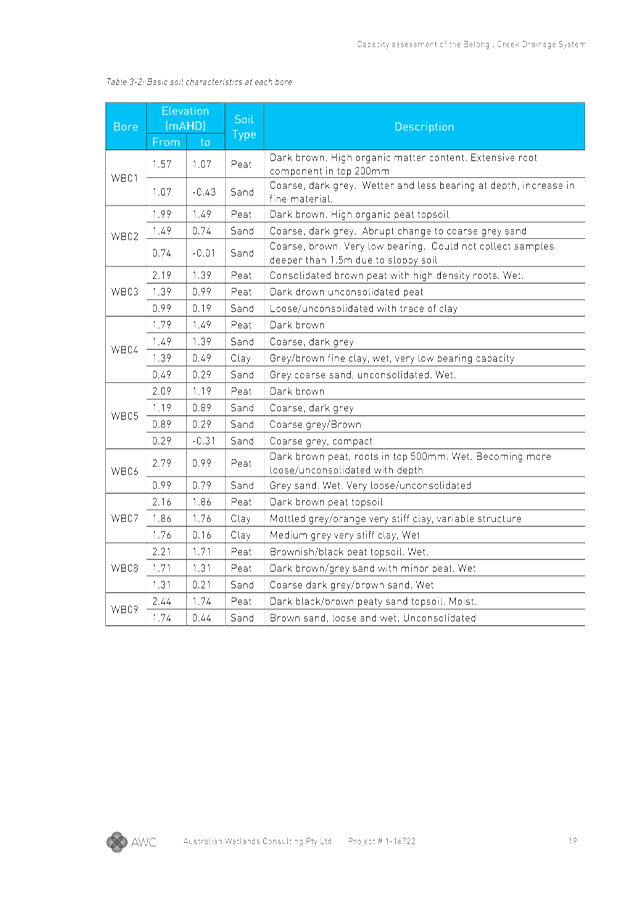
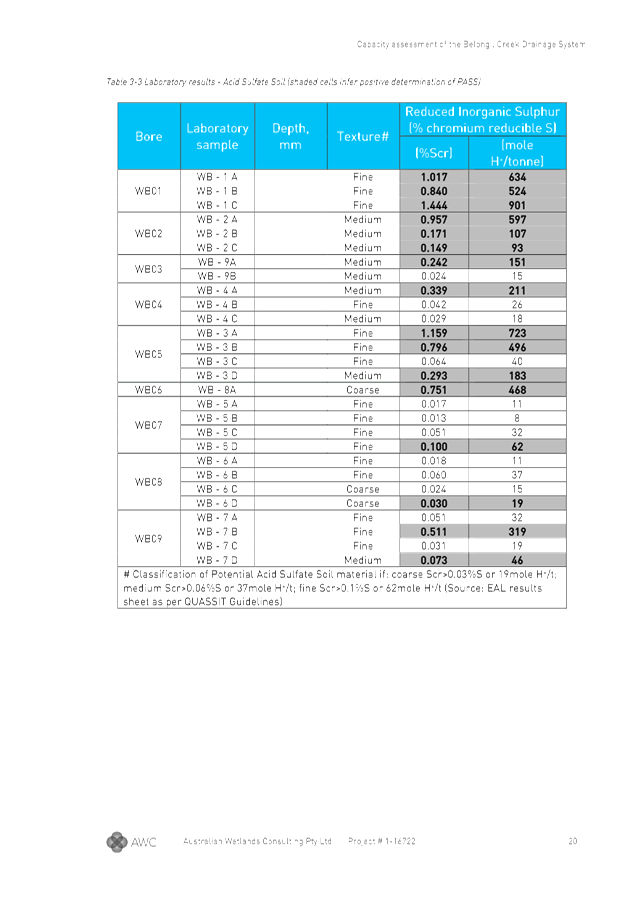
Staff Reports - Infrastructure Services 4.10 - Attachment 1
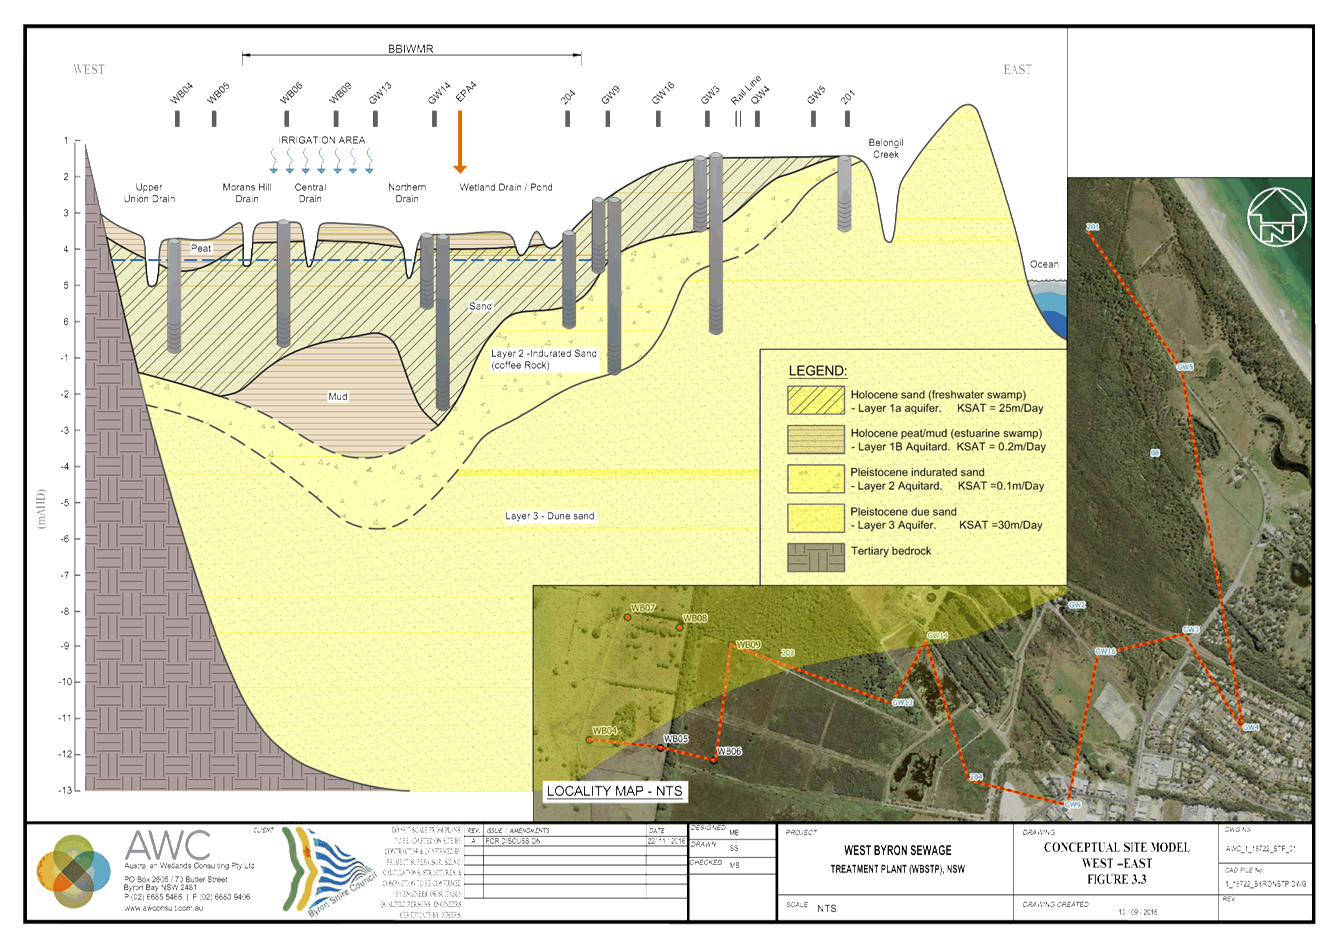
Staff Reports - Infrastructure Services 4.10 - Attachment 1

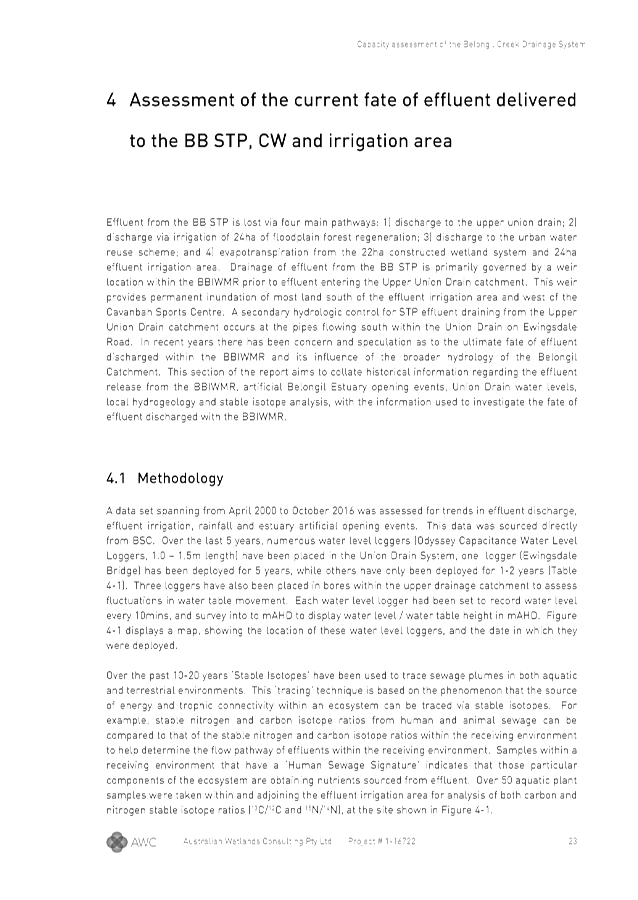
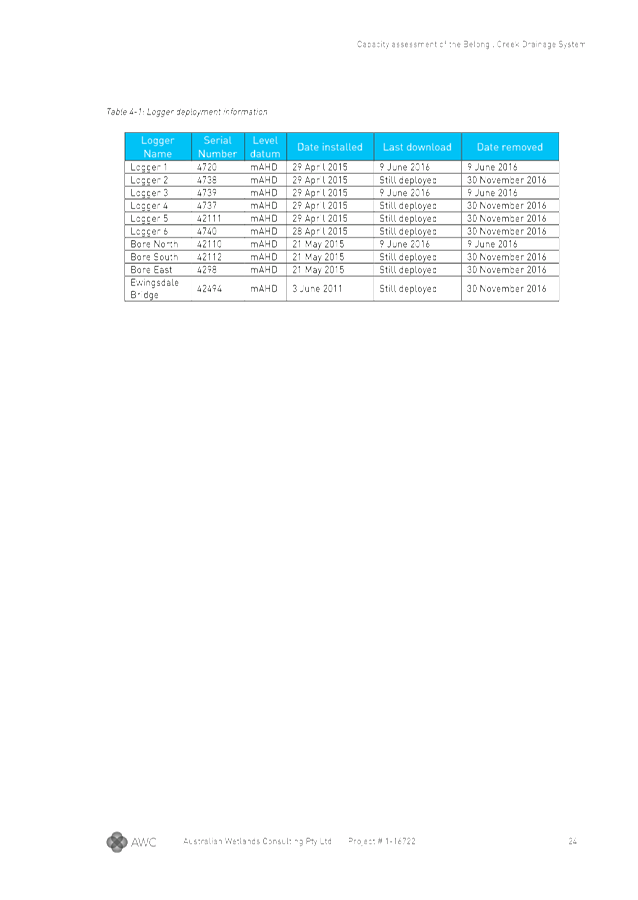
Staff Reports - Infrastructure Services 4.10 - Attachment 1
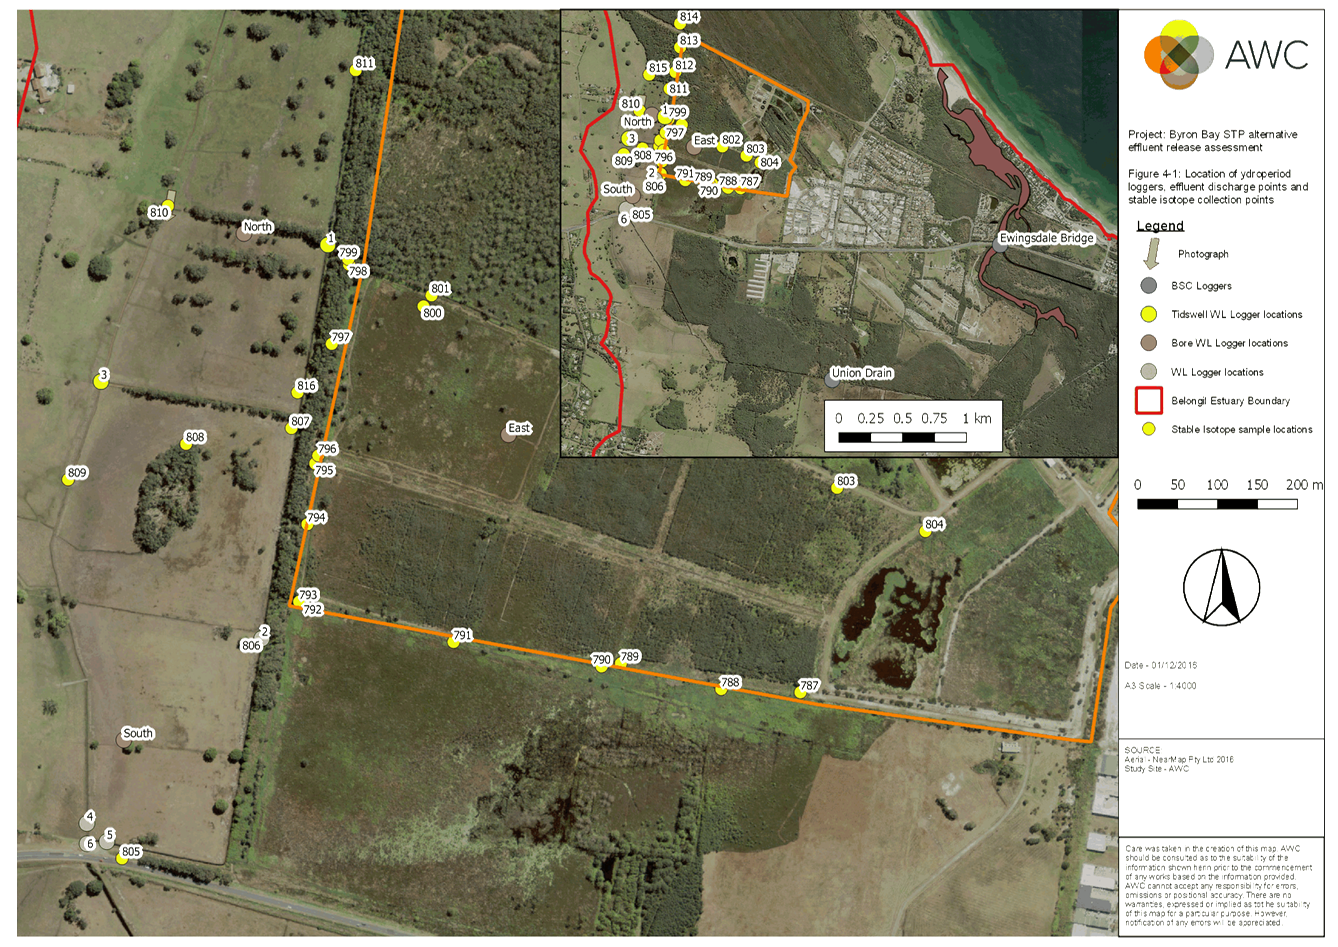
Staff Reports - Infrastructure Services 4.10 - Attachment 1
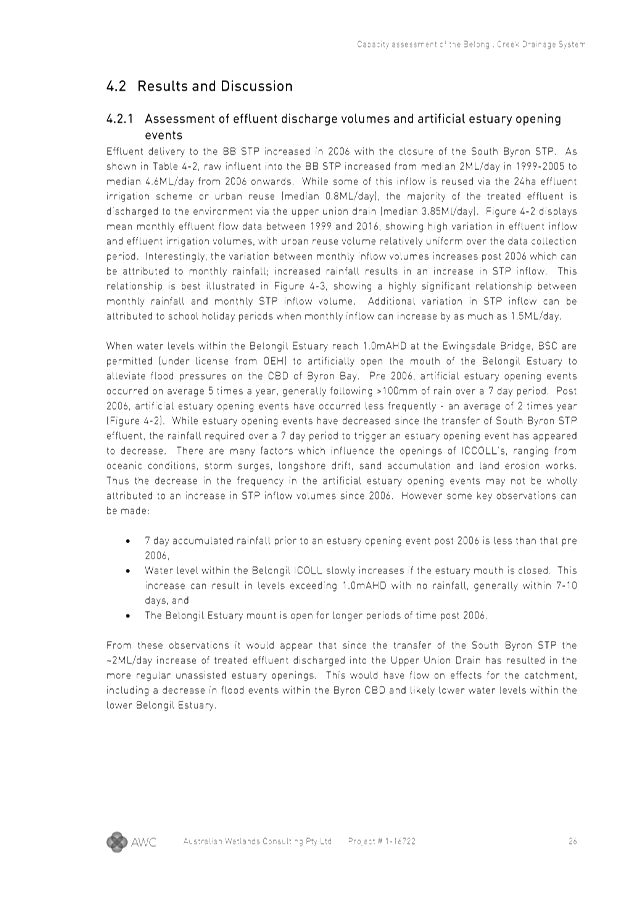
Staff Reports - Infrastructure Services 4.10 - Attachment 1
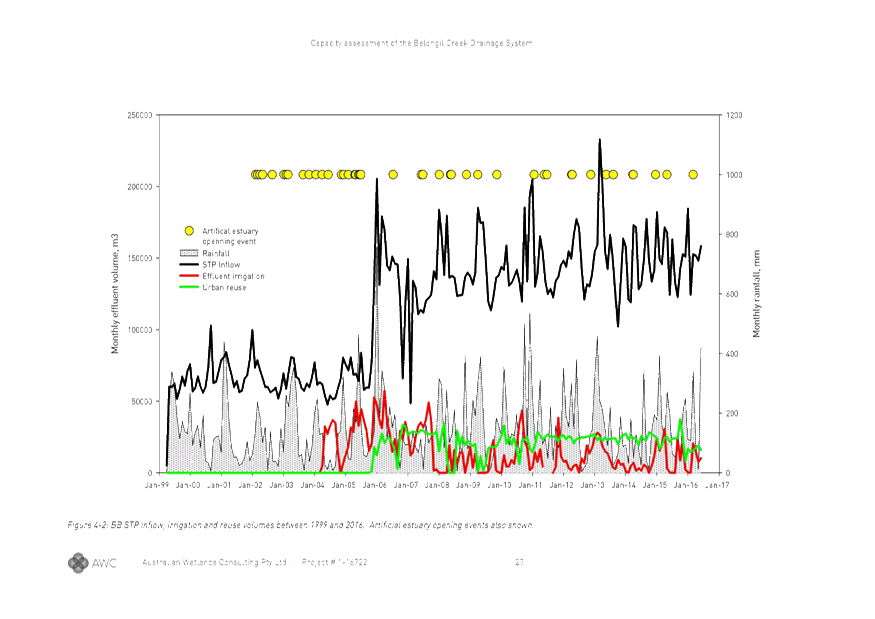
Staff Reports - Infrastructure Services 4.10 - Attachment 1
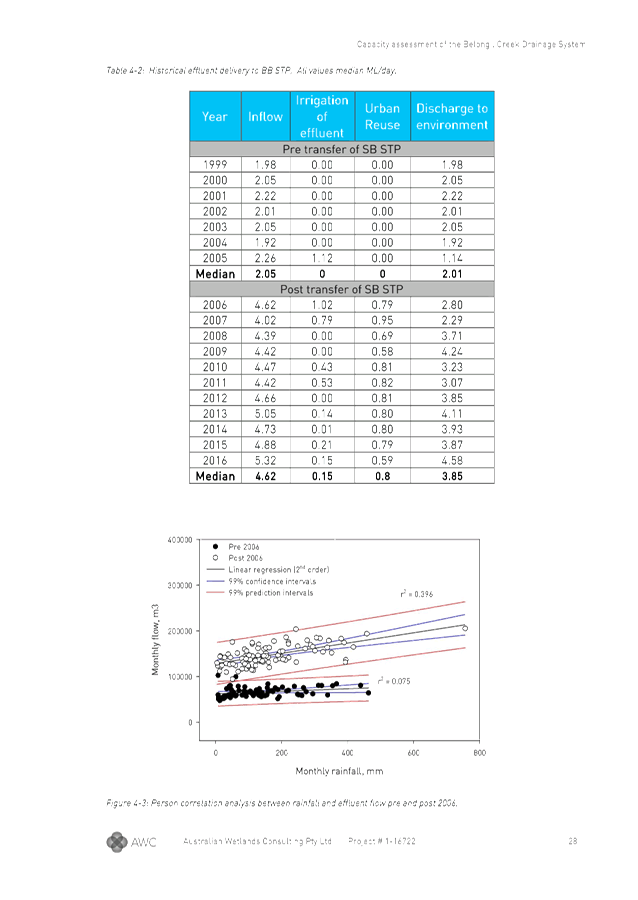
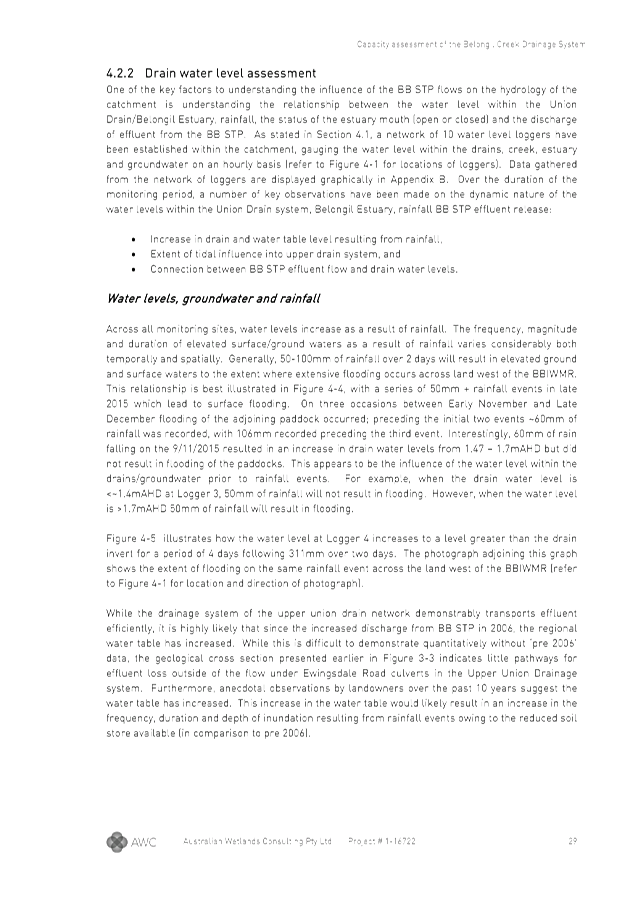
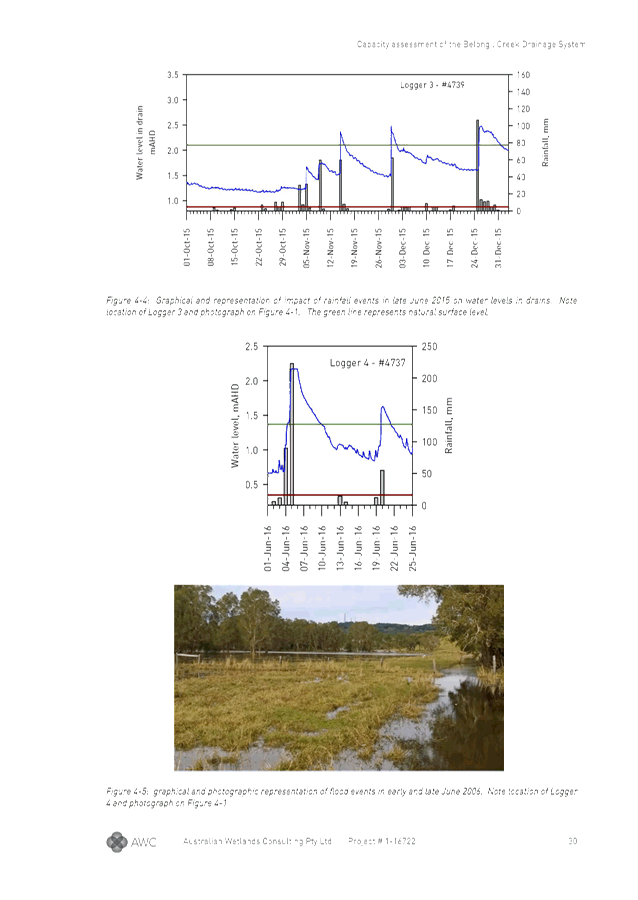
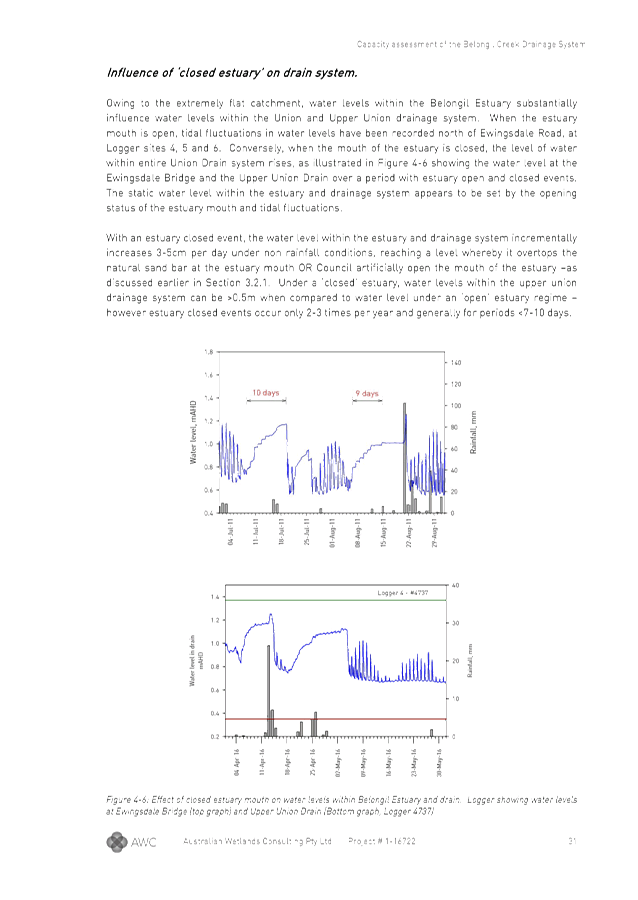
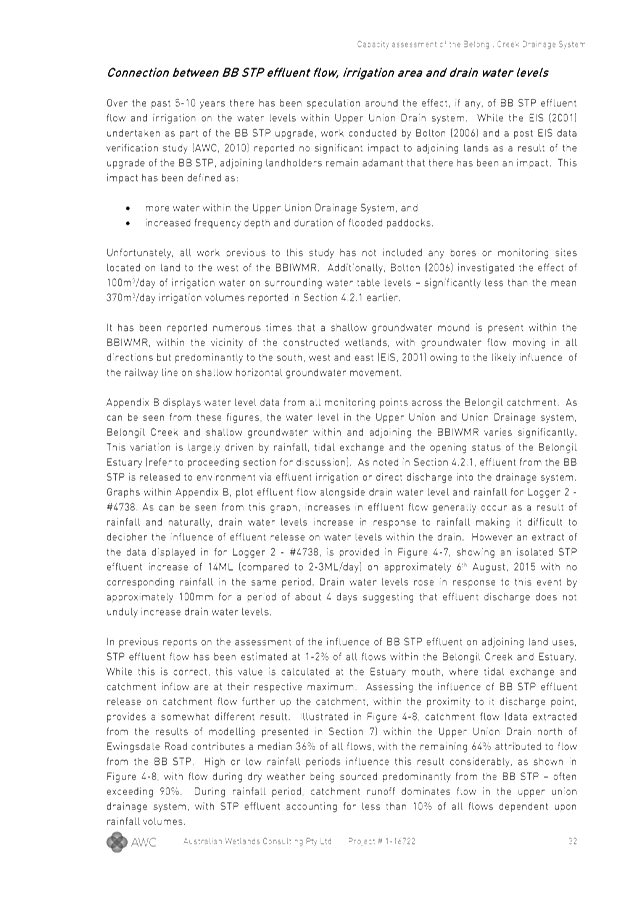
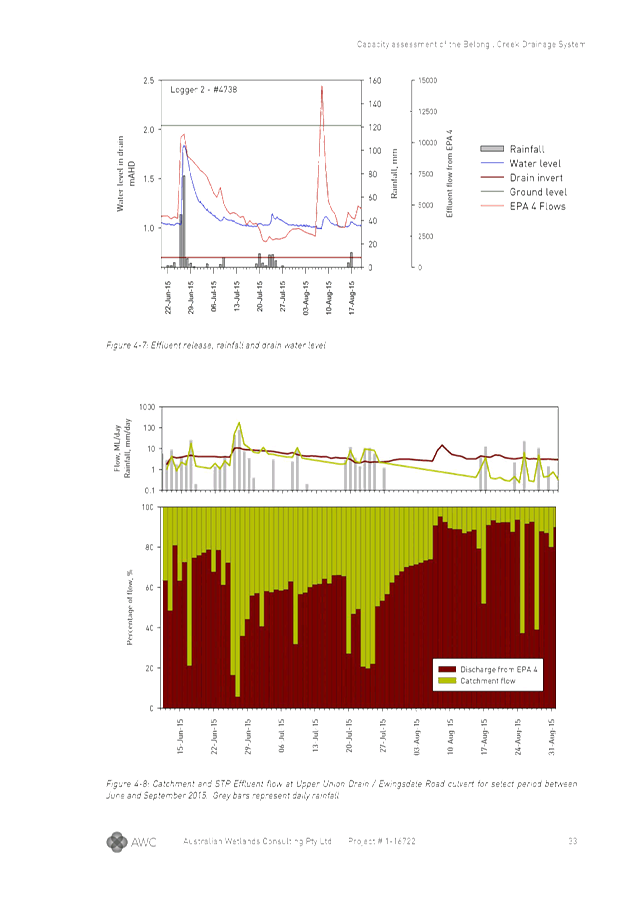
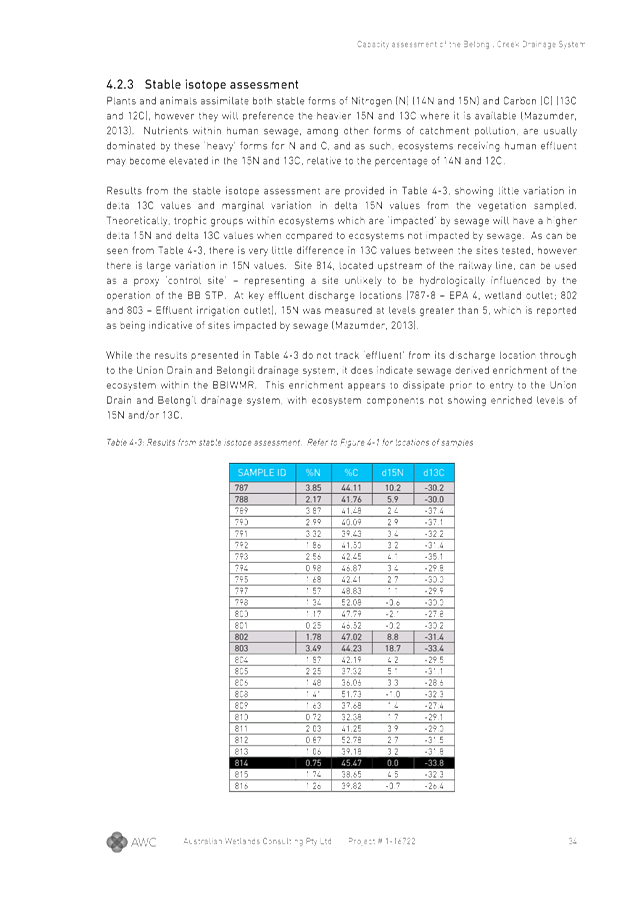

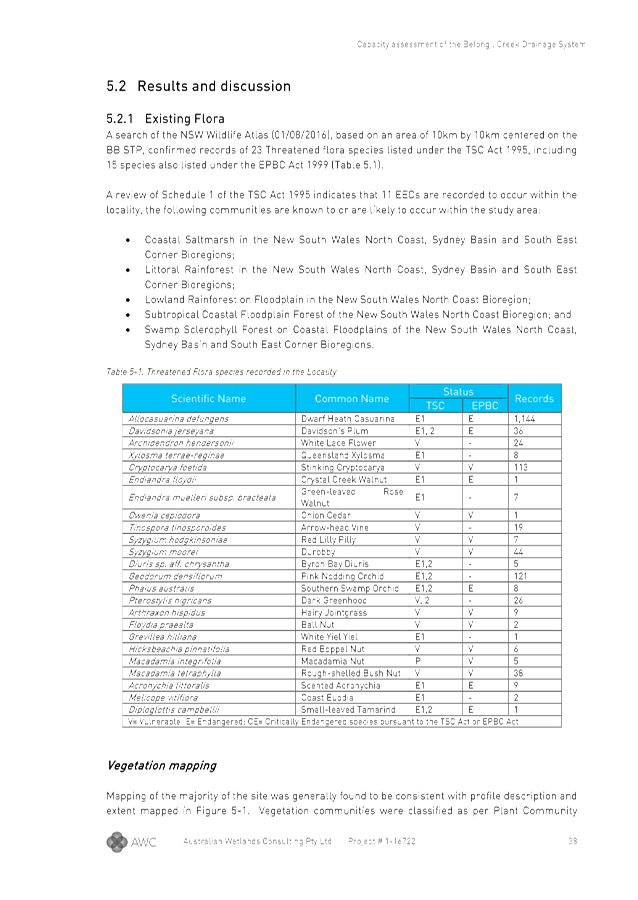
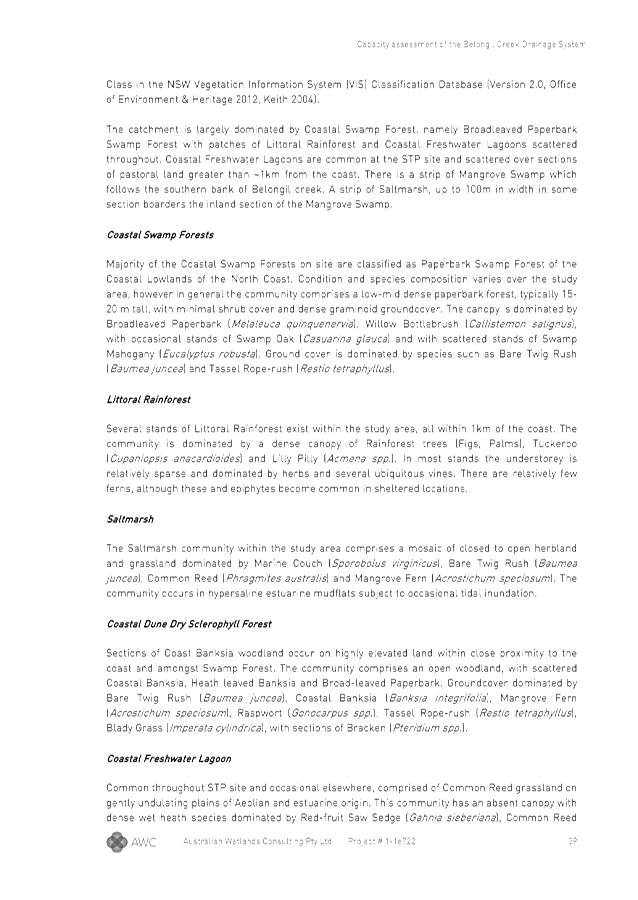
Staff Reports - Infrastructure Services 4.10 - Attachment 1
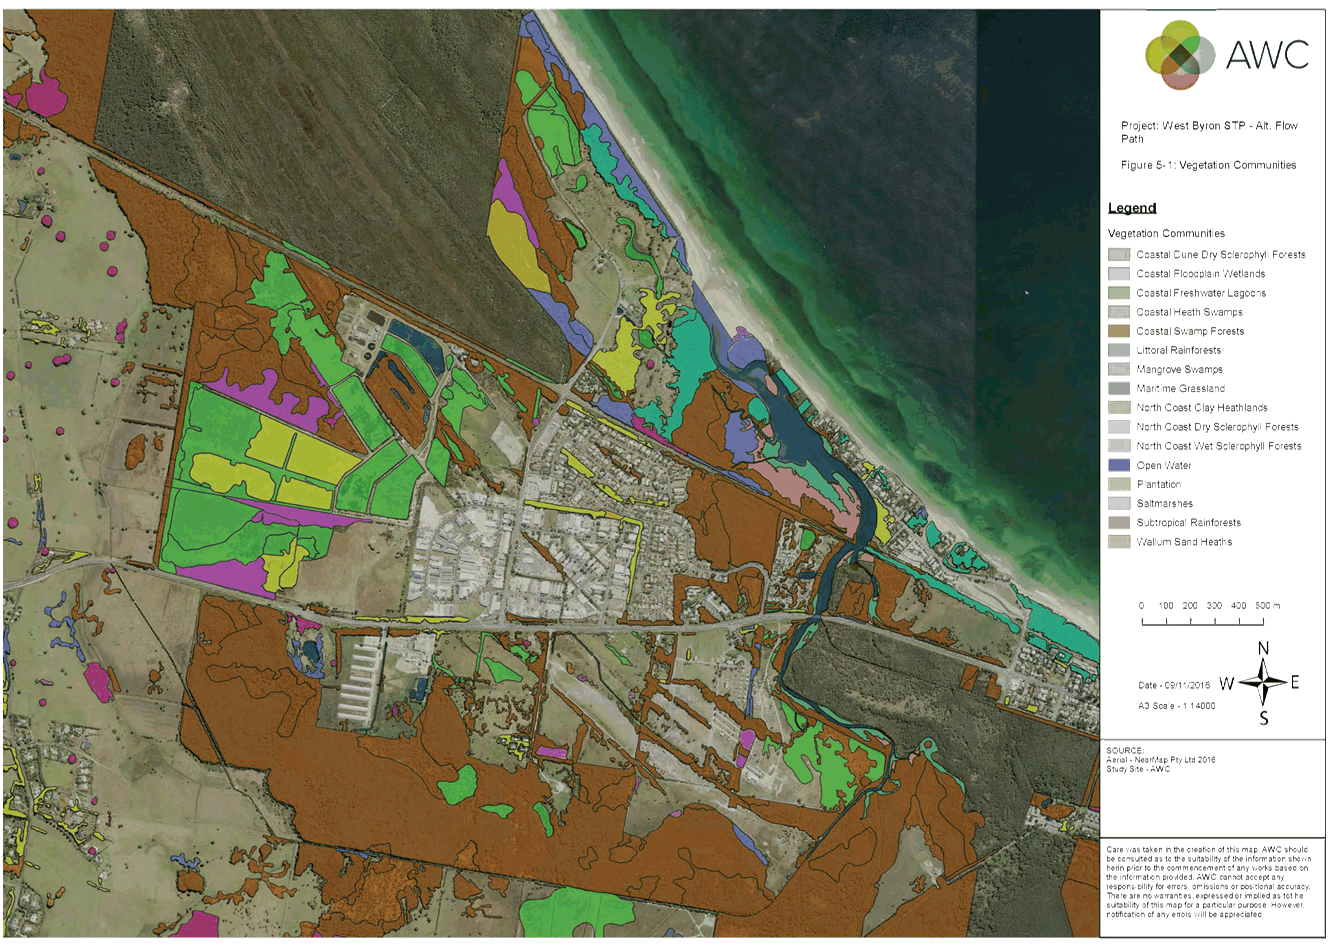
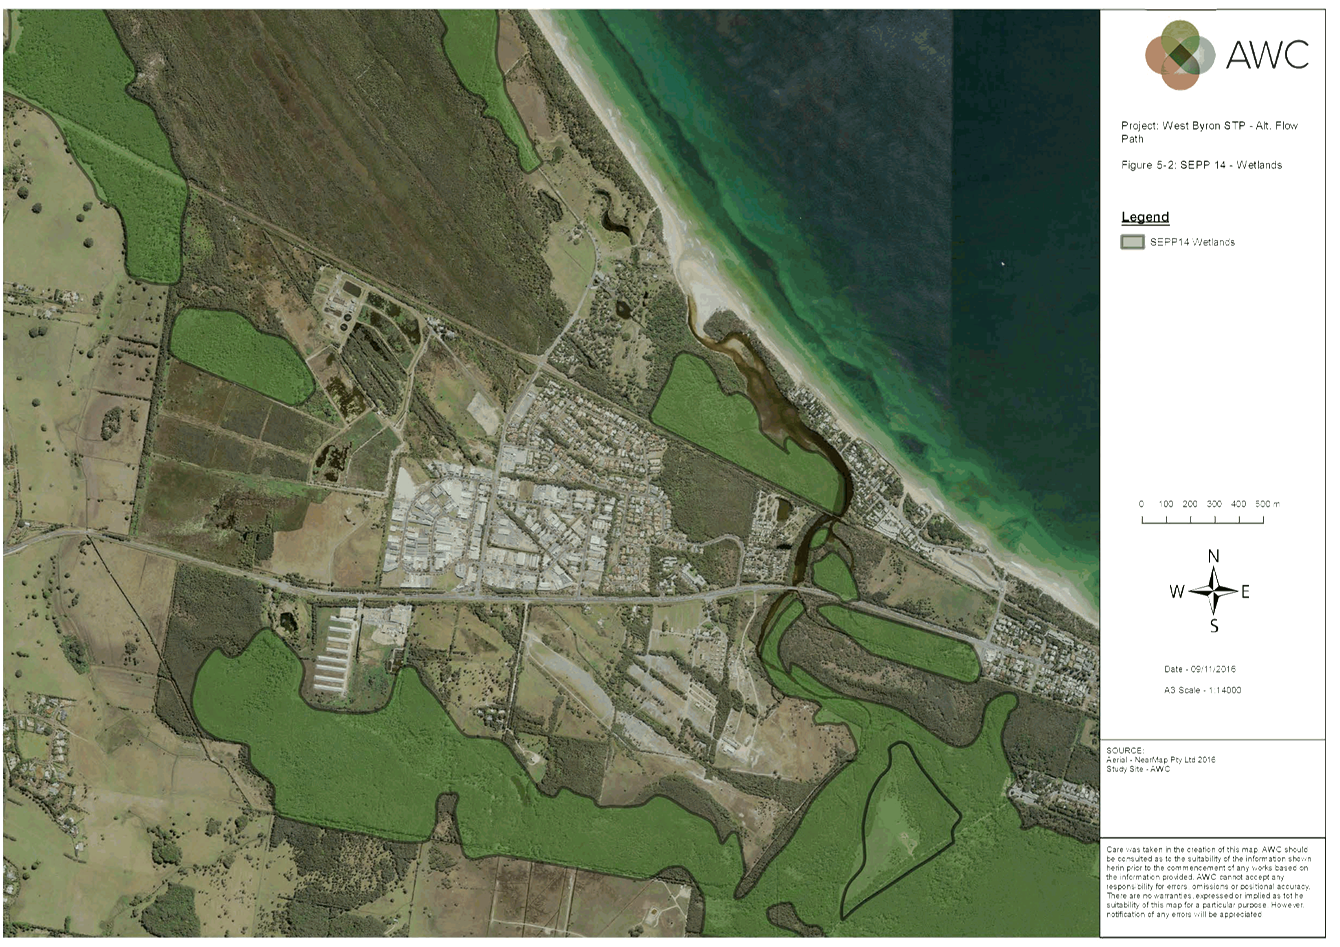
Staff Reports - Infrastructure Services 4.10 - Attachment 1
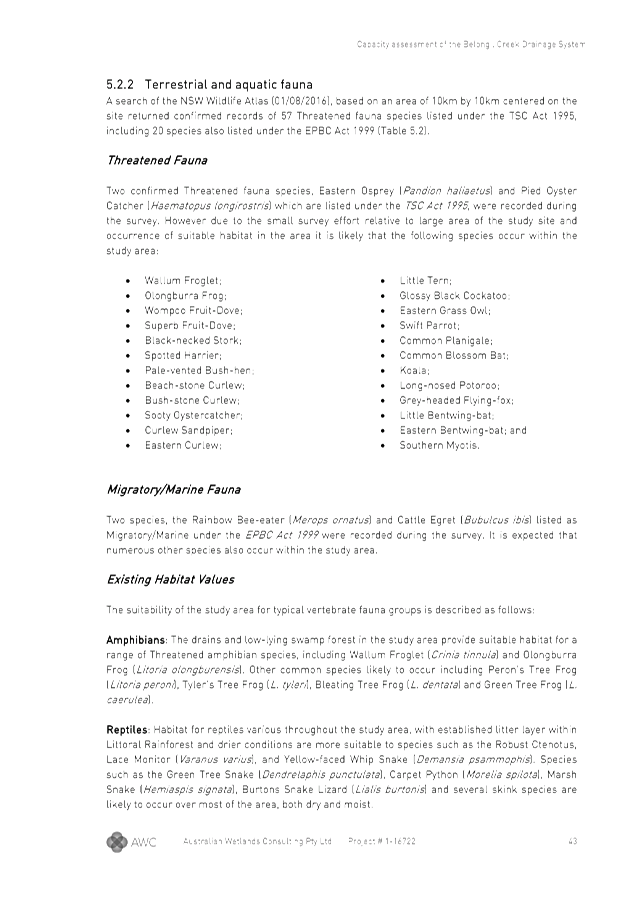
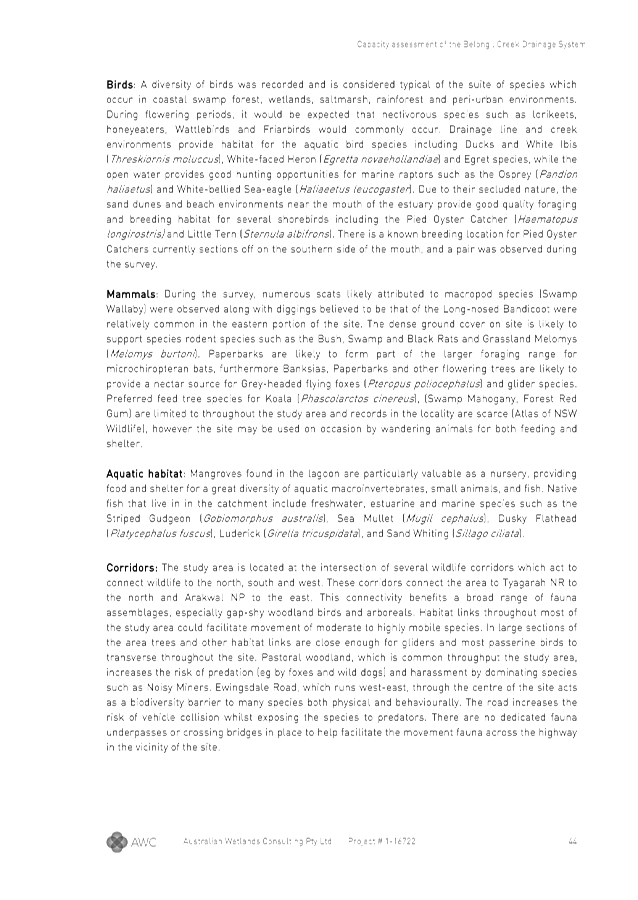
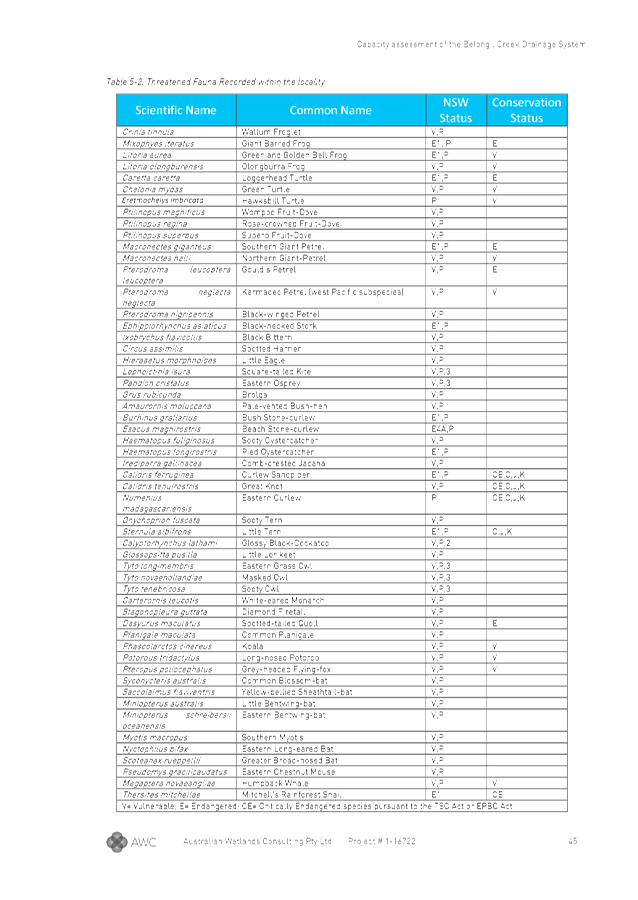
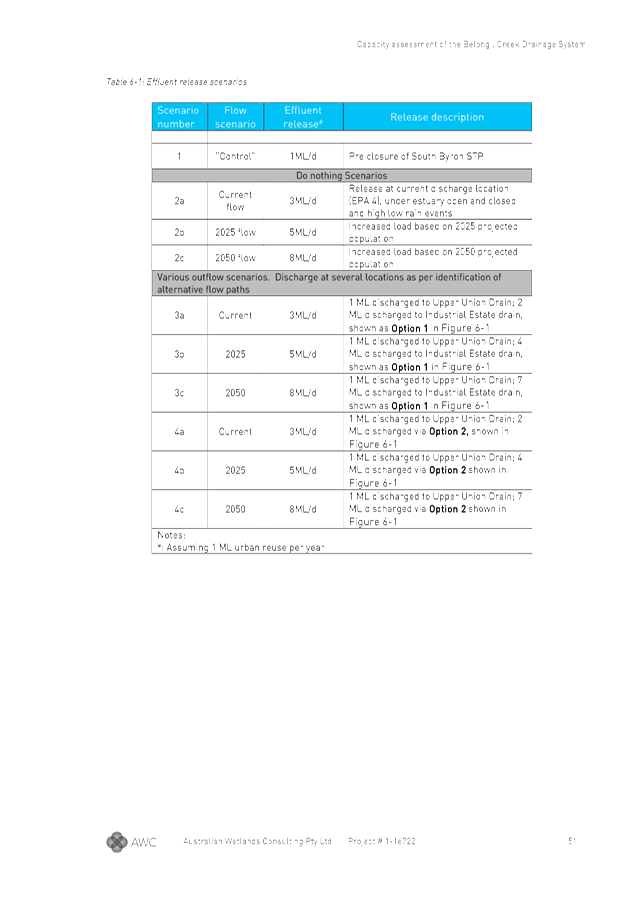
Staff Reports - Infrastructure Services 4.10 - Attachment 1
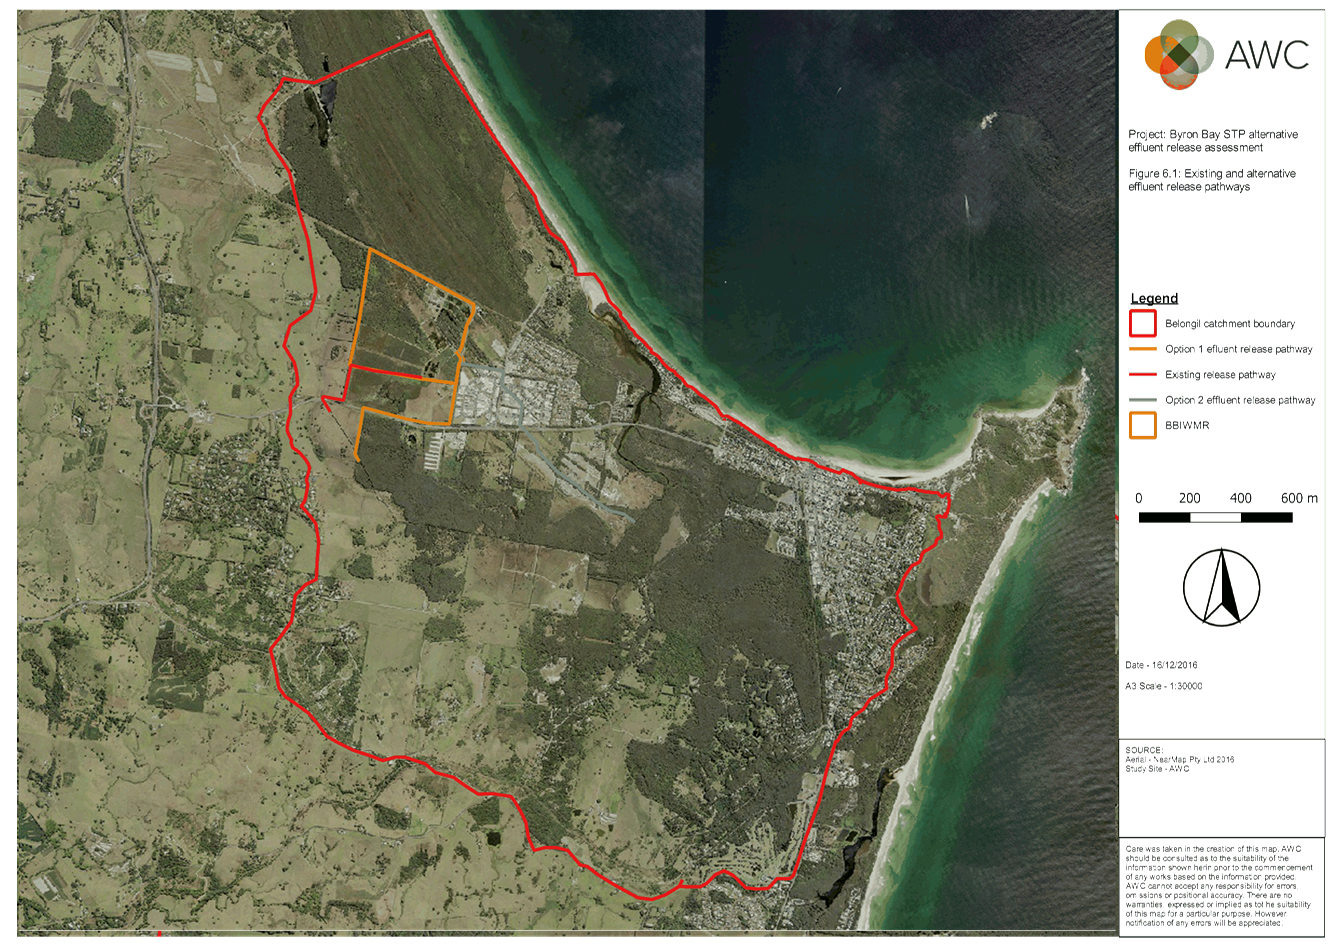
Staff Reports - Infrastructure Services 4.10 - Attachment 1
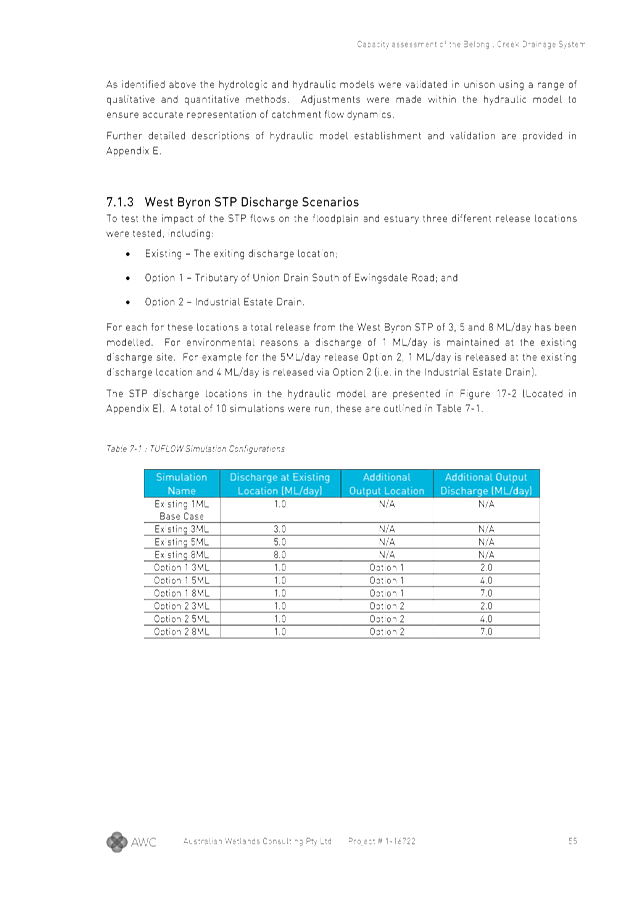
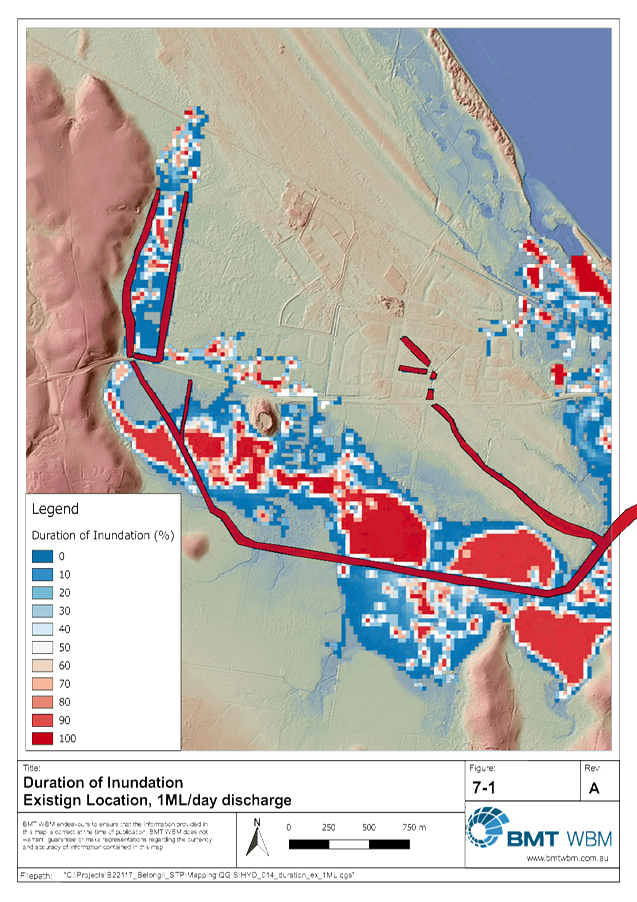
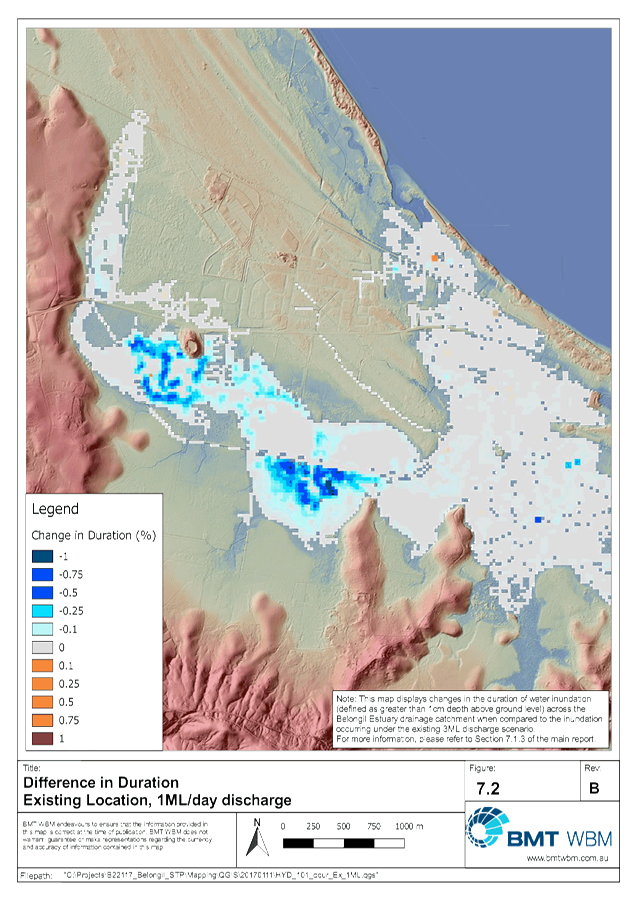


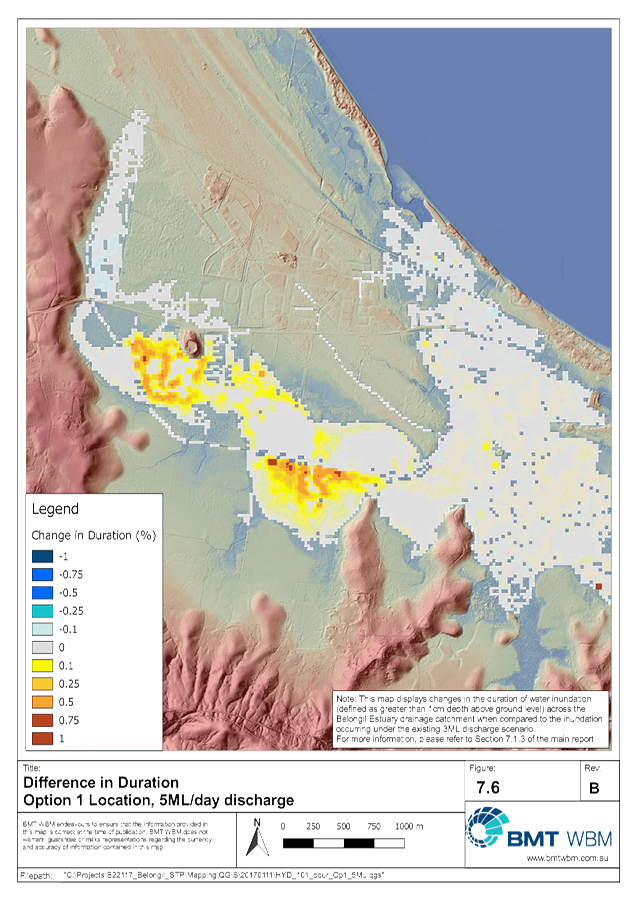
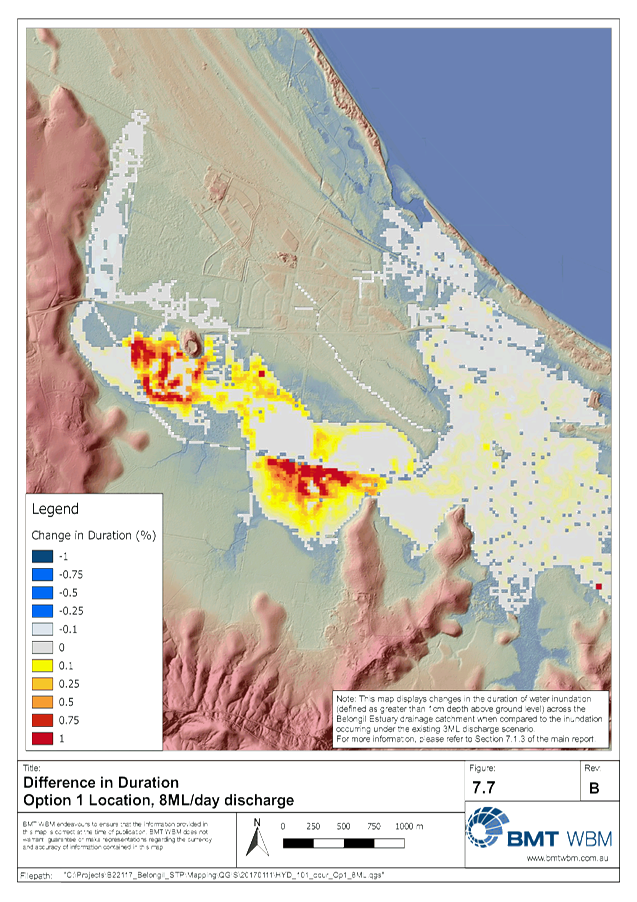
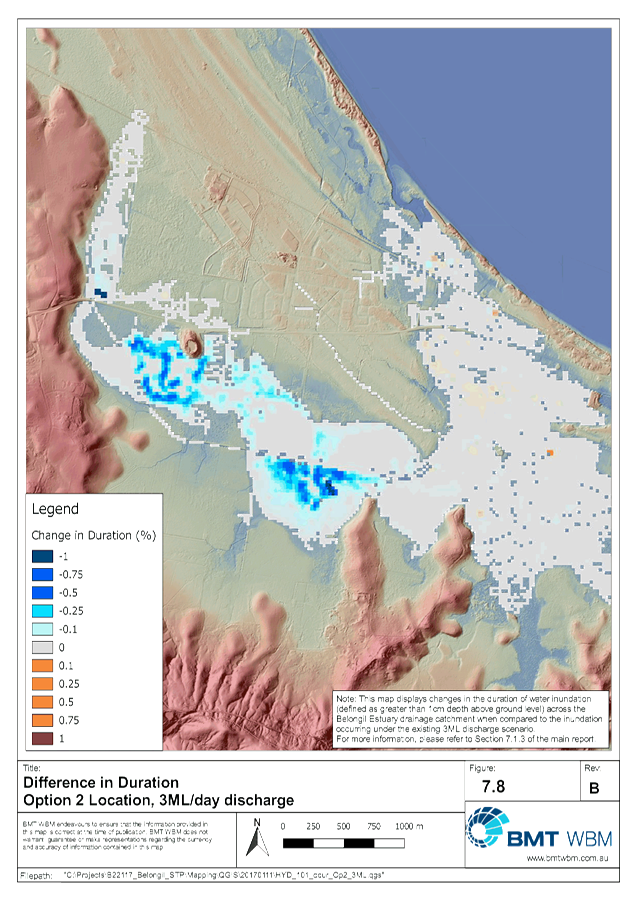
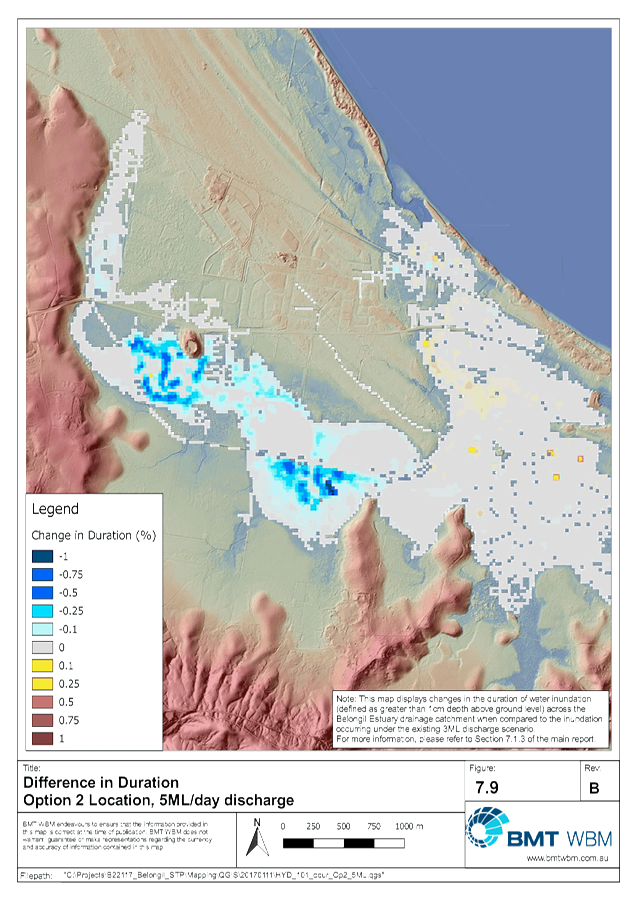
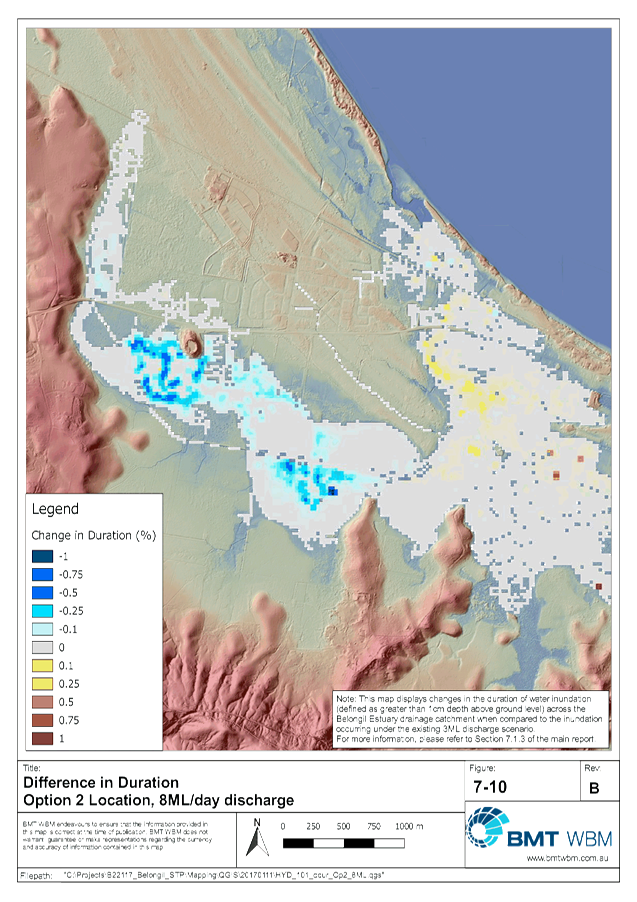
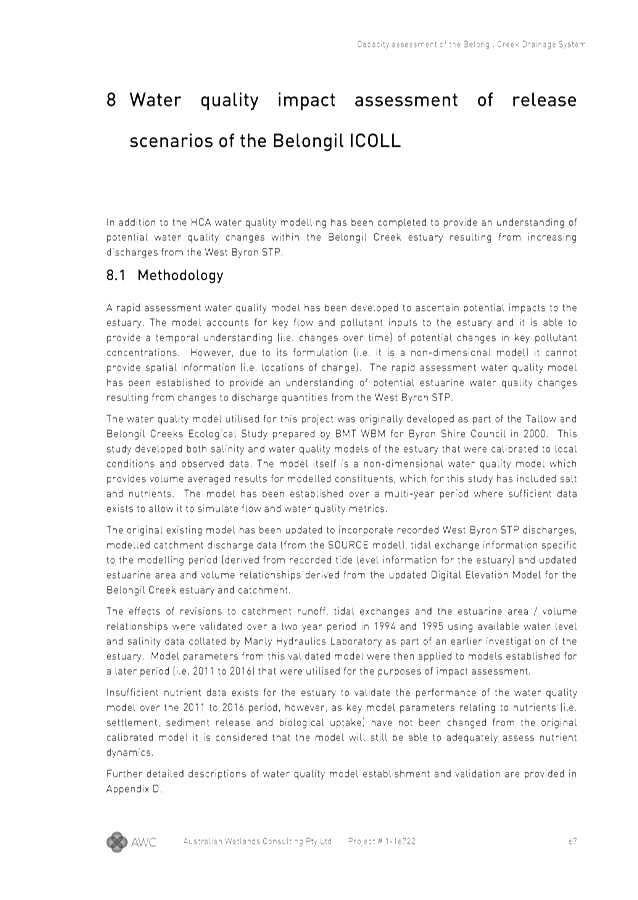
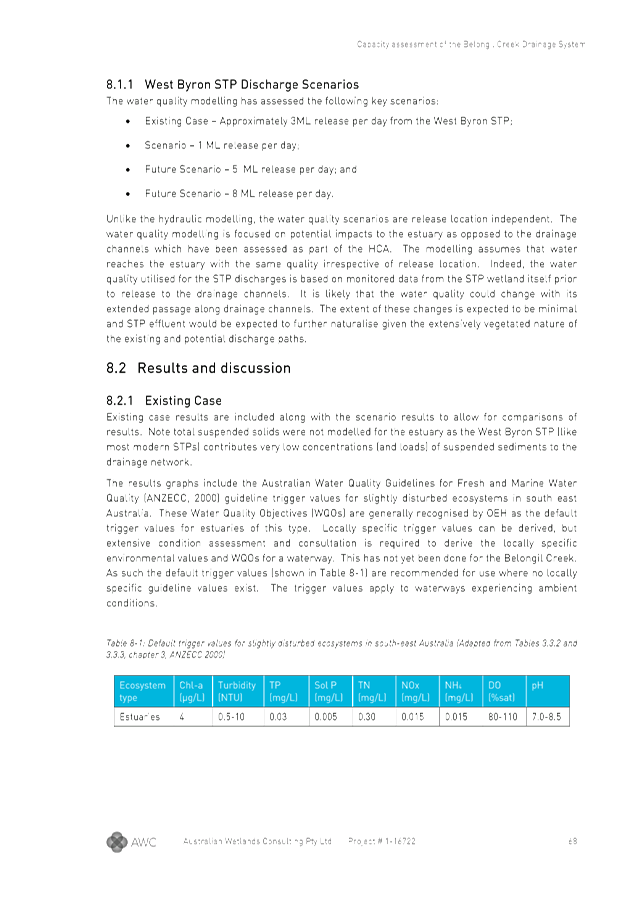
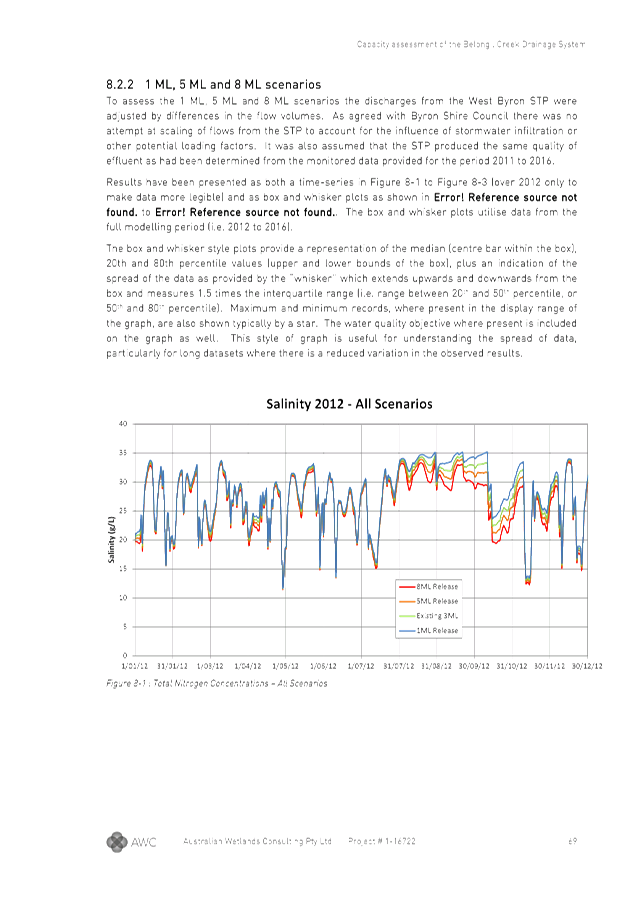
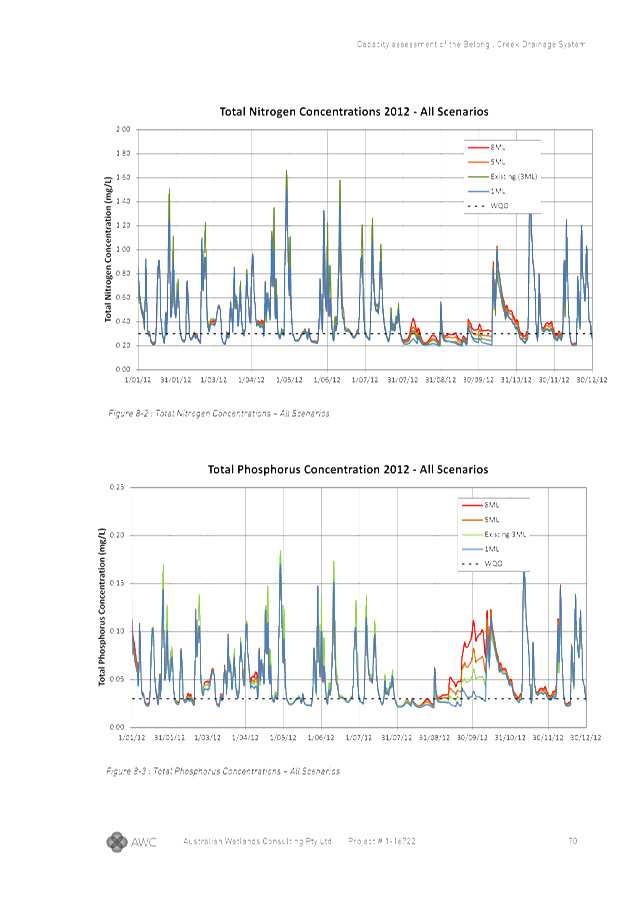
Staff Reports - Infrastructure Services 4.10 - Attachment 1
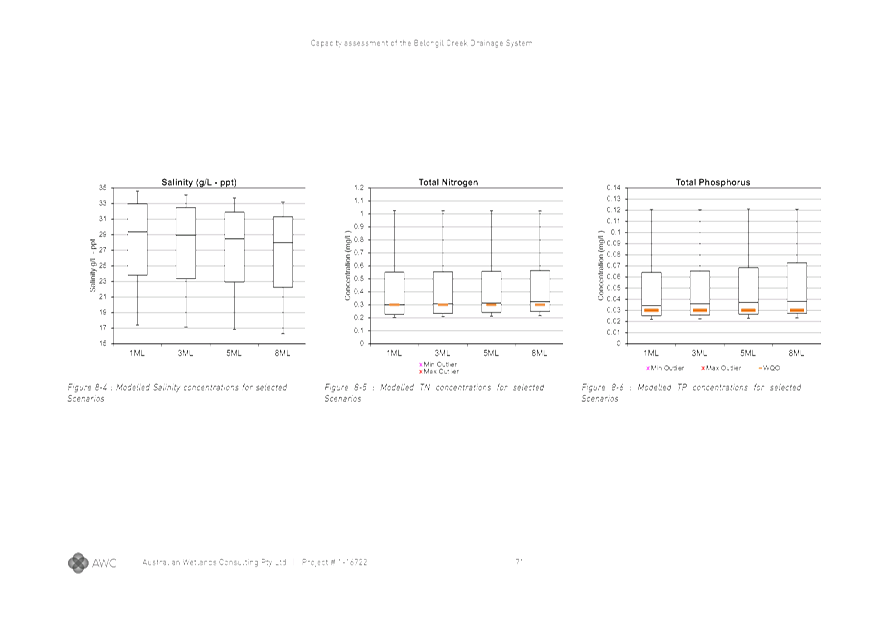
Staff Reports - Infrastructure Services 4.10 - Attachment 1
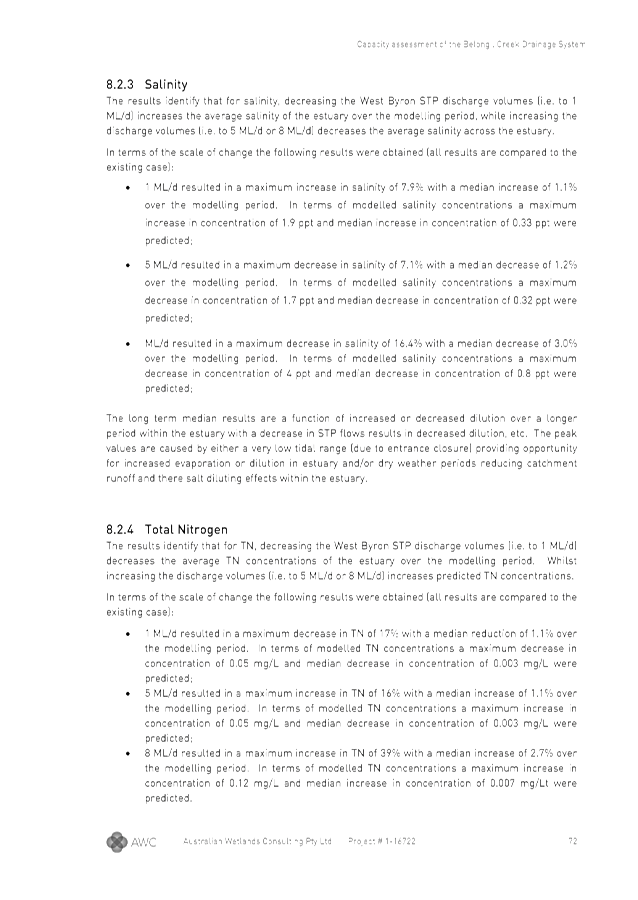
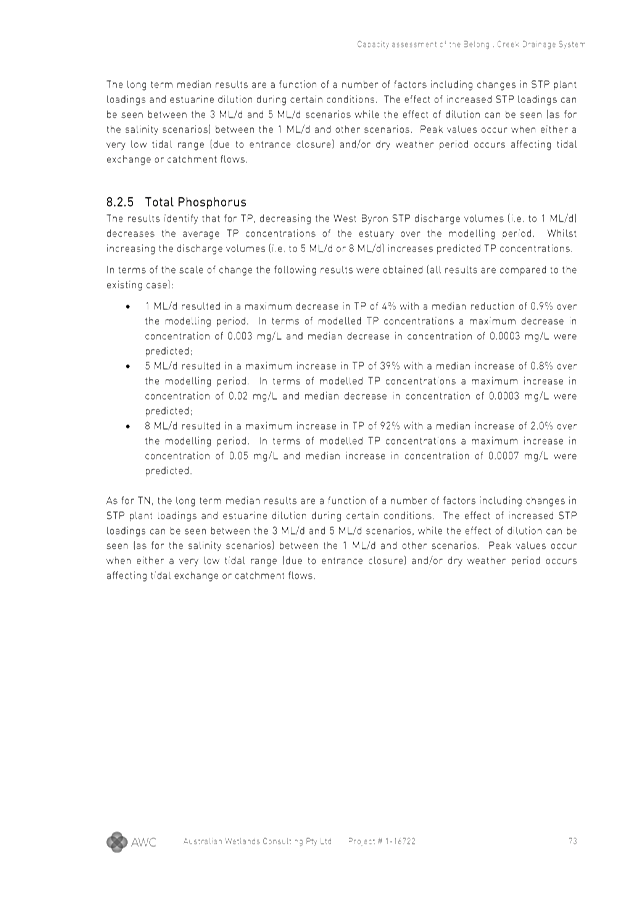
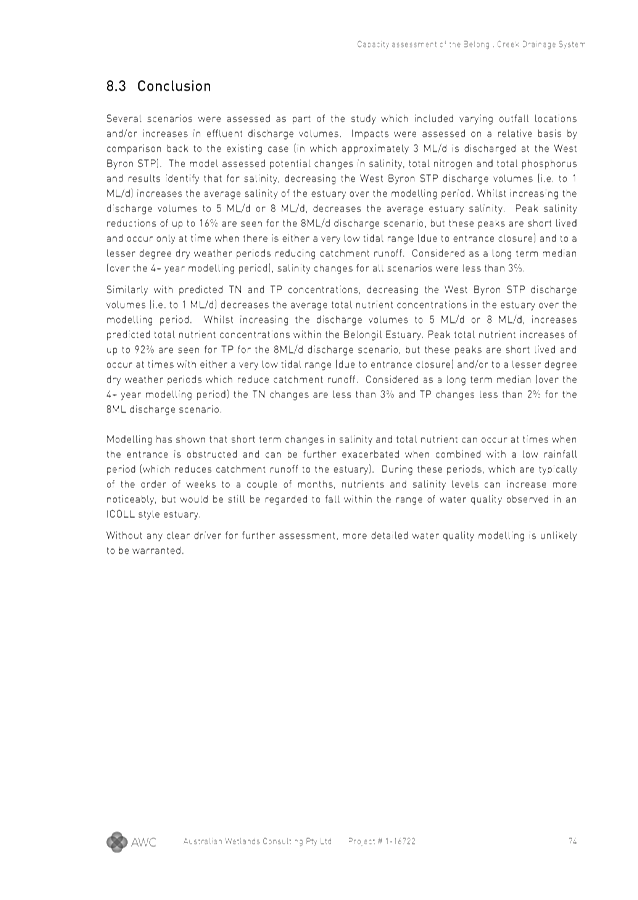
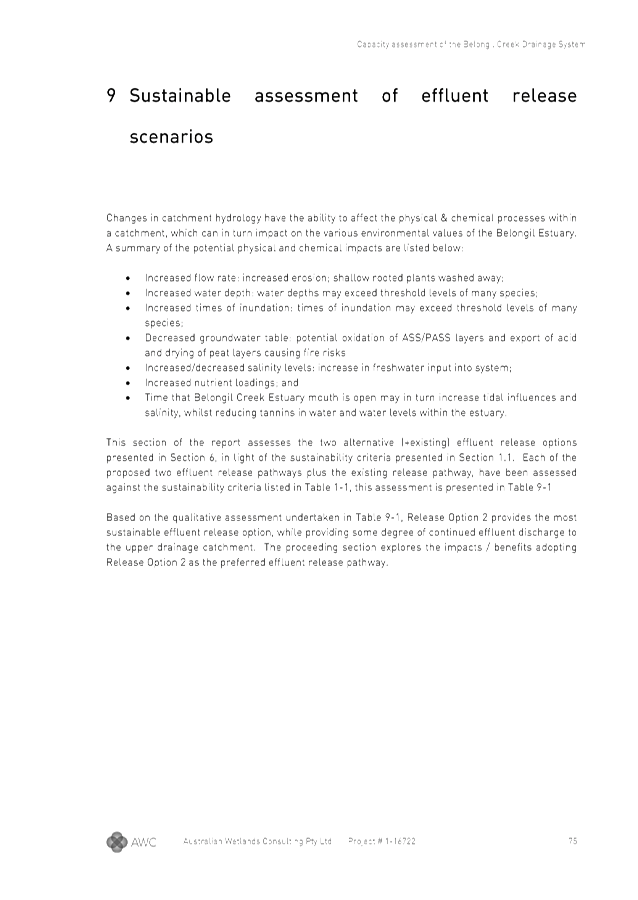
Staff Reports - Infrastructure Services 4.10 - Attachment 1
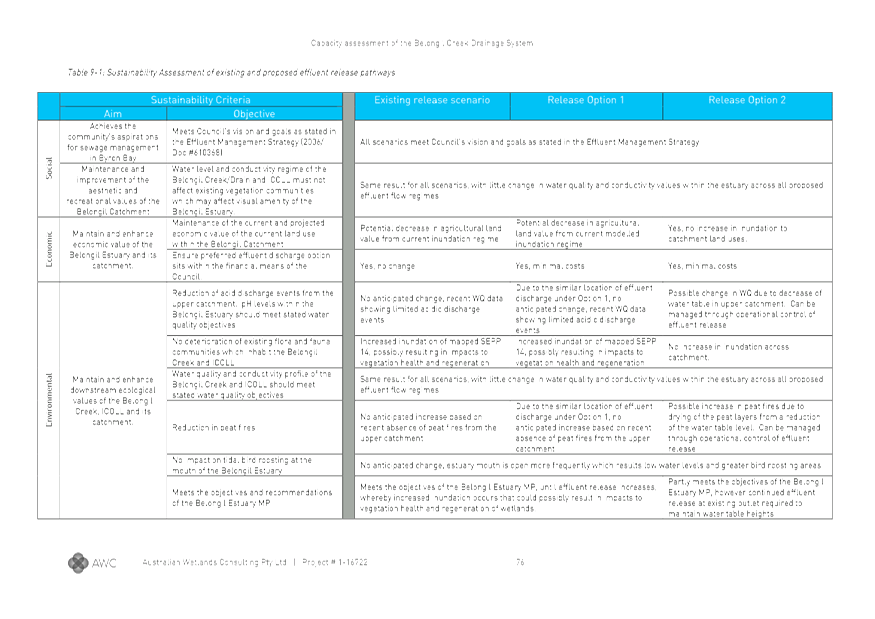
Staff Reports - Infrastructure Services 4.10 - Attachment 1
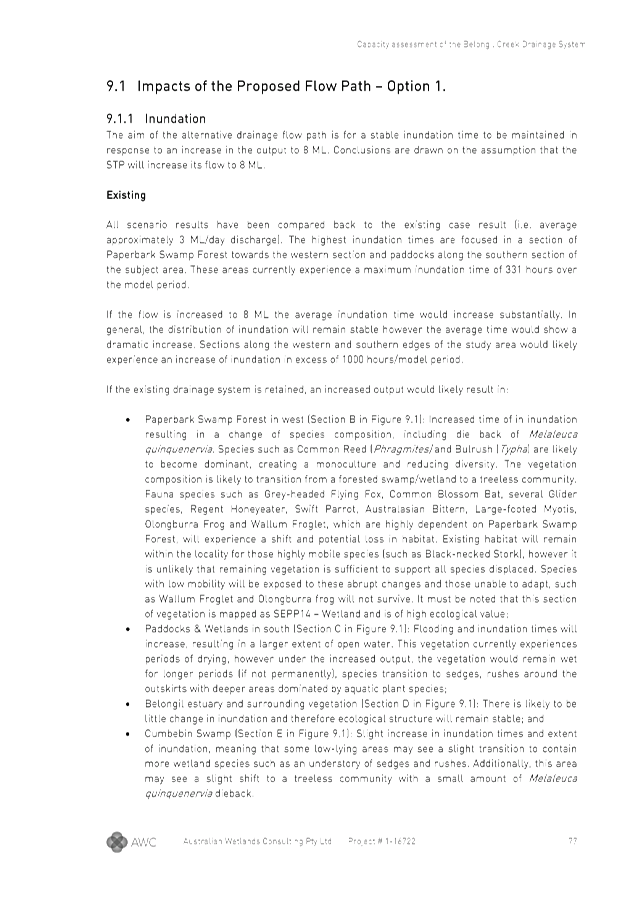
Staff Reports - Infrastructure Services 4.10 - Attachment 1
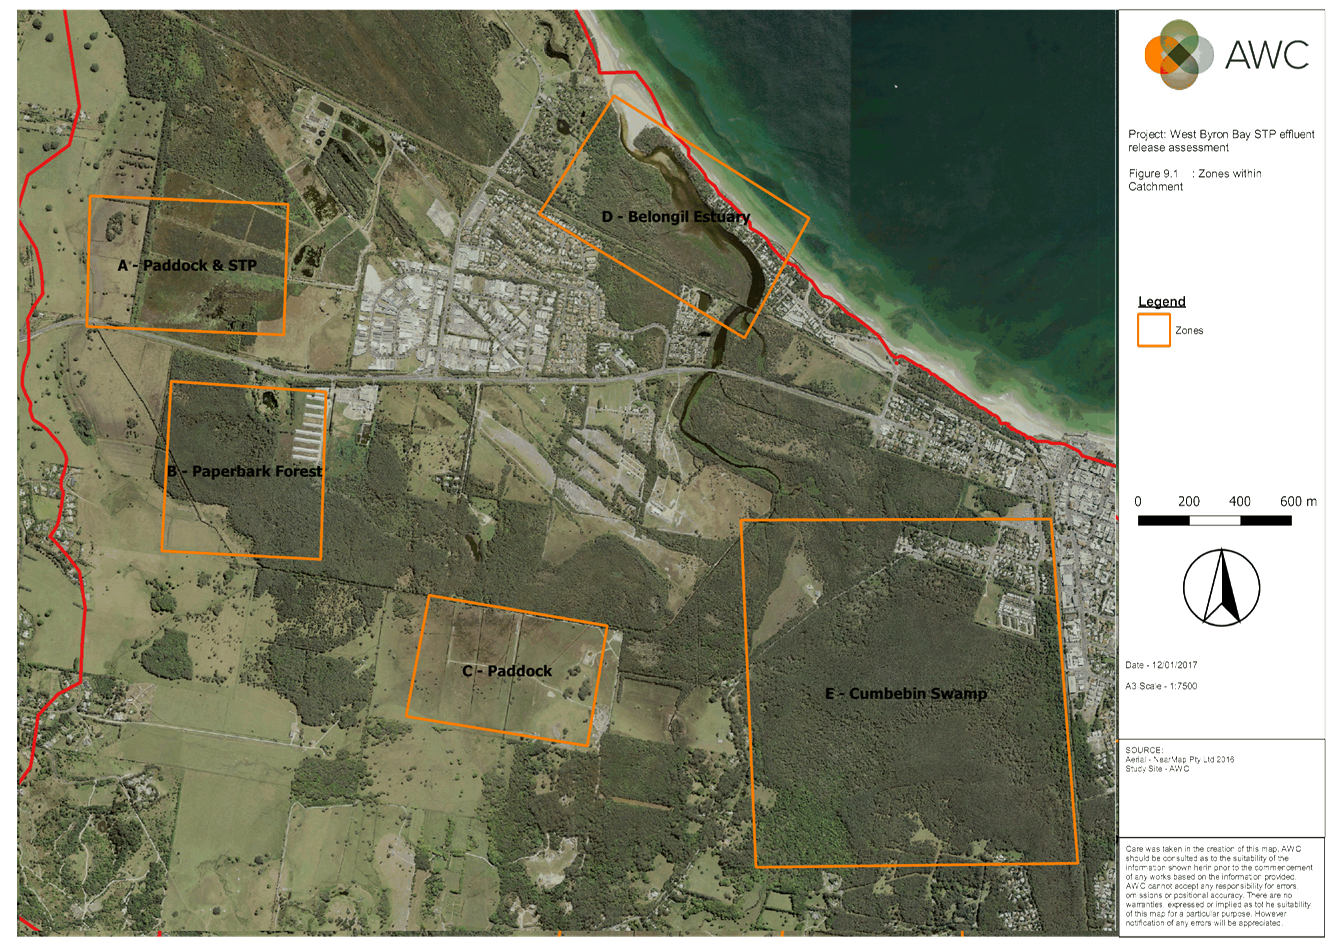
Staff Reports - Infrastructure Services 4.10 - Attachment 1
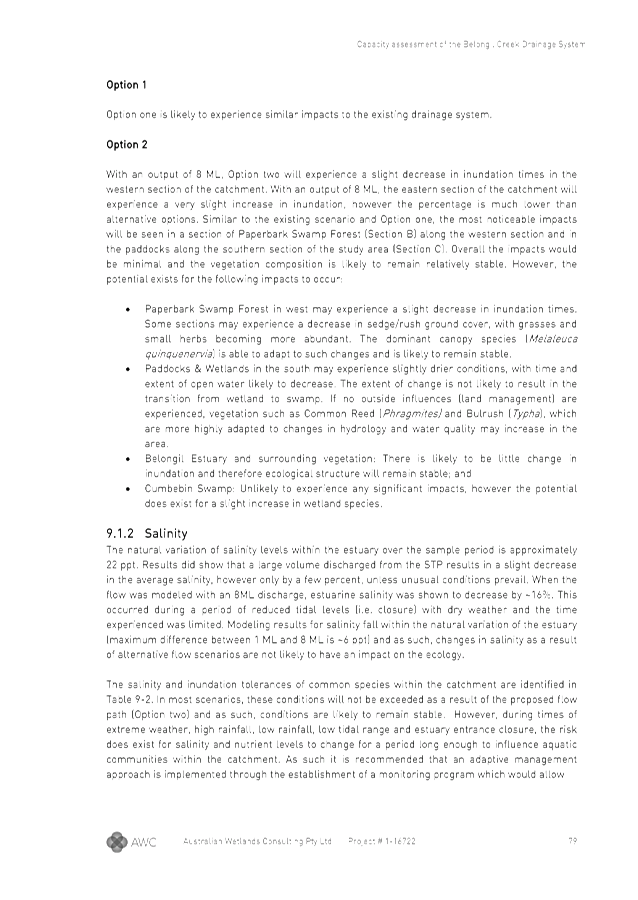
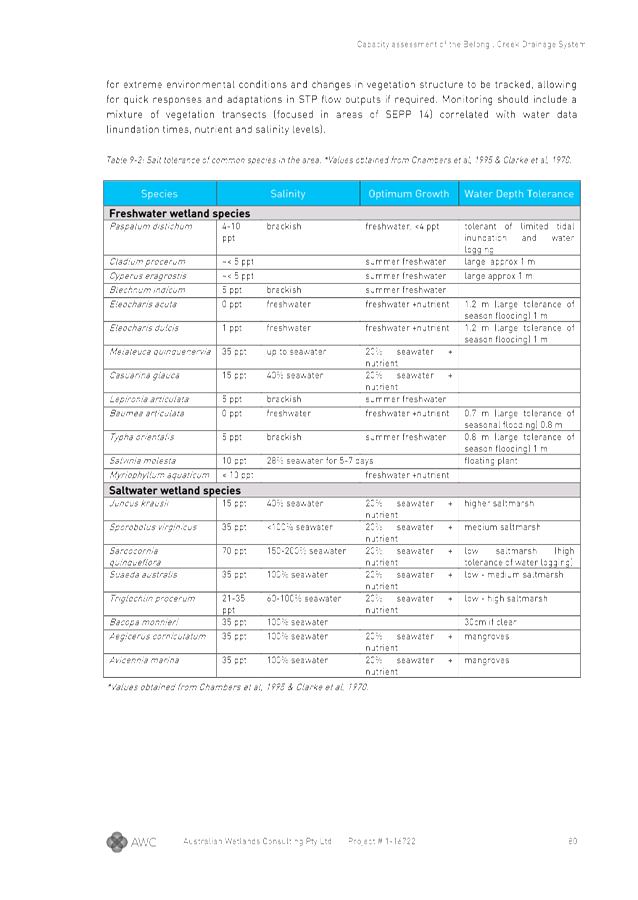
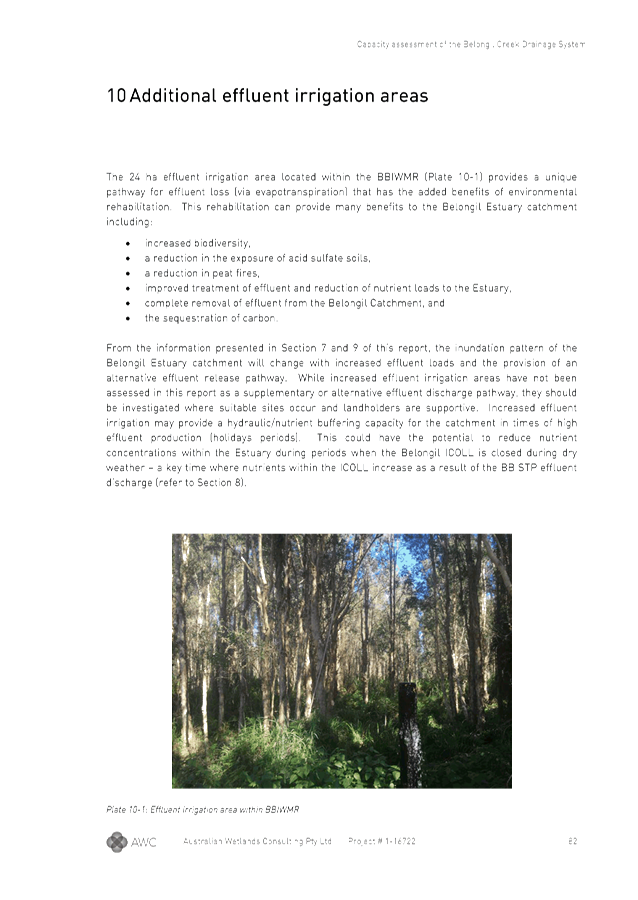
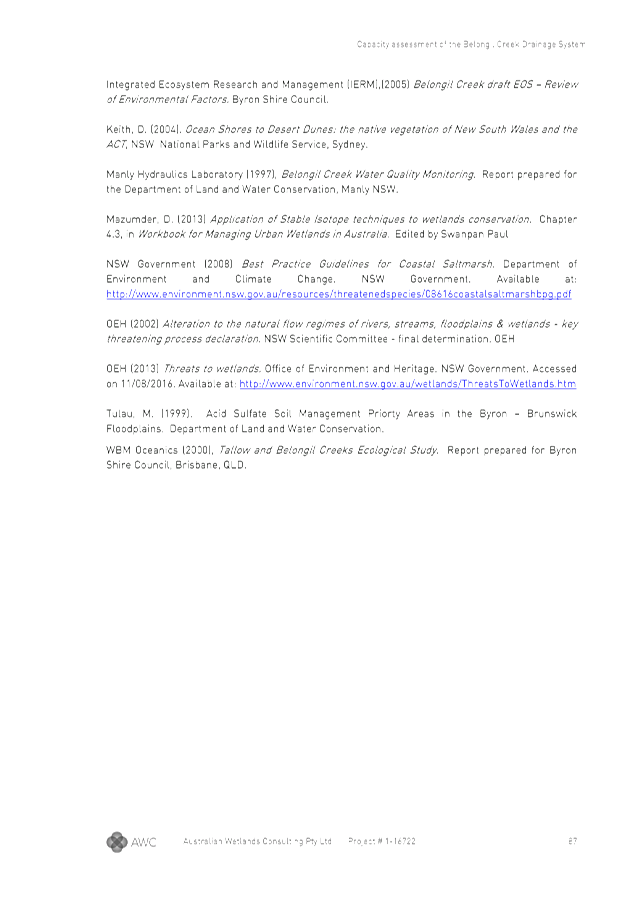

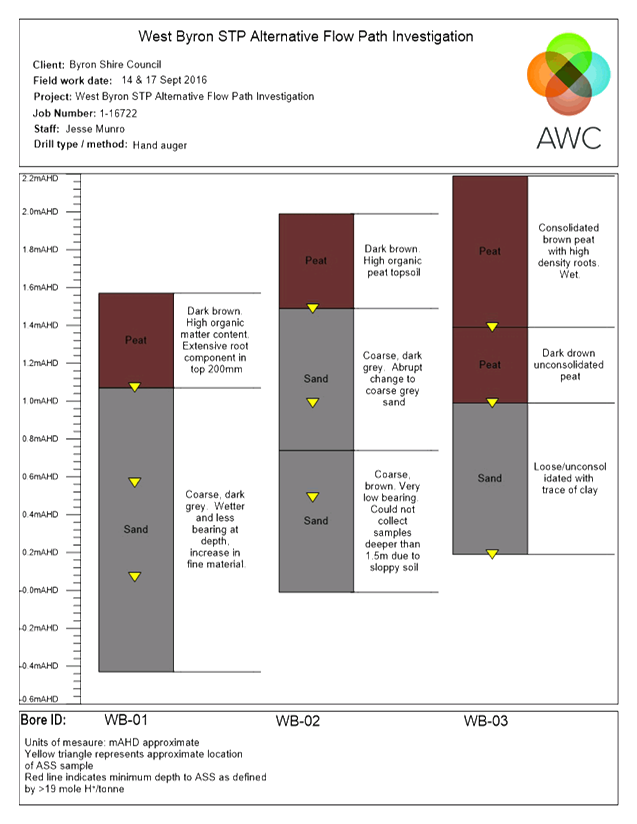
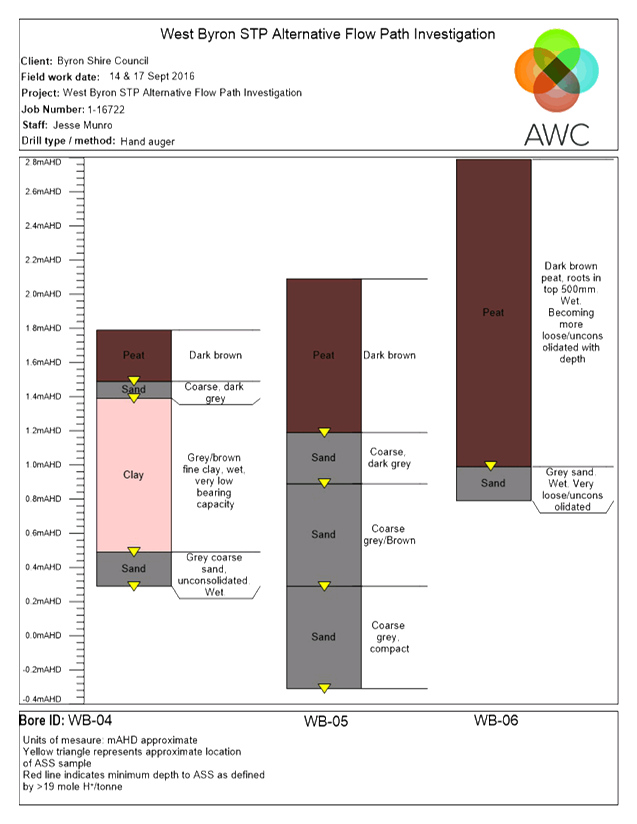
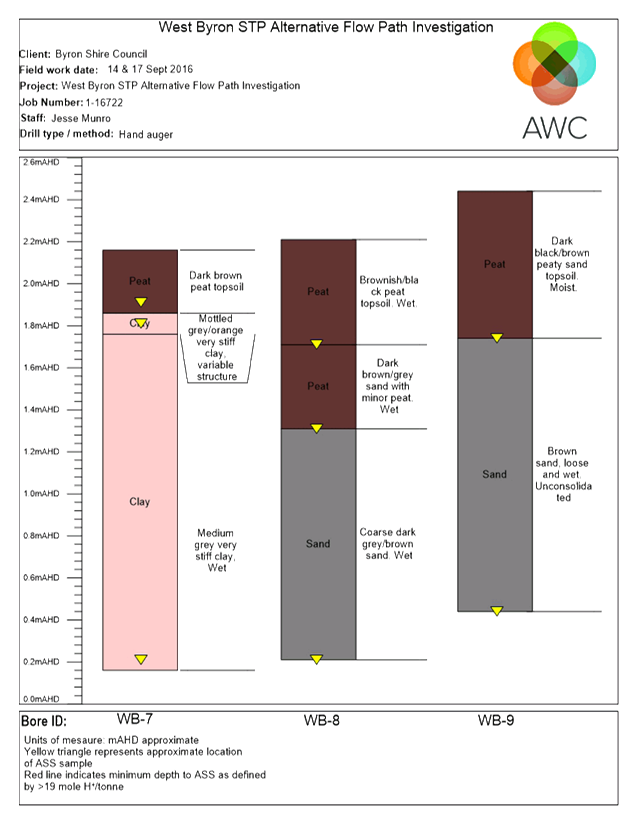

Staff Reports - Infrastructure Services 4.10 - Attachment 1

Staff Reports - Infrastructure Services 4.10 - Attachment 1