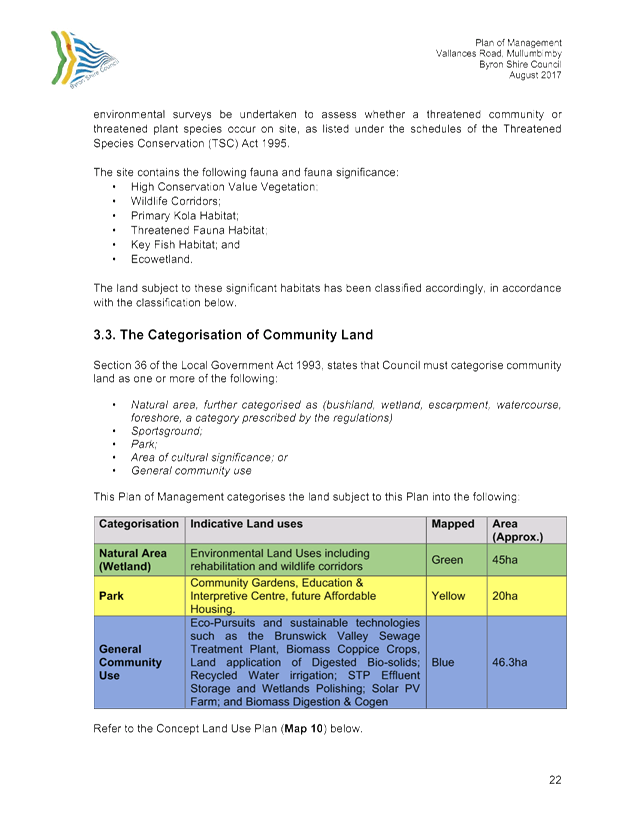
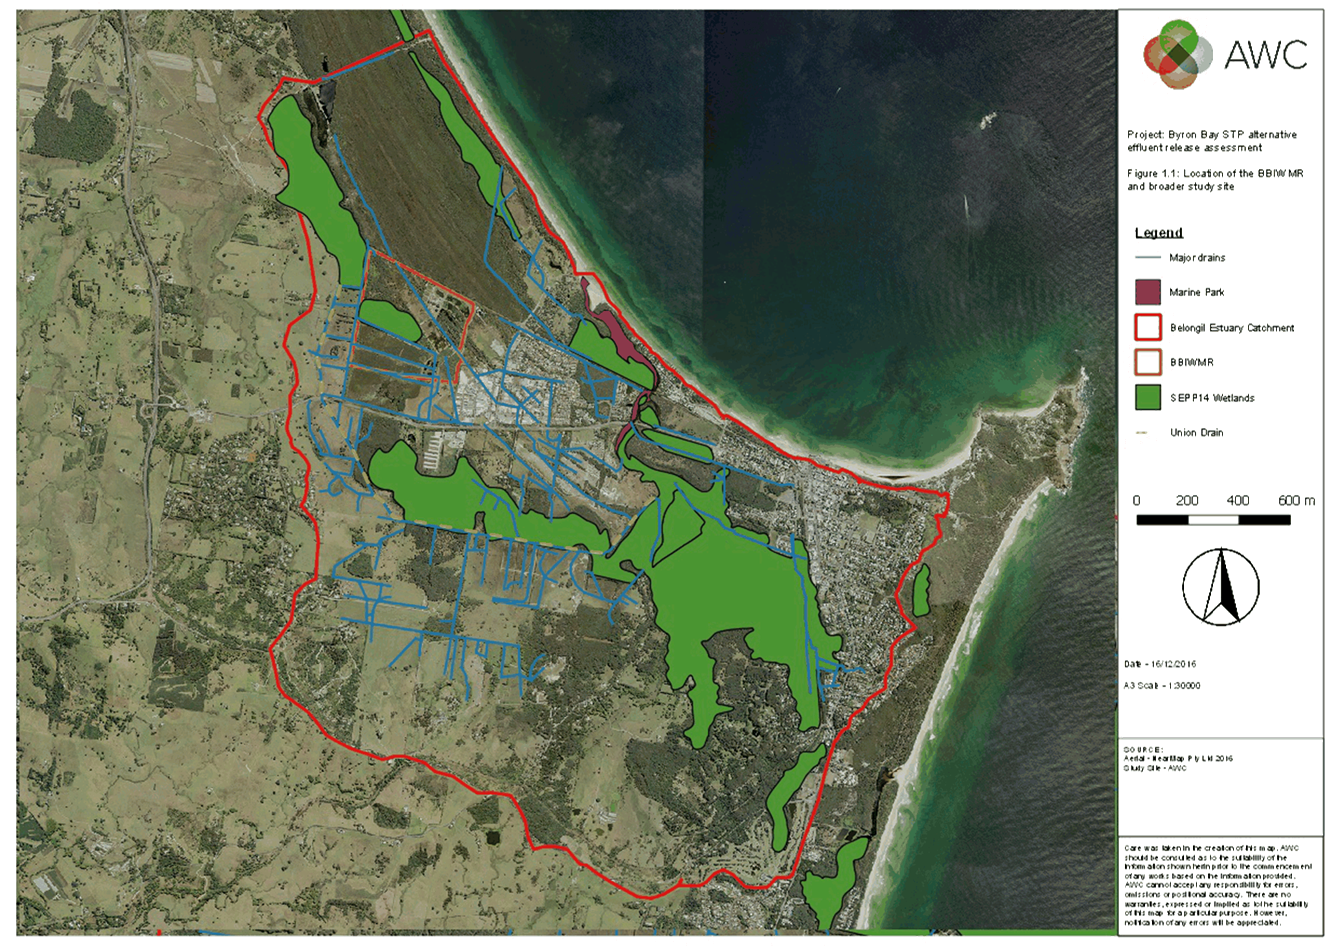
Water, Waste and Sewer Advisory Committee Meeting
A Water, Waste and Sewer Advisory
Committee Meeting of Byron Shire Council will be held as follows:
|
Venue
|
Conference Room, Station Street, Mullumbimby
|
|
Date
|
Tuesday, 10 October 2017
|
|
Time
|
4.00pm
|

Phil Holloway
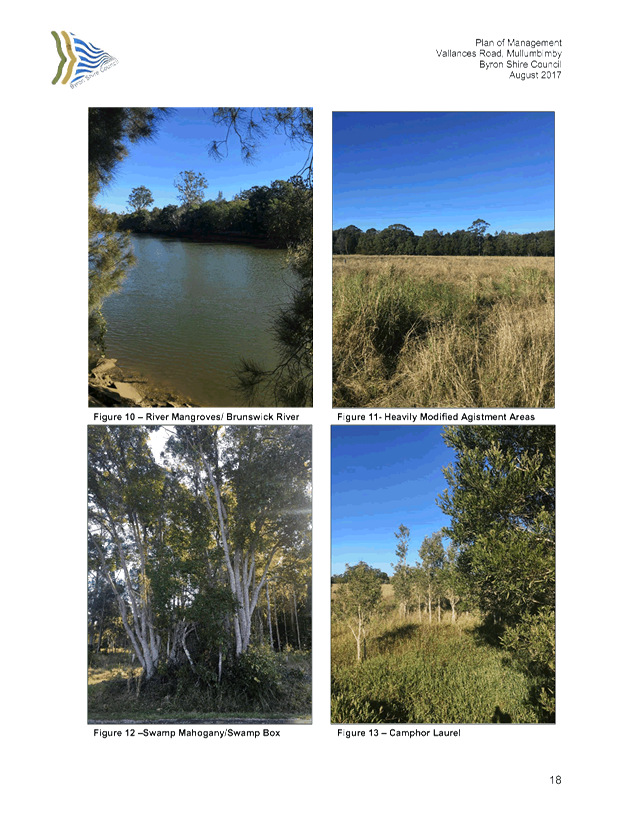
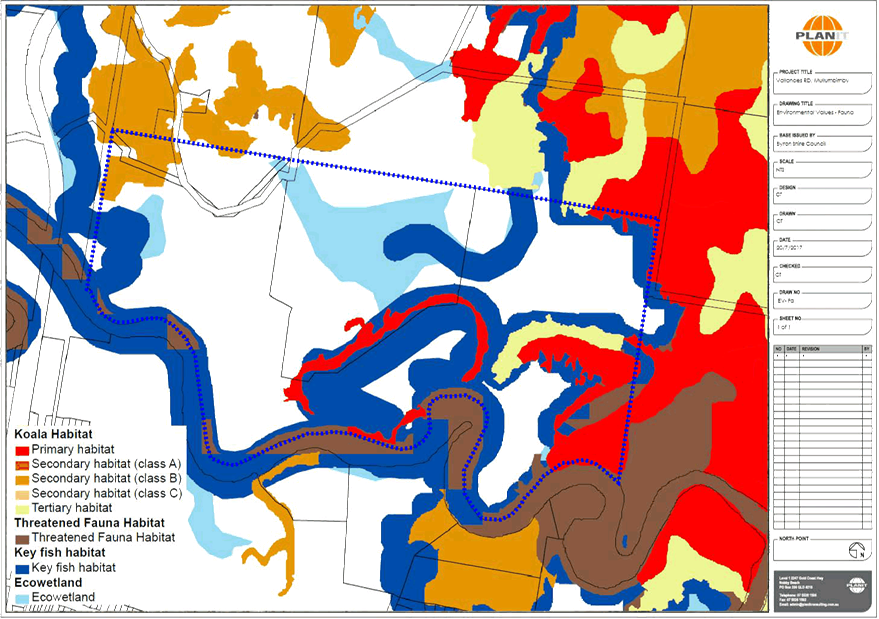
Director Infrastructure Services I2017/1449
Distributed 03/10/17
What is a “Conflict of Interests” - A conflict of
interests can be of two types:
Pecuniary - an interest that a person has in a matter because of a reasonable
likelihood or expectation of appreciable financial gain or loss to the person
or another person with whom the person is associated.
Non-pecuniary – a private or personal interest that a Council
official has that does not amount to a pecuniary interest as defined in the
Local Government Act (eg. A friendship, membership of an association, society
or trade union or involvement or interest in an activity and may include an
interest of a financial nature).
Remoteness – a person does not have a pecuniary interest in a matter
if the interest is so remote or insignificant that it could not reasonably be
regarded as likely to influence any decision the person might make in relation
to a matter or if the interest is of a kind specified in Section 448 of the
Local Government Act.
Who has a Pecuniary Interest? - a person has a pecuniary interest in a
matter if the pecuniary interest is the interest of the person, or another
person with whom the person is associated (see below).
Relatives, Partners - a person is taken to have a pecuniary interest in a
matter if:
§ The person’s
spouse or de facto partner or a relative of the person has a pecuniary interest
in the matter, or
§ The person, or a
nominee, partners or employer of the person, is a member of a company or other
body that has a pecuniary interest in the matter.
N.B. “Relative”, in relation to a person means any of the
following:
(a) the
parent, grandparent, brother, sister, uncle, aunt, nephew, niece, lineal
descends or adopted child of the person or of the person’s spouse;
(b) the
spouse or de facto partners of the person or of a person referred to in
paragraph (a)
No Interest in the Matter - however, a person is not taken to have a
pecuniary interest in a matter:
§ If the person is
unaware of the relevant pecuniary interest of the spouse, de facto partner,
relative or company or other body, or
§ Just because the
person is a member of, or is employed by, the Council.
§ Just because the
person is a member of, or a delegate of the Council to, a company or other body
that has a pecuniary interest in the matter provided that the person has no
beneficial interest in any shares of the company or body.
Disclosure and participation in meetings
§ A Councillor or a
member of a Council Committee who has a pecuniary interest in any matter with
which the Council is concerned and who is present at a meeting of the Council
or Committee at which the matter is being considered must disclose the nature
of the interest to the meeting as soon as practicable.
§ The Councillor or
member must not be present at, or in sight of, the meeting of the Council or
Committee:
(a) at any
time during which the matter is being considered or discussed by the Council or
Committee, or
(b) at any
time during which the Council or Committee is voting on any question in
relation to the matter.
No Knowledge - a person does not breach this Clause if the person did
not know and could not reasonably be expected to have known that the matter
under consideration at the meeting was a matter in which he or she had a
pecuniary interest.
Participation in Meetings Despite Pecuniary Interest (S 452 Act)
A Councillor is not prevented from taking part in the consideration or
discussion of, or from voting on, any of the matters/questions detailed in
Section 452 of the Local Government Act.
Non-pecuniary Interests - Must be disclosed in meetings.
There are a broad range of options available for managing conflicts &
the option chosen will depend on an assessment of the circumstances of the
matter, the nature of the interest and the significance of the issue being
dealt with. Non-pecuniary conflicts of interests must be dealt with in at
least one of the following ways:
§ It may be appropriate
that no action be taken where the potential for conflict is minimal.
However, Councillors should consider providing an explanation of why they
consider a conflict does not exist.
§ Limit involvement if
practical (eg. Participate in discussion but not in decision making or
vice-versa). Care needs to be taken when exercising this option.
§ Remove the source of
the conflict (eg. Relinquishing or divesting the personal interest that creates
the conflict)
§ Have no involvement by
absenting yourself from and not taking part in any debate or voting on the
issue as if the provisions in S451 of the Local Government Act apply
(particularly if you have a significant non-pecuniary interest)
RECORDING OF VOTING ON PLANNING MATTERS
Clause 375A of the Local Government Act 1993
– Recording of voting on planning matters
(1) In this section, planning
decision means a decision made in the exercise of a function of a council
under the Environmental Planning and Assessment Act 1979:
(a) including a decision
relating to a development application, an environmental planning instrument, a
development control plan or a development contribution plan under that Act, but
(b) not including the making of
an order under Division 2A of Part 6 of that Act.
(2) The general manager is
required to keep a register containing, for each planning decision made at a
meeting of the council or a council committee, the names of the councillors who
supported the decision and the names of any councillors who opposed (or are
taken to have opposed) the decision.
(3) For the purpose of maintaining
the register, a division is required to be called whenever a motion for a
planning decision is put at a meeting of the council or a council committee.
(4) Each decision recorded in
the register is to be described in the register or identified in a manner that
enables the description to be obtained from another publicly available
document, and is to include the information required by the regulations.
(5) This section extends to a
meeting that is closed to the public.
Water, Waste and Sewer Advisory Committee
Meeting
BUSINESS OF MEETING
1. Apologies
2. Declarations of Interest
– Pecuniary and Non-Pecuniary
3. Adoption of Minutes from
Previous Meetings
3.1 Water,
Waste and Sewer Advisory Committee Meeting held on 14 September 2017
4. Staff Reports
Infrastructure Services
4.1 State
Government Water and Sewerage Performance Reports..................................... 4
4.2 Byron
Shire Effluent Management Strategy (Draft)....................................................... 18
4.3 Vallances
Road Plan of Management............................................................................ 41
4.4 Update
on the review of Council's Integrated Waste Management and Resource Recovery Strategy......................................................................................................................................... 98
4.5 Response
to Alan Dickens Questions........................................................................... 105
4.6 Items
For the Committee Requested by Duncan Dey................................................. 133
Staff Reports - Infrastructure Services 4.1
Staff Reports - Infrastructure Services
Report No. 4.1 State
Government Water and Sewerage Performance Reports
Directorate: Infrastructure
Services
Report
Author: Peter
Rees, Manager Utilities
File No: I2017/1234
Theme: Community Infrastructure
Water Supplies
Summary:
The attached documents are the Department of Primary
Industries (Water) triple bottom line Performance Report for Byron Shire
Council’s Water and Sewerage operations in 2015-16. This report is
prepared by the DPI Water for all Local Government water and sewerage
authorities. It is prepared from data submitted by Councils through
financial special schedules and operational data annual submissions.
The Best Practice Guidelines and performance reports have
proved to be valuable tools for assessing the performance of the Water Supply
and Sewerage operations. The performance reports provide a benchmark tool
for setting operational targets and continuously improving performance.
Water and Sewerage operations have embedded the key KPIs in monthly management
reports. This has streamlined the data collating and analysis process and
provided significant benefits to the overall performance of the group.
It forms part of the National Water Initiative of the
Federal Government for Water Utilities with greater than 10,000 assessments.
|
RECOMMENDATION:
That the Water Waste and Sewer Advisory Committee note
the continuing improving performance in both cost and service delivery for
the Water and Sewer services.
|
Attachments:
1 Water
Supply TBL 2015-16 BYRON, E2017/82391
, page 10⇩ 
2 Water
Supply Action Plan 2015-16 - Byron Shire Council, E2017/82390 , page 12⇩ 
3 SewerageTBL
2015-16 BYRON, E2017/82389 , page 15⇩
4 Sewerage
Action Plan 2015-16 - Byron Shire Council, E2017/82388
, page 17⇩ 
Report
The NSW Best Practice Management Guidelines for Water Supply
and Sewerage were developed to encourage effective and efficient delivery of
water supply and sewerage services. The guidelines set out six criteria
for achievement of best practice management. Byron Shire Council has
conducted audits and achieved compliance with all of the best practice
guidelines for both Water and Sewerage.
It should be noted however, to continue to achieve BPM
Council needs to prepare a new 30 year Integrated Water Cycle Management
Strategy. Utilities has commenced this process and expect to finalise a
draft early in the new year.
Performance reporting is one of the best practice
criteria. The data submitted covers the triple bottom line concept of
performance measurement. The triple bottom line concepts are economic,
environmental and social. One key element of the compilation of the
performance report is the collection of accurate data. The water and
sewerage business has, over the past fifteen years, progressively implemented
systems to enable the accurate and timely collection of the required
data. The businesses utilize this performance data to produce monthly
production reports that measure the performance of the operations.
The Best Practice Guidelines and performance reports have
proved to be valuable tools for assessing the performance of the Water Supply
and Sewerage operations. The performance reports provide a benchmark tool
for setting operational targets and continuously improving performance. Water
and Sewerage operations have embedded the key KPIs in monthly management
reports. This has streamlined the data collating and analysis process and
provided significant benefits to the overall performance of the group.
The performance data for 2015-16 was submitted to DPI Water
in the time frames required. Copies of the Water Supply and Sewerage 2015-16
Performance Reports are included as attachments to this report. Also included
in the report this year are recommended action plans as a result of the
reported data.
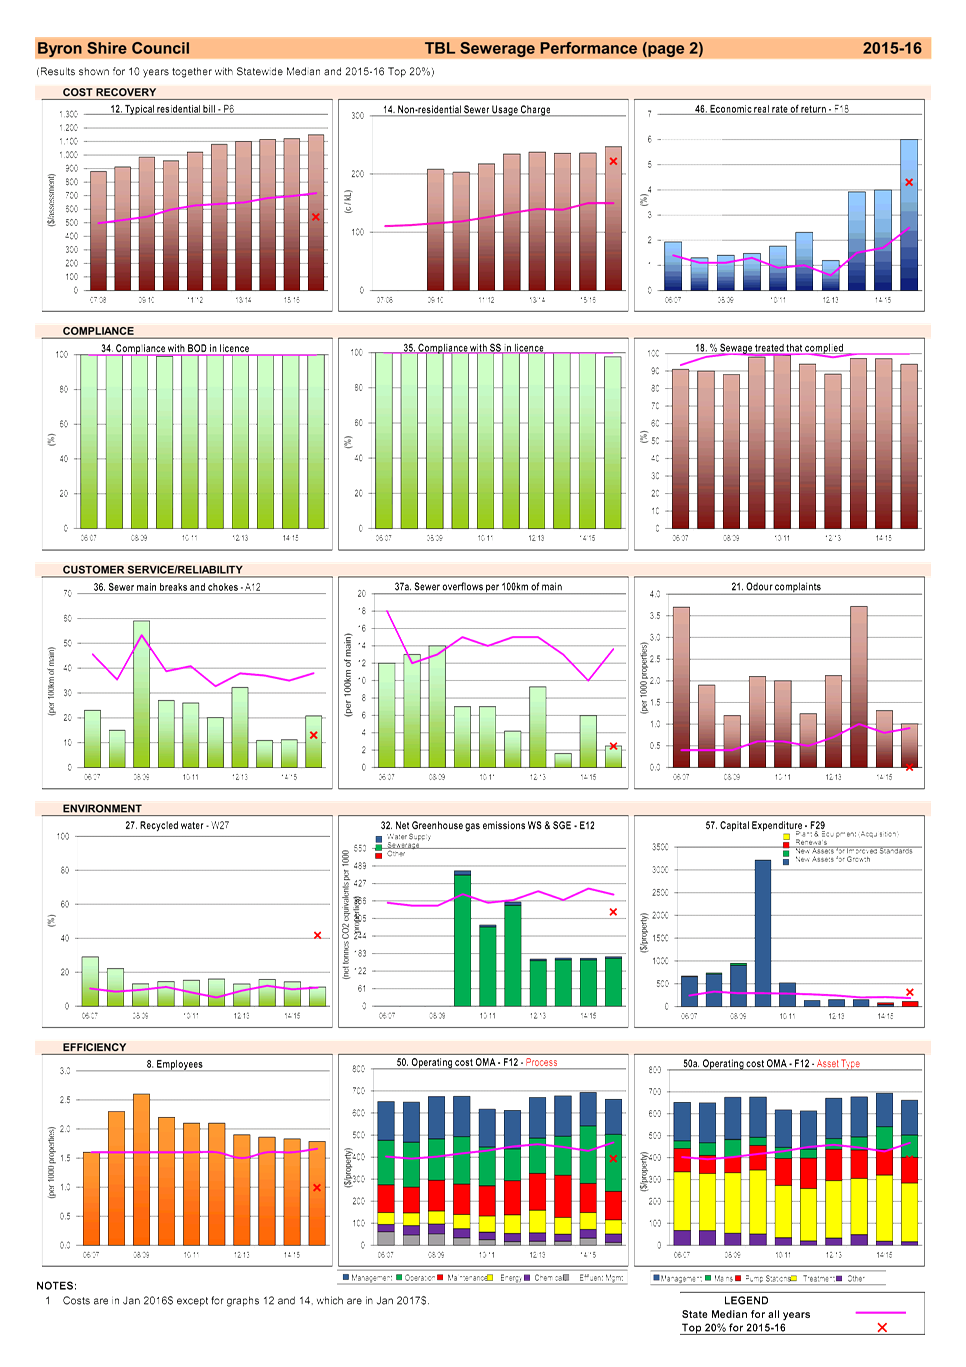
Characteristics
A significant indicator in this group is the number of
employees per 1000 properties. Byron Shire has a slightly higher than average
result for sewerage operations with 1.8 employees per 1000 properties, whereas
water operations has a lower than average with 0.8 employees per 1000
properties. In Byron Shire however, there is a high degree of multi skilling
with many employees working across both areas of operation. If the groups are
combined there are a total of 2.6 employees per 1000 properties compared to the
state median of 3.2.
A key characteristic of Byron Shire’s water and
sewerage employee profile is the high proportion of staff in the field versus
staff in the office (Engineers and Managers). In the operations section we have
29 field staff and 4 office based staff; with 10% of the field staff being
apprentices and trainees.
Social – Charges & Bills
Byron Shire has been rated as satisfactory to very good in
all Social – Charges performance indicators. The typical residential bill
for water is less than the state median. The typical residential bill for
sewerage remains significantly higher but the gap will close over the coming
years.
Social – Health
Byron Shire’s social – health performance
remains in the highest performance percentile for all the water
indicators. For sewerage the ratings were satisfactory to very good.
Social – Levels of Service
Byron Shire continues to achieve excellent results in both
the water and sewerage key indicators of customer service. For water the result
0 complaints per 1000 properties versus a state median of 3. For sewerage the
result was 1 versus a state median of 0.9. For water supply, quality
performance still outperforms the state median with only 1.0 complaint per 1000
properties versus 3 across the state.
One area of concern that continues to require monitoring is
odour complaints in the sewerage performance. Council’s result has
improved in recent years from 2.1 to 1.0 complaints per 1000 properties
compared to a state median of 0.9. These complaints are associated with
sewer pump stations. Council has several pump stations located in heavily
populated areas. Odour control devices have been installed on all of
these sites however more work is required.
Environmental
Water – The “Average Annual Residential Water
Consumption” for coastal LWUs indicator has fallen to 169
kL/property. The Real Losses/ Leakage indicator curiously however, has increased
from 50 litres/service connection/day to 90. This data requires more analysis.
Sewer – The key sewer environmental performance was
positive with most key indicators being rated as good to very good. Compliance
with Suspended Solids in EPA licences was highlighted as “may require
review”. This result was entirely attributable to the aging Ocean Shores
STP. Council has prepared a process review and has commenced the project to
either upgrade this facility – which would require a total rebuild
– or transfer to the new Brunswick Valley STP.
The latter option has the potential to reduce the whole of
life NPV of the required Ocean Shores STP upgrade project by approximately
$12.6 million as well as allowing the construction of the originally proposed
wetlands and effluent storage ponds for the Brunswick Valley Sewage Augmentation
scheme. Council is progressing the project and has resolved to undertake a Risk
Assessment analysis of the transfer option. This work is in progress.
Another indicator that has reduced in relative terms is the
percentage of effluent recycled. This has fallen from 14% in 2014-15 to 11% in
2015-16. This is due to one of the two farmers utilising the Main Arm scheme
not using water and the maturation of both the Byron bay 24 Hectare Melaleuca
and the Bangalow Bamboo plantations reducing the volume of water required.
It should be noted however, these figures do not include the
water recycled in Councils 27 hectares of wetlands at Byron Bay and Ocean
Shores. It is estimated that approximately 300 megalitres per annum of
recycled water is utilised by these schemes. This usage has not been reported
– an oversight that will be corrected in the current year reporting. If
this figure is included, Council’s percentage of effluent recycled would
increase to approximately 20%.
Economic
Water – The water fund is free from debt and is
forecast to be cash positive for the foreseeable future with significant levels
of cash to be generated that will provide flexibility when considering capital
projects such as the Mullumbimby Water Treatment Plant upgrade.
The water economic efficiency was excellent with all the key
measures (Management, Treatment, and Water Mains) at less than the State median
cost. The break up of the total Operations and Maintenance Cost per property is
Rous Bulk Water $211
Management $137
Operations $89
Maintenance
$30
Chemicals $5
Clearly the largest cost source is Rous Water which has been
the sole driver of the increase in this cost indicator over the past 10 years.
During this time O&M and Management costs controlled by Council have
actually decreased.
Sewer – The sewer financial economic performance
achieved significant improvement this year with loan repayments dropping from
$489 to $347 per property; return on assets increasing to 3.6% (up from 1.6%)
and the Economic Real Rate of Return increasing from 4% to 6% this year. This
is due in part to rationalising of the loan portfolio and active management of
the financial assets by Council’s Finance Manager.
The Sewer Fund still has a large outstanding debt due to the
$80 million capital upgrade programme completed in 2011. The recently
completed Strategic Business Plan indicates the Sewer Fund could become debt
free by 2021. As with the Water Fund this will provide flexibility when
planning for the next round of major capital works of the Ocean Shores STP
upgrade (2020) and the Byron Bay STP upgrade (2025).
One issue that needs to be considered is the rehabilitation
of the decommissioned sewage treatment plant sites at South Byron, Brunswick
Heads and Mullumbimby. It has always been assumed these would be revenue
neutral. This currently does not look like being achieved and will need
to be factored into future planning although it is not expected to have a
material impact.
The sewer economic efficiency has also demonstrated
significant improvement with the all key indicators either static or
falling. The operating cost per property / per 100 km of main / per
kilolitre all fell this year and continue to show a 10 year downward
trend. The graph of the OMA over the past 10 years clearly demonstrates
Council has held costs static over this time which represents a real reduction
after inflation.
This compares favourably to the state situation where
overall costs have been increasing and has been achieved without compromising
the outputs of lower overflows, improved odour complaints, higher safety
standards and higher standards of sewage treatment. It is expected Council will
achieve a quantum reduction in OMA if the aging Ocean Shores treatment plant is
closed and transferred to the new Brunswick Valley facility.
This overall financial health is due to the economic
efficiency of the day to day operations and the efficient execution of the
major capital projects. Council recently commissioned 2 new reservoirs
(Cooper Shoot and Bangalow) which were both completed within the forecast
budget of $5 million. This reflects the active approach to overall cost control
in the Water and Sewer Services.
Financial Implications
The continued good performance in the water and sewerage operations
is contributing to the overall health of the water and sewerage funds. This
provides Council with the financial capacity to implement community aspirations
in these areas.
Statutory and Policy Compliance Implications
It is a requirement of the NSW DPI Water Best Practice
Management Guidelines that these performance reports are reported to Council.
Staff Reports - Infrastructure Services 4.1 - Attachment 1
Staff Reports - Infrastructure Services 4.1 - Attachment 2
WS Action Plan 2015-16 - Byron Shire
Council
Byron Shire Council Water Supply – Action Plan Page 1
|
|
Summary
In 2015-16, Byron Shire Council implemented all the water supply outcomes
required by the NSW Best-Practice Management Framework and its
performance has been [to be completed by Council].
Key actions from Council's Strategic
Business Plan:
- Insert achievements for Key Action 1 here for Byron
Shire Council
- Insert achievements for Key Action 2 here for Byron
Shire Council
|
|
|
|
INDICATOR
|
RESULT2
|
COMMENT/DRIVERS
|
ACTION
|
|
|
Best-Practice
Management Framework
|
Implemented all the
Best-Practice Required Outcomes1
|
Very good
|
Implementation
demonstrates effectiveness and sustainability of water supply business. 100%
implementation is required for eligibility to pay an ‘efficiency
dividend’.
|
Prepare a new 30-year
IWCM Strategy, Financial Plan and Report in accordance with the July 2014
IWCM Check List (www.water.nsw.gov.au).
|
|
CHARACTERISTICS
|
|
5
|
Connected property
density
|
43 per km of main
|
|
A connected property
density below 30 can significantly increase the cost per property of
providing services, as will also a high number of small discrete water supply
schemes.
|
|
|
Highest ranking (1, 1)
|
|
9
|
Renewals expenditure
|
2.9%
|
Very good
|
Adequate funds must be
programmed for works outlined in the Asset Management Plan – page 3 of
the 2014-15 NSW Performance Monitoring Report.
|
FOR INDICATORS 9 to 56
Where ranking is low, investigate reasons including past performance and
trends, develop remedial action plan and summarise in this column.
|
|
Highest ranking (1, 1)
|
|
10
|
Employees
|
0.8 per 1,000 props
|
|
|
|
|
Highest ranking (1, 1)
|
|
SOCIAL -
CHARGES
|
|
12
|
Residential water usage
charge
|
247 c/kL
|
Good
|
Benefits of strong
pricing signals are shown on page 5 of the 2014-15 NSW Performance Monitoring
Report.
|
|
|
High ranking (2, 2)
|
|
13
|
Residential access
charges
|
$179 per assessment
|
Good
|
|
See 16.
|
|
Highest ranking (1, 1)
|
|
14
|
Typical residential bill3
(TRB)
|
$596 per assessment
|
Good
|
TRB should be consistent
with projection in the financial plan. Drivers – OMA Management Cost
and Capital Expenditure.
|
See 43.
|
|
High ranking (2, 2)
|
|
15
|
Typical developer charges
|
$3600 per ET
|
|
|
|
|
Low ranking (4, 4)
|
|
16
|
Residential revenue from
usage charges
|
70% of residential bills
|
Satisfactory
|
≥ 75% of
residential revenue should be generated through usage charges.
|
|
|
Median ranking (3, 3)
|
|
SOCIAL –
HEALTH
|
|
19
|
Physical quality
compliance
|
Yes
|
Very good
|
|
|
|
Highest ranking (1, 1)
|
|
19a
|
Chemical quality compliance
|
Yes
|
Very good
|
|
|
|
Highest ranking (1, 1)
|
|
20
|
Microbiological
compliance4
|
Yes
|
Very good
|
Critical indicator. LWUs
should annually review their DWMS in accordance with NSW guidelines4.
|
|
|
Highest ranking (1,
1)
|
1.
Council needs to annually ‘roll forward’, review and update its
30-year total asset management plan (TAMP) and 30-year financial plan, review
Council's TBL Performance
Report and prepare an Action Plan to Council. The Action Plan is to
include any actions identified in Council’s annual review of its DWMS
(Indicator 20) and any section 61 Reports from DPI Water. Refer to pages 21, 98
and 102 of the 2015-16 NSW Water Supply and Sewerage Performance Monitoring
Report.
2. The ranking relative to
similar size LWUs is shown first (Col. 2 of TBL Report) followed by the ranking
relative to all LWUs (Col. 3 of TBL Report).
3. Review and comparison of
the 2016-17 Typical Residential Bill (Indicator 14) with the projection
in the later of your IWCM Strategy and financial
plan and your Strategic Business Plan is mandatory.
In addition, if both indicators 43 and 44 are negative, you
must report your proposed 2017-18 typical residential bill to achieve full cost
recovery.
4.
Microbiological compliance (Indicator 20) is a high priority for
each NSW LWU. Corrective action for non-compliance (≤97%), or any
‘boil water
alerts’ must be reported in your Action Plan.
Refer to pages 5, 6 and 21 of the 2015-16 NSW Water Supply and Sewerage
Performance Monitoring
Report (www.water.nsw.gov.au) and NSW Guidelines for drinking water quality
management systems, NSW Health and NSW Office of Water, 2013.
|
Byron Shire Council Water Supply – Action Plan Page 2
|
|
|
|
INDICATOR
|
RESULT
|
COMMENT/DRIVERS
|
ACTION
|
|
SOCIAL –
LEVELS OF SERVICE
|
|
25
|
Water quality complaints
|
1.4 per 1,000 props
|
Satisfactory
|
Critical indicator of
customer service.
|
|
|
Median ranking (3, 3)
|
|
26
|
Service complaints
|
0 per 1,000 props
|
Very good
|
Key indicator of customer
service.
|
|
|
Highest ranking (1, 1)
|
|
27
|
Average frequency of
unplanned interruptions
|
13 per 1,000 props
|
Good
|
Key indicator of customer
service, condition of network and effectiveness of operation.
|
|
|
High ranking (2, 3)
|
|
30
|
Number of main breaks
|
7 per 100km of main
|
Good
|
Drivers – condition
and age of water mains, ground conditions.
|
|
|
High ranking (2, 2)
|
|
32
|
Total Days Lost
|
0.3%
|
Good
|
|
|
|
High ranking (2, 2)
|
|
ENVIRONMENTAL
|
|
33
|
Average annual
residential water supplied
|
169 kL per prop
|
|
Drivers – available
water supply, climate, location (Inland or coastal), pricing signals
(Indicator 3), restrictions.
|
|
|
Median ranking (3, 2)
|
|
34
|
Real losses (leakage)
|
90 L/c/d
|
May require review
|
Loss reduction is
important where an LWU is facing drought water restrictions or the need to
augment its water supply system.
|
|
|
Low ranking (4, 3)
|
|
ECONOMIC
|
|
43
|
Economic Real Rate of
Return (ERRR)
|
3.1%
|
Good
|
Reflects the rate of
return generated from operating activities (excluding interest income and
grants).
An ERRR or ROA of ≥
0% is required for full cost recovery.
|
|
|
High ranking (2, 1)
|
|
44
|
Return on assets (ROA)
|
3.6%
|
|
See 43.
|
|
|
High ranking (2, 2)
|
|
45
|
Net debt to equity
|
11%
|
Good
|
LWUs facing significant
capital investment are encouraged to make greater use of borrowings –
page 13 of the 2014-15 NSW Performance Monitoring Report.
|
|
|
High ranking (2, 1)
|
|
46
|
Interest cover
|
3
|
|
Drivers – in general,
an interest cover > 2 is satisfactory.
|
|
|
Highest ranking (1, 1)
|
|
47
|
Loan payment
|
$0 per prop
|
|
The component of TRB
required to meet debt payments.
Drivers – expenditure on capital works, short term loans.
|
|
|
Low ranking (4, 3)
|
|
49
|
Operating cost (OMA)
|
$471 per prop
|
May require review
|
Prime indicator of the
financial performance of an LWU.
Drivers – development density, level of treatment, management cost,
topography, number of discrete schemes and economies of scale.
|
Review components
carefully to ensure efficient operating
cost.
|
|
Low ranking (4, 2)
|
|
51
|
Management cost
|
$137 per prop
|
Good
|
Typically about 40% of
the OMA.
Drivers – No. of
employees. No. of small discrete water schemes.
|
|
|
High ranking (2, 2)
|
|
52
|
Treatment cost
|
$21 per prop
|
Very good
|
Drivers – type and
quality of water source. Size of treatment works
|
|
|
Highest ranking (1, 1)
|
|
53
|
Pumping cost
|
|
Not reported
|
Drivers –
topography, development density and location of water source.
|
|
|
|
|
55
|
Water main cost
|
$54 per prop
|
Very good
|
Drivers – age and
condition of mains. Ground conditions. Development density.
|
|
|
Highest ranking (1, 1)
|
|
56
|
Capital expenditure
|
$243 per prop
|
Satisfactory
|
An indicator of the level
of investment in the business.
Drivers – age and
condition of assets, asset life cycle and water source.
|
|
|
Median ranking (3, 2)
|
Staff Reports - Infrastructure Services 4.1 - Attachment 3
Staff Reports - Infrastructure Services 4.1 - Attachment 4
SGE Action Plan 2015-16 - Byron Shire
Council
Byron Shire Council Sewerage – Action Plan Page 1
|
|
Summary
In 2015-16, Byron Shire Council implemented all the sewerage outcomes
required by the NSW Best-Practice Management Framework and its
performance has been [to be completed by Council].
Key actions from Council's Strategic
Business Plan:
- Insert achievements for Key Action 1 here for Byron
Shire Council
- Insert achievements for Key Action 2 here for Byron
Shire Council
|
|
|
|
INDICATOR
|
RESULT2
|
COMMENT/DRIVERS
|
ACTION
|
|
|
Best-Practice
Management Framework
|
Implemented all the Best
Practice Required Outcomes1
|
Very good
|
Implementation
demonstrates effectiveness and sustainability of water supply and sewerage
business. 100% implementation is required for eligibility to pay an
‘efficiency dividend’.
|
Prepare a new 30-year
IWCM Strategy, Financial Plan and Report in accordance with the July 2014
IWCM Check List (www.water.nsw.gov.au).
|
|
CHARACTERISTICS
|
|
5
|
Connected property
density
|
38 per km of main
|
Similar to the statewide
median of 38
|
A connected property
density below about 30 can significantly increase the cost per property of
providing services.
|
|
|
7
|
Renewals expenditure
|
0.6%
|
Good
|
Adequate funds must be
programmed for works outlined in the Asset Management Plan – page 3 of
the 2014-15 NSW Performance Monitoring Report.
|
FOR INDICATORS 7 to 57
Where ranking is low, investigate reasons including past performance and
trends, develop remedial action plan and summarise in this column.
|
|
High ranking (2, 3)
|
|
8
|
Employees
|
1.8 per 1,000 props
|
Satisfactory
|
|
|
|
Median ranking (3, 3)
|
|
SOCIAL –
CHARGES
|
|
12
|
Typical residential bill3
(TRB)
|
$1149 per assessment
|
|
TRB should be consistent with
projection in the financial plan.
Drivers – OMA
Management Cost and Capital Expenditure.
|
|
|
Lowest ranking (5, 5)
|
|
13
|
Typical Developer Charges
|
$9990 per ET
|
Good
|
|
|
|
Highest ranking (1, 1)
|
|
14
|
Non-residential sewer
usage charge
|
247c/kL
|
Good
|
Similar to OMA cost of
221c/kL.
|
|
|
High ranking (2, 1)
|
|
SOCIAL - HEALTH
|
|
16
|
Sewerage coverage
|
99.6%
|
Very good
|
|
|
|
Highest ranking (1, 1)
|
|
17
|
Percent sewage treated to
tertiary level
|
100%
|
Good
|
|
|
|
High ranking (2, 2)
|
|
18
|
Percent of sewage volume
that complied
|
94%
|
Satisfactory
|
Key indicator of
compliance with regulator.
|
|
|
Median ranking (3, 3)
|
|
19
|
Sewage treatment works
compliant at all times
|
1 of 4
|
|
Key indicator of
compliance with regulator.
|
|
|
|
|
SOCIAL –
LEVELS OF SERVICE
|
|
21
|
Odour Complaints
|
1 per 1,000 props
|
May require review
|
Critical indicator of
customer service and operation of treatment works.
|
|
|
Low ranking (4, 4)
|
|
22
|
Service complaints
|
1 per 1,000 props
|
Very good
|
Key indicator of customer
service.
|
|
|
Highest ranking (1, 1)
|
|
23a
|
Average Duration of
Interruption
|
60 minutes
|
Very good
|
Key indicator of customer
service, condition of network and effectiveness of operation.
|
|
|
Highest ranking (1, 1)
|
|
25
|
Total Days Lost
|
0.3%
|
Good
|
|
|
|
High ranking (2, 2)
|
1.
Council needs to annually ‘roll forward’, review and update its
30-year total asset management plan (TAMP) and 30-year financial plan, review
Council's TBL Performance
Report and prepare an Action Plan to Council. The Action Plan is to
include any actions identified in Council’s section 61 Reports from DPI
Water. Refer to pages 21, 98 and 102 of the 2015-16 NSW Water Supply and
Sewerage Performance Monitoring Report.
|
Byron Shire Council Sewerage – Action Plan Page 2
|
|
|
|
INDICATOR
|
RESULT
|
COMMENT/DRIVERS
|
ACTION
|
|
ENVIRONMENTAL
|
|
26
|
Volume of sewage
collected per property
|
299 kL
|
|
Compare sewage collected
to water supplied.
|
|
|
Lowest ranking (5, 5)
|
|
27
|
Percentage effluent
recycled
|
11%
|
Satisfactory
|
Key environmental
indicator.
Drivers – availability of potable water, demand, proximity to
customers, environment.
|
|
|
Median ranking (3, 3)
|
|
28
|
Biosolids reuse
|
100%
|
Very good
|
Key environmental
indicator.
|
|
|
Highest ranking (1, 1)
|
|
32
|
Net Greenhouse gas
emissions (WS & Sge)
|
170 t CO2/1000 props
|
Very good
|
Drivers – gravity
vs pumped networks, topography, extent of treatment.
|
|
|
Highest ranking (1, 1)
|
|
34
|
Compliance with BOD in
licence
|
100%
|
Very good
|
Key indicator of
compliance with regulator requirements.
|
|
|
Highest ranking (1, 1)
|
|
35
|
Compliance with SS in
licence
|
98%
|
May require review
|
Drivers – algae in
maturation ponds, impact of drought.
|
|
|
Lowest ranking (5, 4)
|
|
36
|
Sewer main breaks and
chokes
|
21 per 100km of main
|
Good
|
Drivers – condition
and age of assets, ground conditions.
|
|
|
High ranking (2, 2)
|
|
37a
|
Sewer overflows to the
environment
|
2 per 100km of main
|
Very good
|
Drivers – condition
of assets, wet weather and flooding.
|
|
|
Highest ranking (1, 3)
|
|
39
|
Non-residential
percentage of sewage collected
|
25%
|
|
For non-residential,
compare % of sewage collected to indicator 43
(% of revenue).
|
|
|
Median ranking (3, 2)
|
|
ECONOMIC
|
|
43
|
Non-residential revenue
|
25%
|
Good
|
See 39 above.
|
|
|
High ranking (2, 2)
|
|
46
|
Economic Real Rate of
Return (ERRR)
|
6%
|
Good
|
Reflects the rate of
return generated from operating activities (excluding interest income and
grants).
An ERRR or ROA of ≥
0% is required for full cost recovery.
|
|
|
Highest ranking (1, 1)
|
|
46a
|
Return on assets
|
3.6%
|
|
See 46.
|
|
|
Highest ranking (1, 1)
|
|
47
|
Net debt to equity
|
11%
|
Good
|
LWUs facing significant
capital investment are encouraged to make greater use of borrowings –
page 14 of the 2014-15 NSW Performance Monitoring Report.
|
|
|
High ranking (2, 1)
|
|
48
|
Interest cover
|
3
|
|
Drivers – in general,
an interest cover of > 2 is satisfactory.
|
|
|
Highest ranking (1, 1)
|
|
48a
|
Loan payment
|
$347 per prop
|
Good
|
The component of TRB
required to meet debt payments.
Drivers – expenditure on capital works, short term loans.
|
|
|
Highest ranking (1, 1)
|
|
50
|
Operating cost (OMA)
|
$662 per prop
|
May require review
|
Prime indicator of the
financial performance of an LWU.
Drivers – development density, level of treatment, management cost,
topography, number of discrete schemes and economies of scale.
|
Review carefully to
ensure efficient operating cost.
|
|
Lowest ranking (5, 5)
|
|
52
|
Management cost
|
$158 per prop
|
Good
|
Drivers –number of
discrete schemes, number of employees. Typically about 40% of OMA.
|
|
|
High ranking (2, 3)
|
|
53
|
Treatment cost
|
$268 per prop
|
May require review
|
Drivers – type and
level of treatment, economies of scale.
|
|
|
Lowest ranking (5, 5)
|
|
54
|
Pumping cost
|
$117 per prop
|
May require review
|
Drivers –
topography, development density, effluent recycling.
|
|
|
Lowest ranking (5, 5)
|
|
56
|
Sewer main cost
|
$103 per prop
|
May require review
|
Drivers –
topography, development density, effluent recycling.
|
|
|
Lowest ranking (5, 5)
|
|
57
|
Capital expenditure
|
$110 per prop
|
May require review
|
An indicator of the level
of investment in the business.
Drivers – age and
condition of assets, asset life cycle.
|
|
|
Lowest ranking (5, 4)
|
2. The ranking relative to
similar size LWUs is shown first (Col. 2 of TBL Report) followed by the ranking
relative to all LWUs (Col. 3 of TBL Report).
3. Review and comparison of
the 2016-17 Typical Residential Bill (Indicator 12) with the projection
in your Strategic Business Plan is mandatory.
In
addition, if both indicators 46 and 46a are negative, you must report your
proposed 2017-18 typical residential bill to achieve full cost recovery.
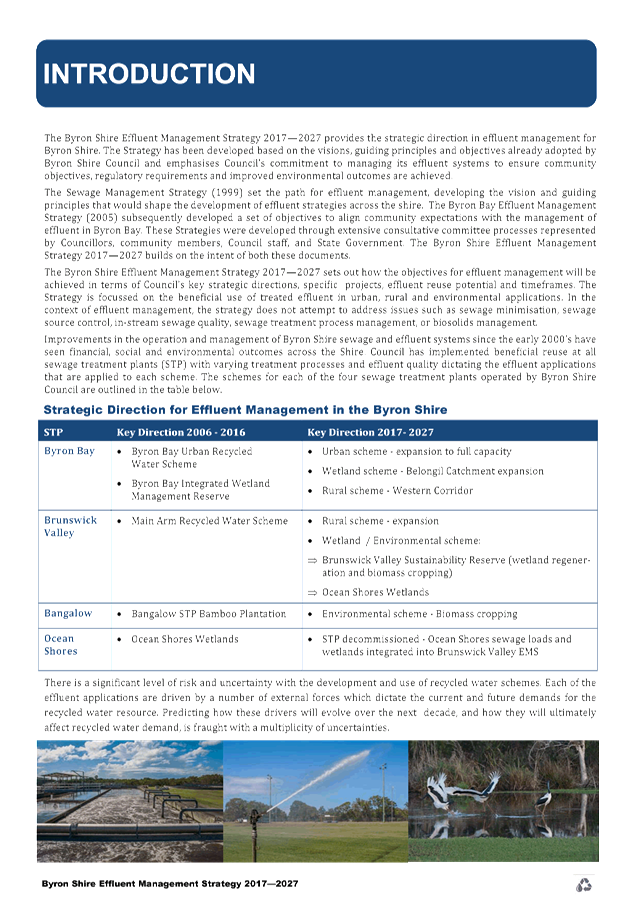
Staff Reports - Infrastructure Services 4.2
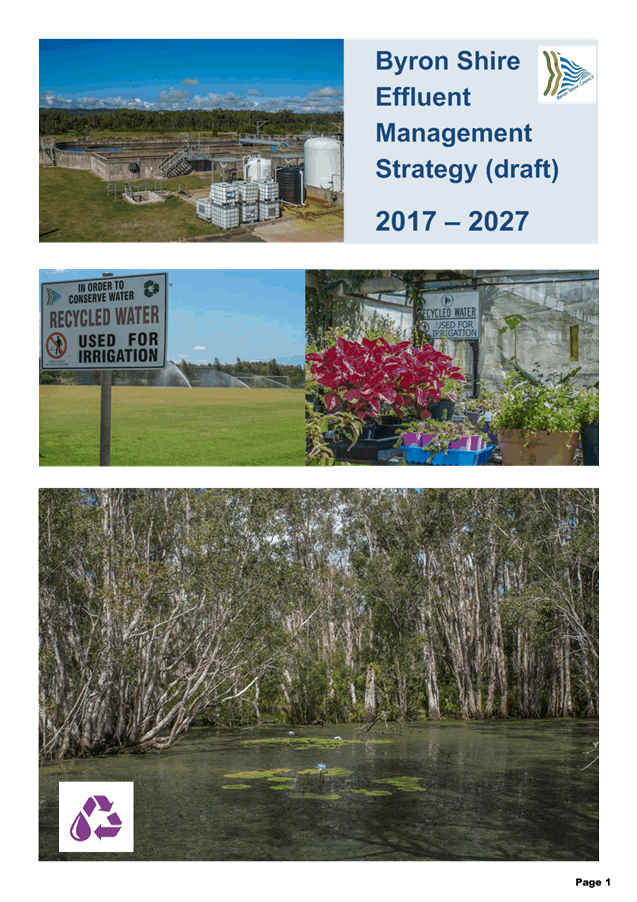
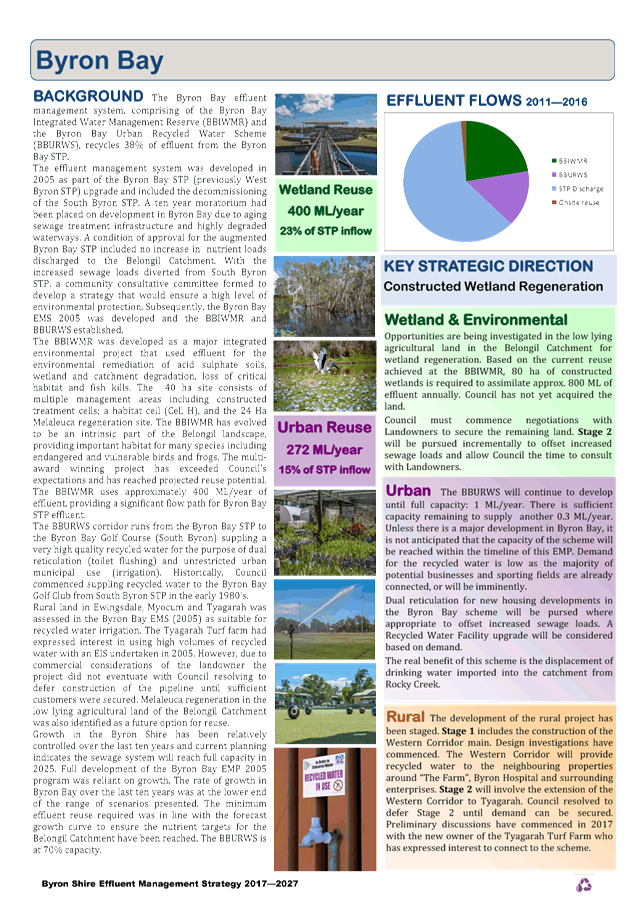
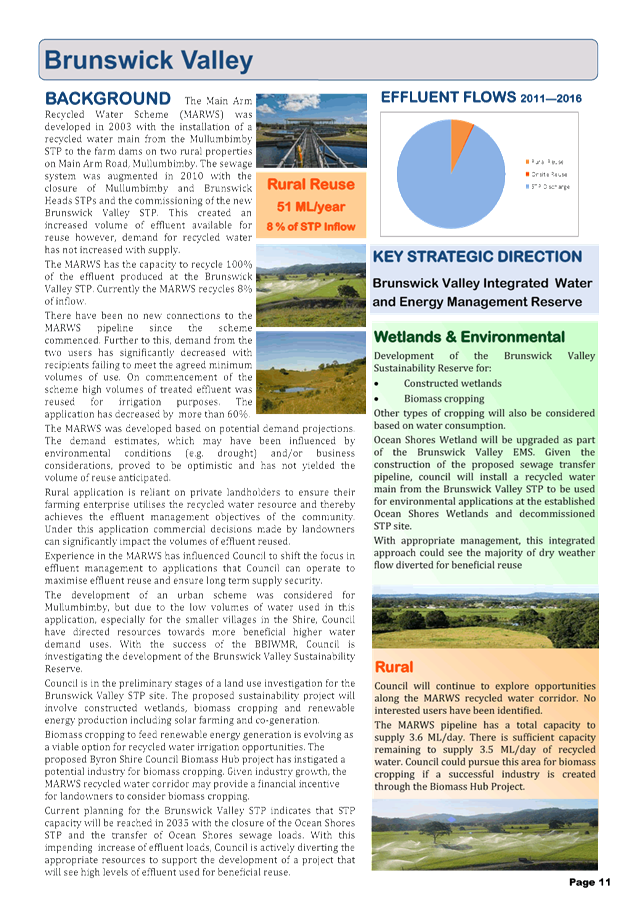
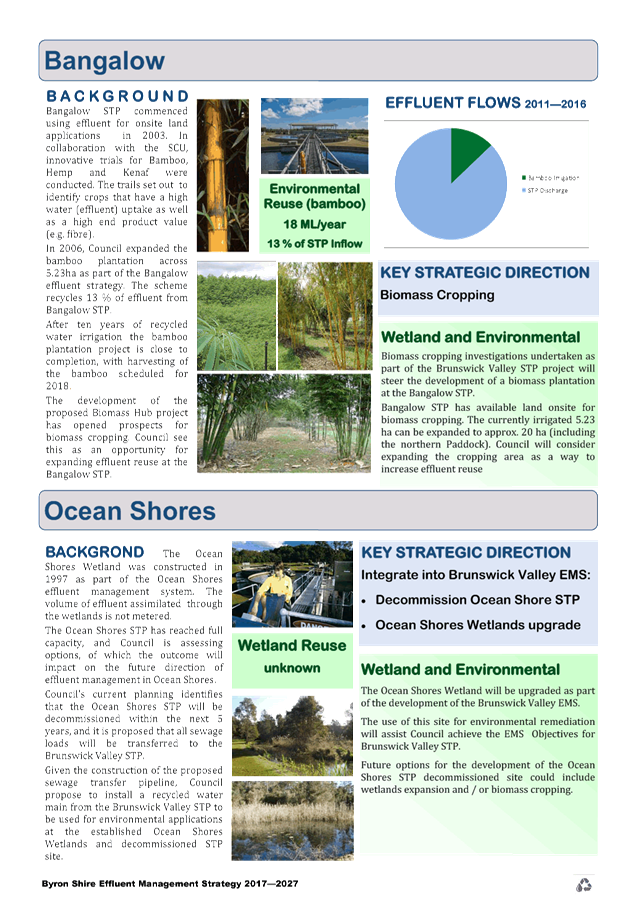
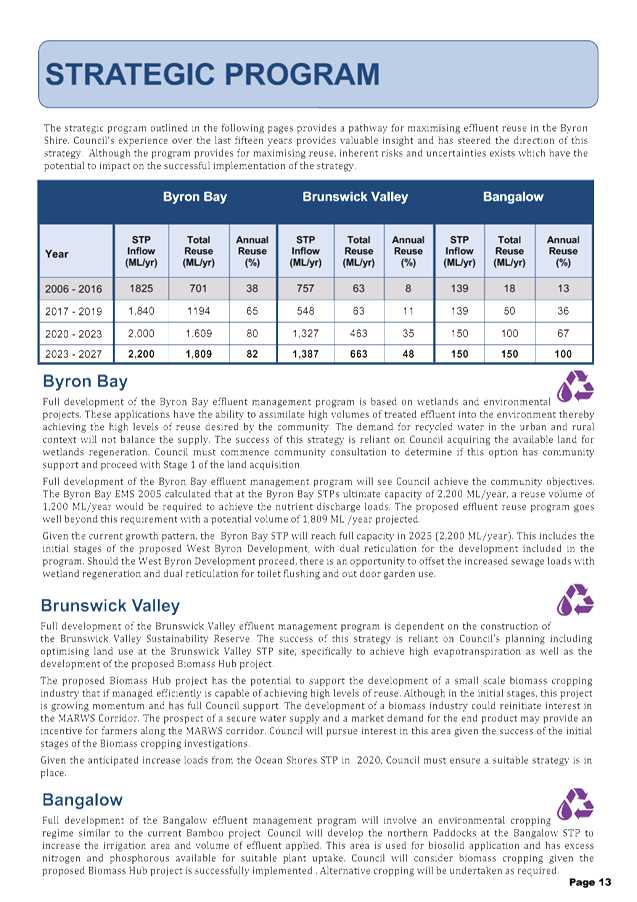
Report No. 4.2 Byron
Shire Effluent Management Strategy (Draft)
Directorate: Infrastructure
Services
Report
Author: Peter
Rees, Manager Utilities
File No: I2017/1235
Theme: Community Infrastructure
Sewerage Services
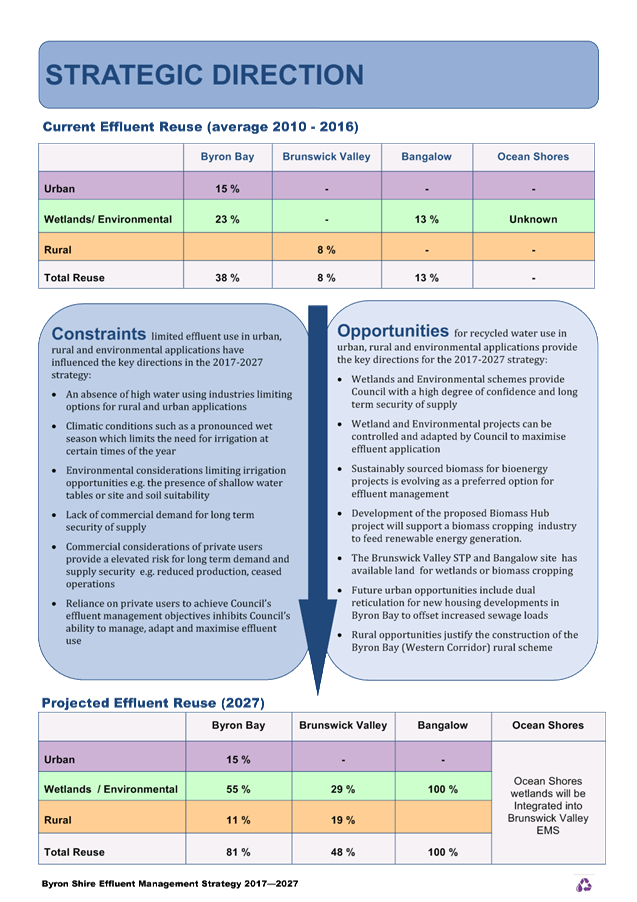
Summary:
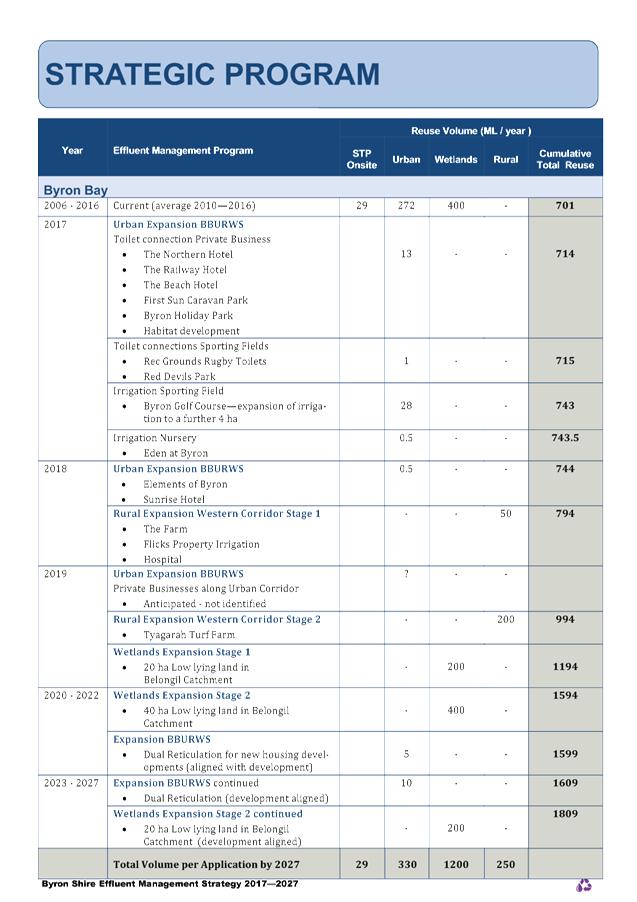
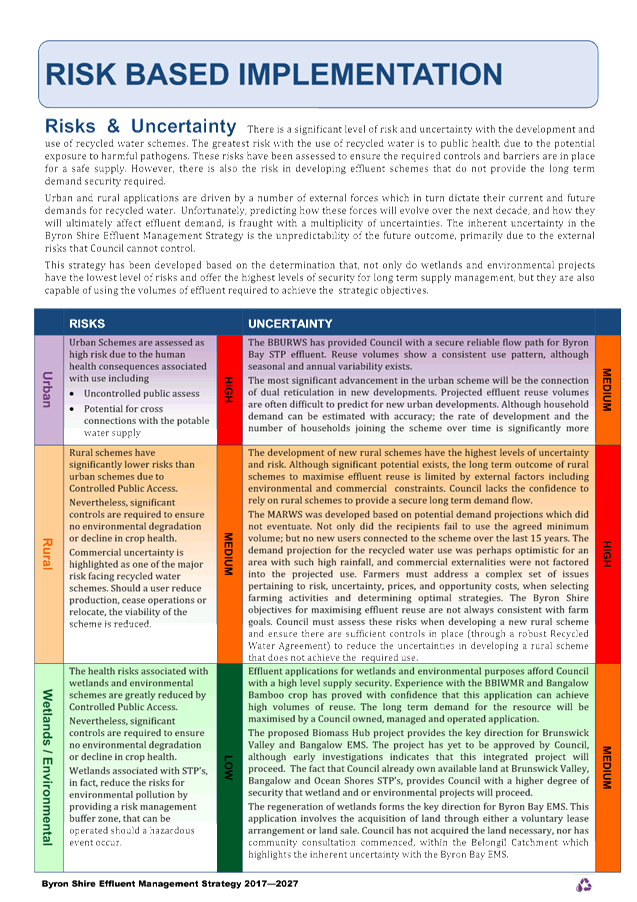
The attached document has been prepared as a shire wide
effluent management strategy replacing the 2006 adopted Byron Bay Effluent
Management Strategy. The Byron Bay strategy focussed on 3 streams of
recycled water use:-
- Urban
Reuse Corridor
- Regeneration
Projects
- Rural
Lands Project
Of these streams, the urban reuse corridor has been the most
successful in terms of identified connections with over 70% of the identified
users being connected. The quantity of recycled water used however has
been low with the largest user being the Byron Bay Golf Course.
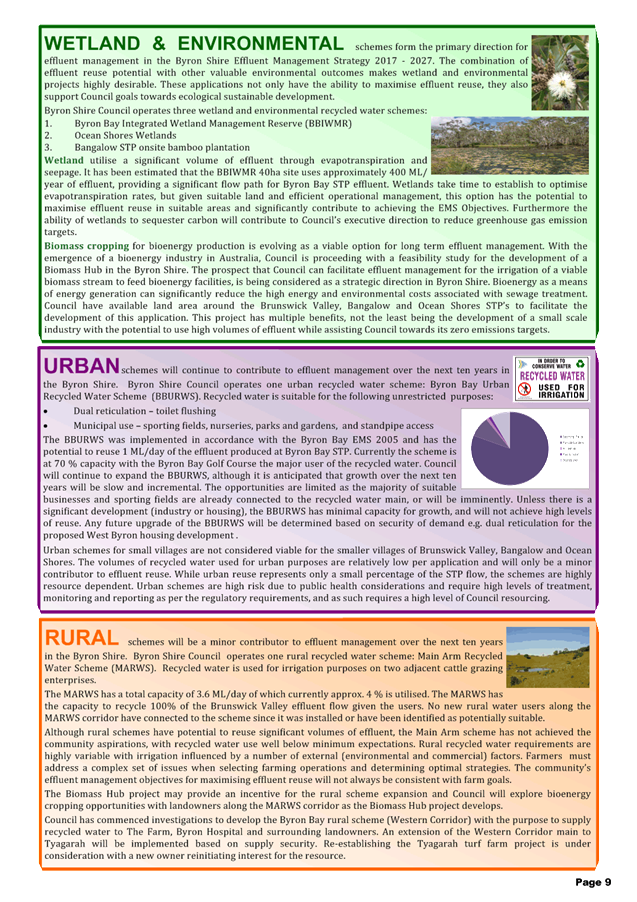
Regeneration projects have been the most successful as far
as recycled water usage particularly if the wetlands are considered for their
water usage. The number of projects, however, has been limited with only
the West Byron Wetlands and the Melaleuca Plantation being implemented.
The largest identified project in the 2006 strategy was the
Tyagarah Turf Farm. The project was put on hold by Council in 2007 when
the Turf Farm pulled out of the project and it became unviable. Ironically, the
new owner of the Turf farm has approached Council to restart the project.
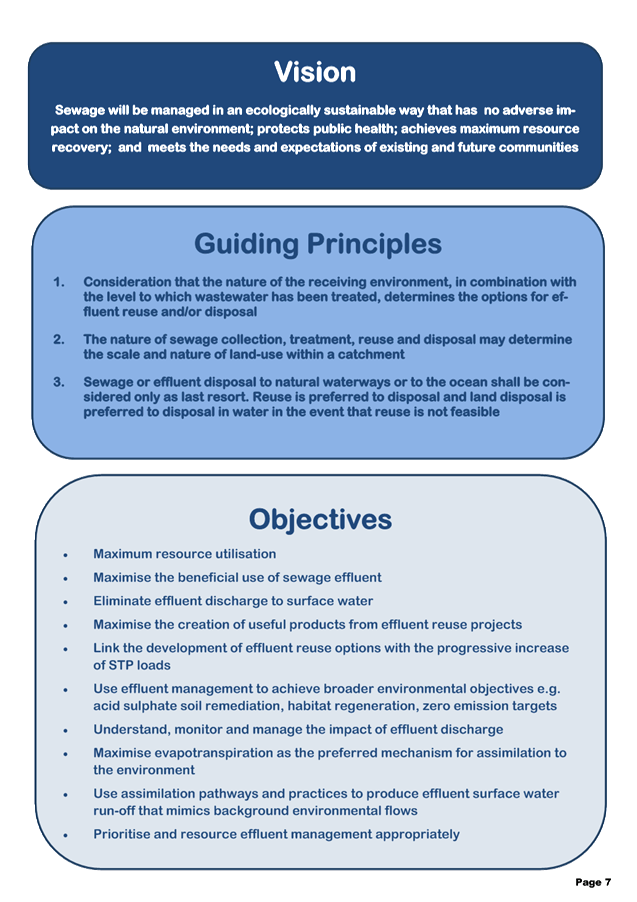
For the shire wide strategy, it is therefore recommended
Regeneration and Rural lands (including Biomass cropping) projects be the
mainstay of the Effluent Management Strategy with continued expansion of the
Byron Bay Urban Reuse corridor.
|
RECOMMENDATION:
That the Water Waste and Sewer Advisory
Committee note the Byron Shire Effluent Management Strategy and recommend its
adoption by Council.
Or
The Committee have an extraordinary meeting to workshop
the strategy.
|
Attachments:
1 Byron
Shire Effluent Management Strategy Rev 2, E2017/86469
, page 22⇩
Report
In 2006 Council adopted the Byron Bay Effluent Management
Strategy which has directed Council’s recycled water schemes. When
expanding the Byron Bay urban recycled water scheme in 2016, it was suggested
by the General Manager that it was an appropriate time to review the strategy
and consider the whole shire when doing so.
The draft strategy has been developed for the next 10 years
and is attached. It has built on Council’s successes to date and
also the general industry progression in recycled water use. For Byron
Shire’s strategy the important points to note are
Urban recycled water schemes (dual reticulation) generally
do not provide the biggest volume of recycled water usage. The strategy
therefore does not propose development of any further schemes in the Shire
other than maximising the usage of the existing scheme in Byron Bay.
The strategy pursues schemes that provide Council with a
large degree of control of the amount of recycled water usage – projects
such as wetlands and biomass cropping.
The key points of the draft strategy are therefore:-
· Dual reticulation has
been allowed for in the new West Byron development in accordance with the
current draft DCP for the area.
· Expansion of the urban
scheme west along Ewingsdale Road to the farm and the Hospital site.
· Reactivation of the
Tyagarah Turf Farm recycled water project following discussions with the new
owner.
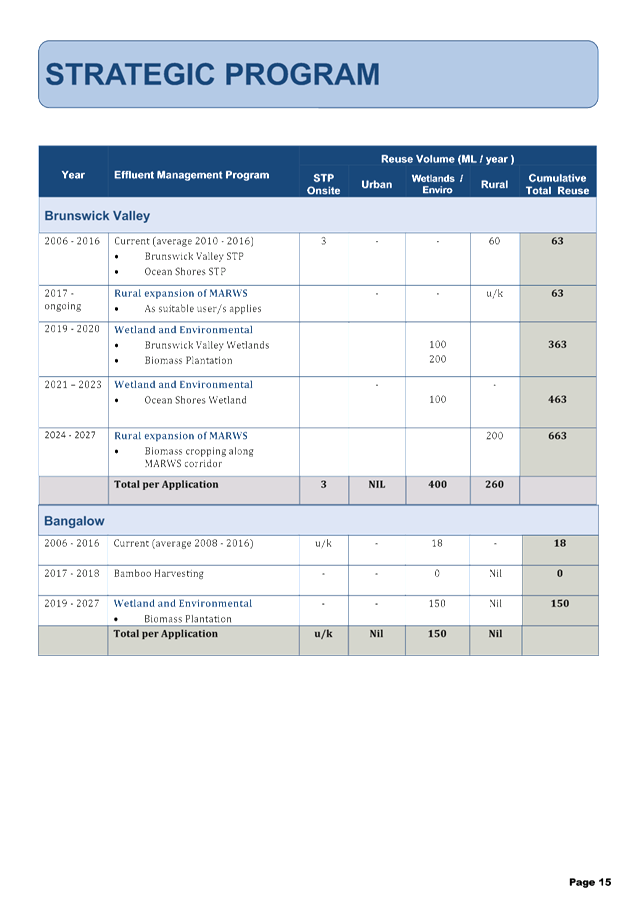
· Wetland expansion in the
Belongil catchment.
· Wetland expansion at
Brunswick Valley STP
· Wetland expansion at the
old Ocean Shores STP
· Biomass crops at
Brunswick Valley and Bangalow STPs.
The draft strategy has to date been driven by staff and is
now ready to be workshopped through the Councillors and the Water Waste and
Sewer Committee.
Financial Implications
Not applicable
Statutory and Policy Compliance Implications
Not applicable
Staff Reports - Infrastructure Services 4.2 - Attachment 1


Staff Reports - Infrastructure Services 4.3
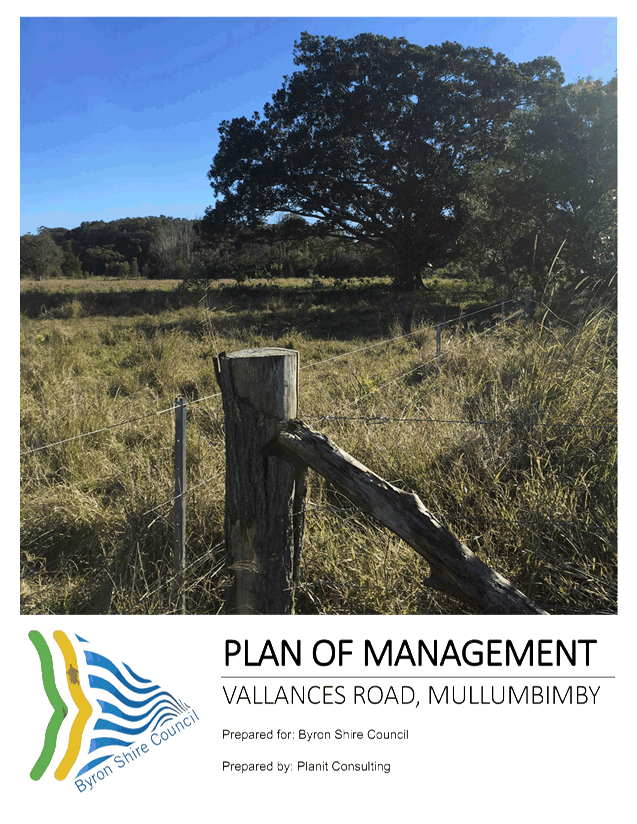
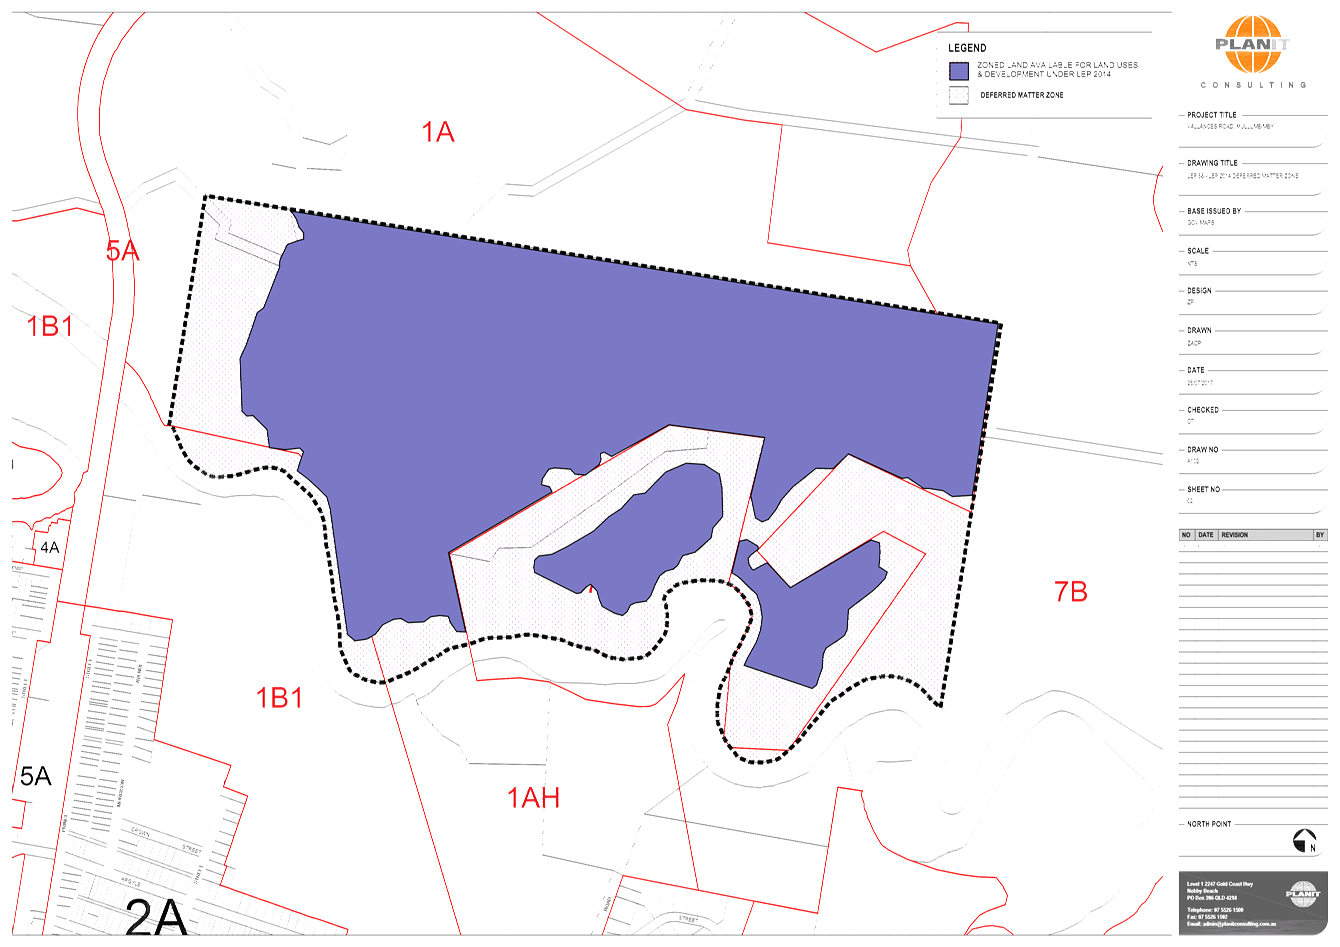
Report No. 4.3 Vallances
Road Plan of Management
Directorate: Infrastructure
Services
Report
Author: Peter
Rees, Manager Utilities
File No: I2017/1259
Theme: Community Infrastructure
Sewerage Services
Summary:
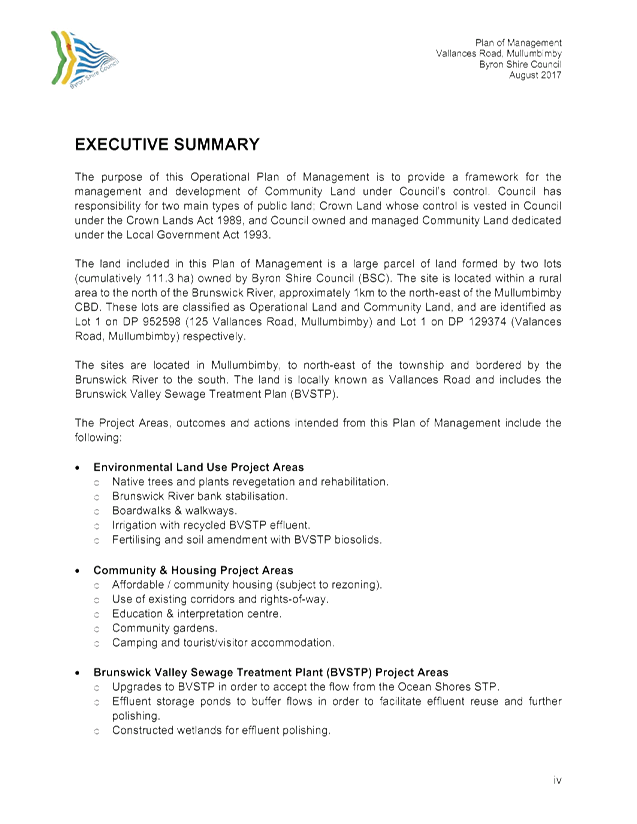
At the 23 February 2017 ordinary meeting Council resolved to
prepare a Plan of Management (POM) for the 108 hectare Vallances Road site
encompassing a suite of sustainability initiatives that demonstrate a virtuous
cycle that would be a showcase for the area and our community’s values.
The attached draft document presents the proposed Plan of
Management for the site. It should be noted, as discussed at the February 2017
Strategic Planning Workshop, it is proposed to undertake extensive community
consultation to identify activities to be undertaken on the Affordable Housing
and Community Initiatives project area.
|
RECOMMENDATION:
That the Water Waste and Sewer Advisory
Committee note the Vallances Road Plan of Management.
|
Attachments:
1 Vallances
Road Plan of Management - Rev 1, E2017/86476
, page 46⇩
Report
At the 23 February 2017 meeting, Council resolution 17-054
resolved:
1. That
Council note the report.
2. That
the proposed POM be prepared in conjunction with the Waste Water and Sewerage
Committee.
3. That
the terms of reference for the POM include the following:
a) Estimated
costing for the initiatives and their budgetary feasibility in light of related
projects in water and sewerage.
b) Possible
timeframes for their implementation.
c) Financial
viability of the potentially positive fiscal options.
d) Environmental
advantages and costs.
e) The
implications of not including the replacement of the Mullumbimby sewer system.
f) The
marginal utility of improving the quality of current treatment (without wetland
polishing) and utilising it in an effective reuse system.
g) considers
options for agricultural enterprises that utilises effluent reuse on the
property.
4. The
POM should clearly examine and advise on all and each of the initiatives in the
staff report in a holistic manner as they are part of a much bigger system with
increasing demands.
5. That
the Vallances Road Agistment contract review include eligibility criteria which
seeks to ensure that appointed contractors are of good character and have acted
lawfully and appropriately in previous contract activities
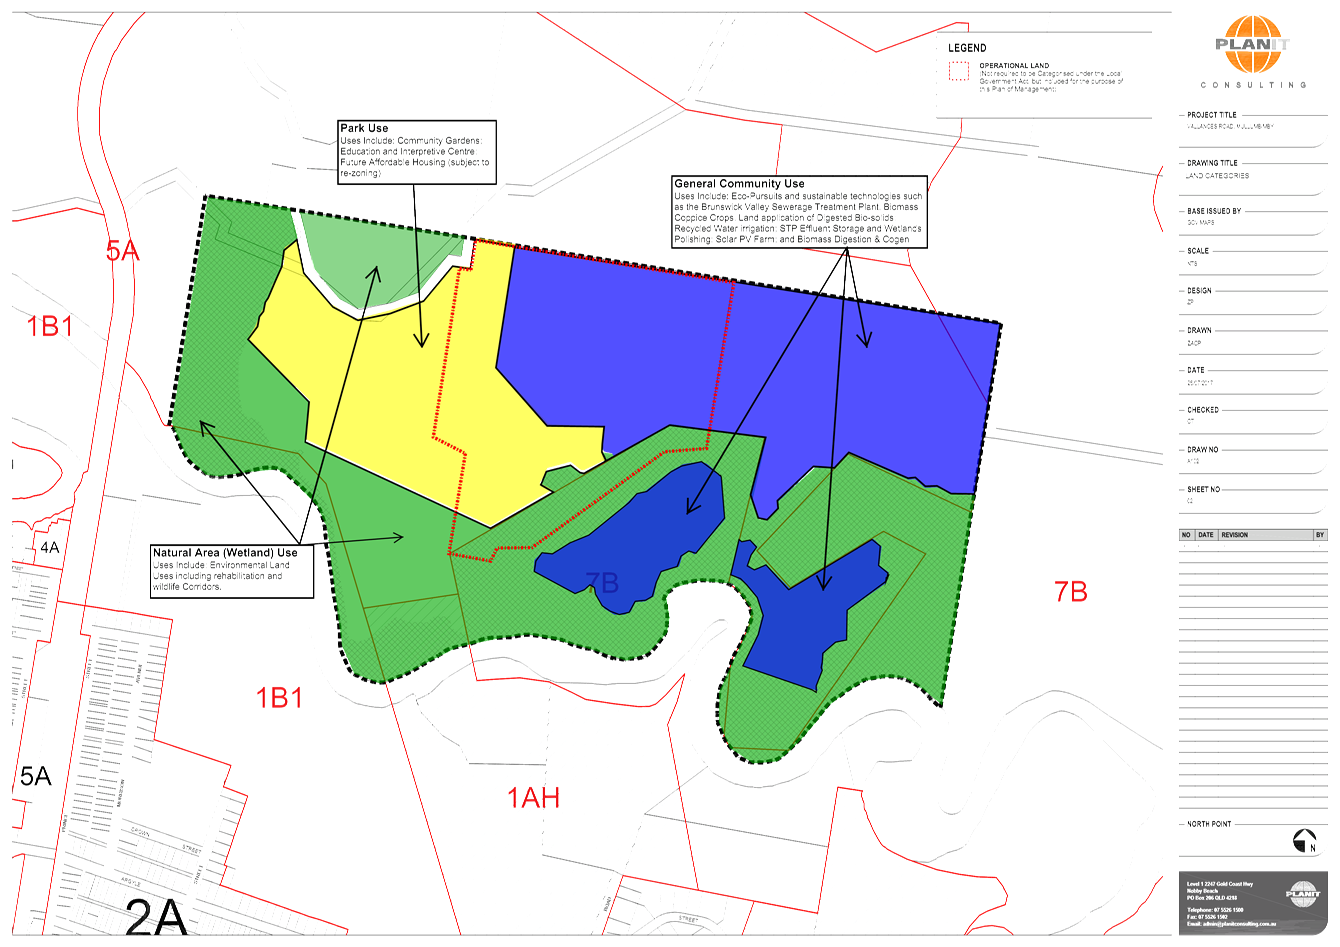
The attached document is the draft Plan of Management (POM)
for the Valances Rd site. The POM has essentially added more detail to
the original proposal presented to Council in February this year. The
draft document also complies with the State Government requirements for
development of a Plan of Management for Community Land.
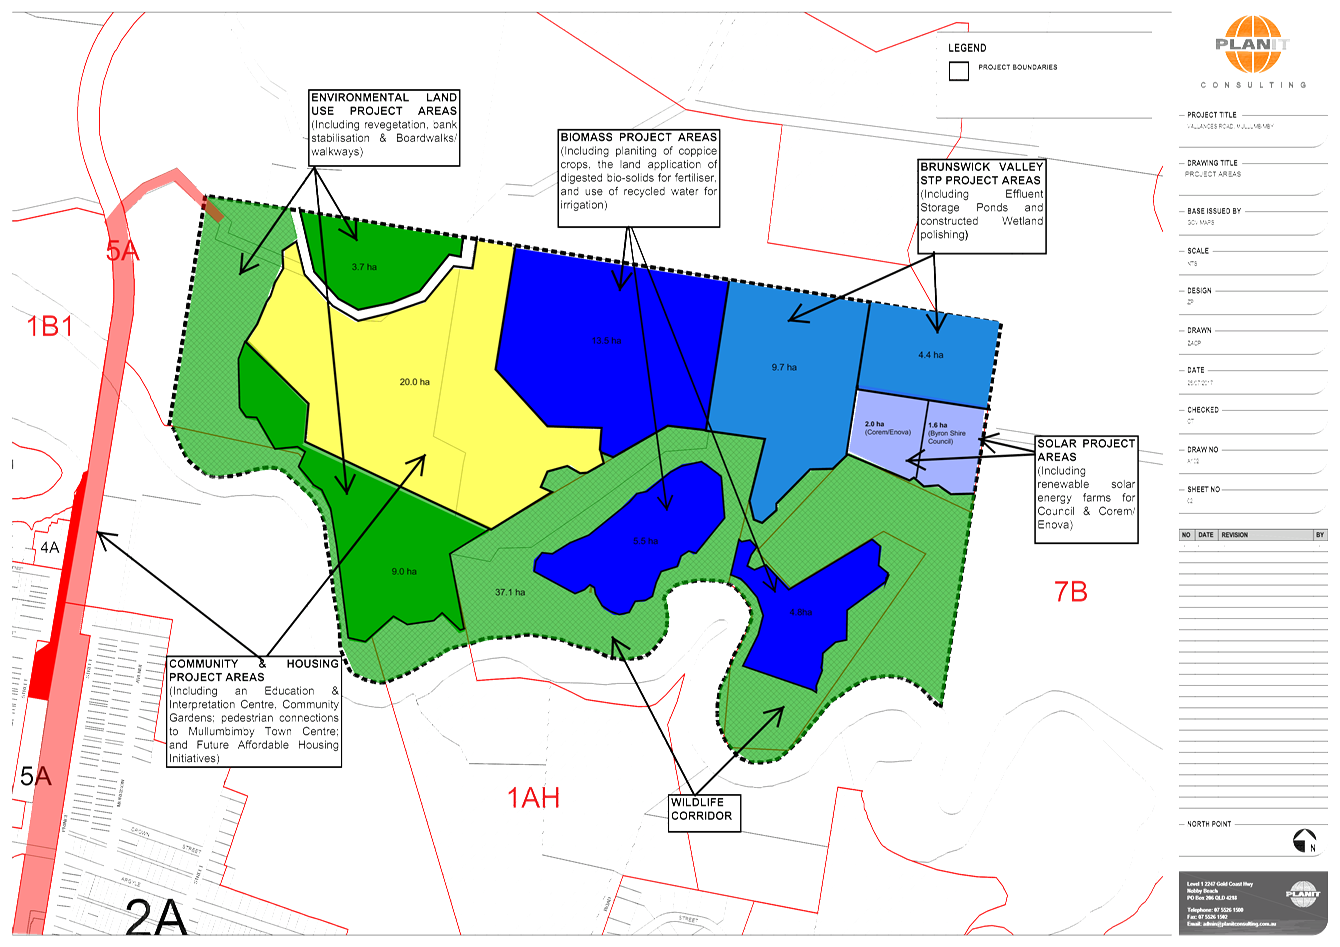
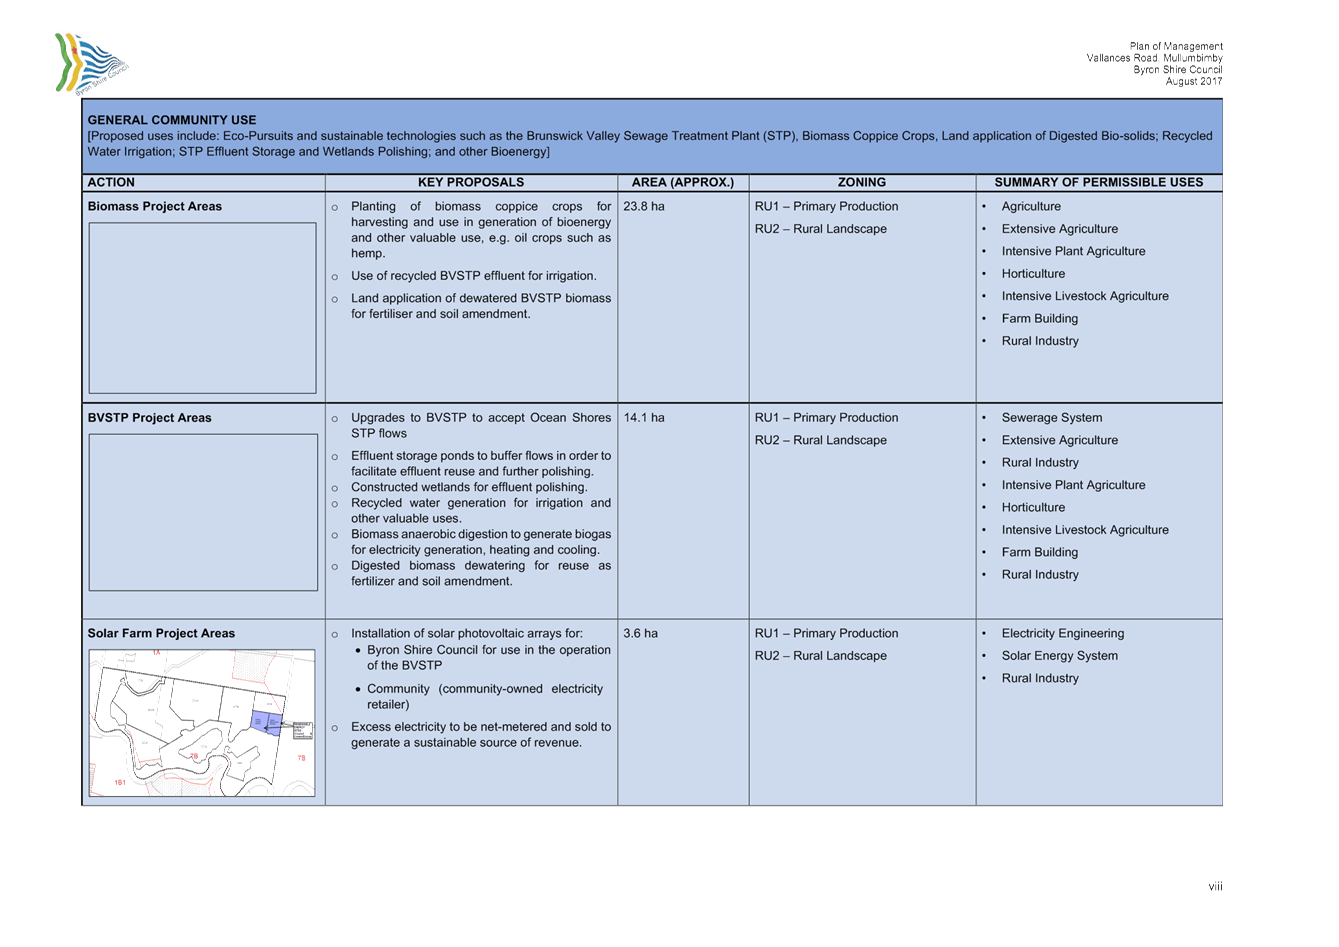
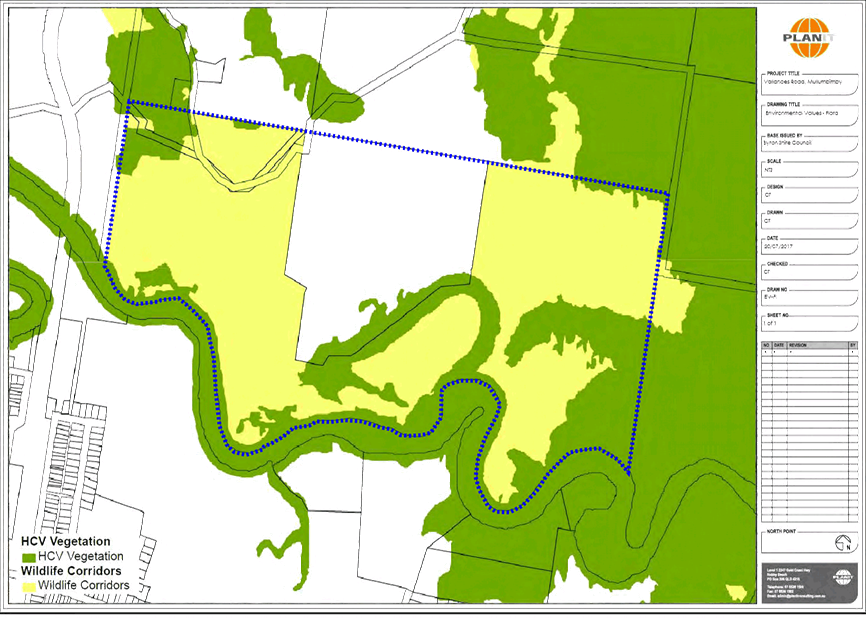
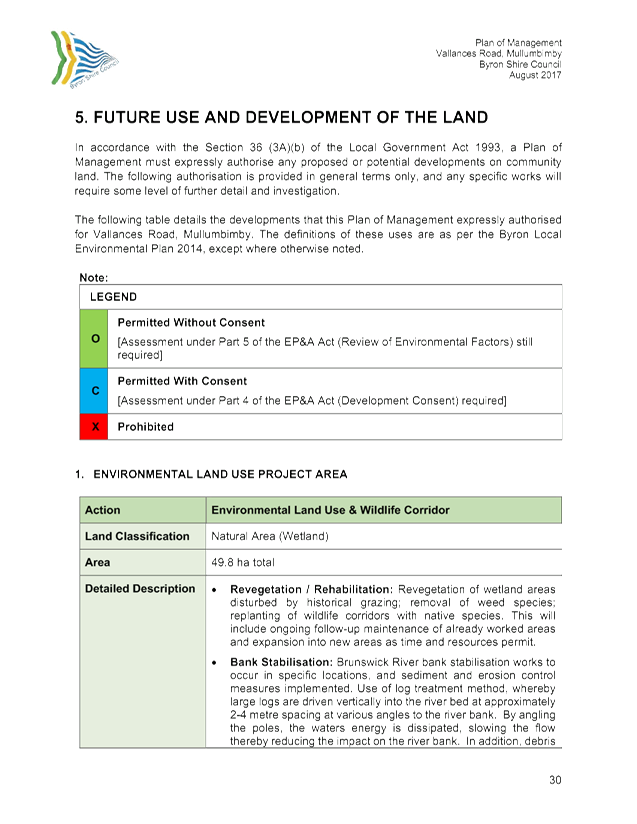
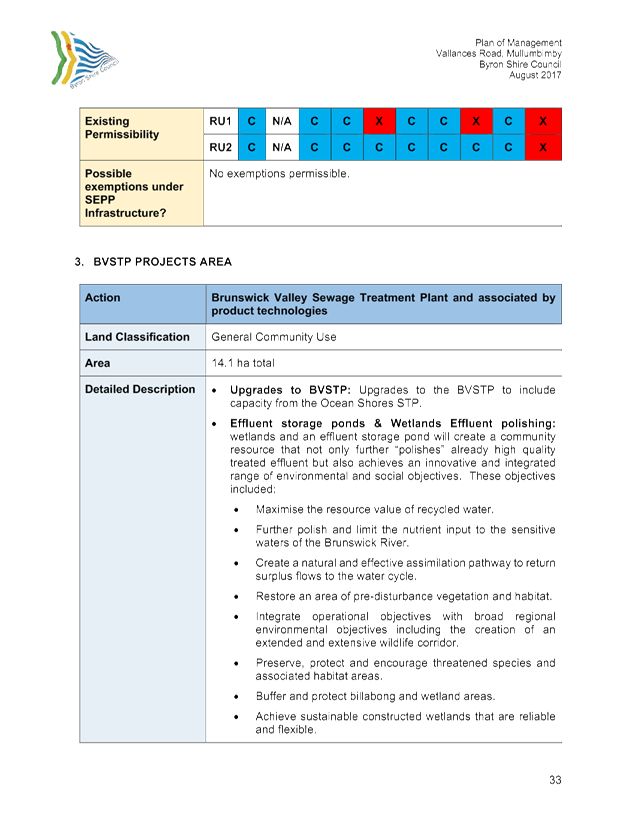
The POM has divided the area into 7 key activity areas as
follows
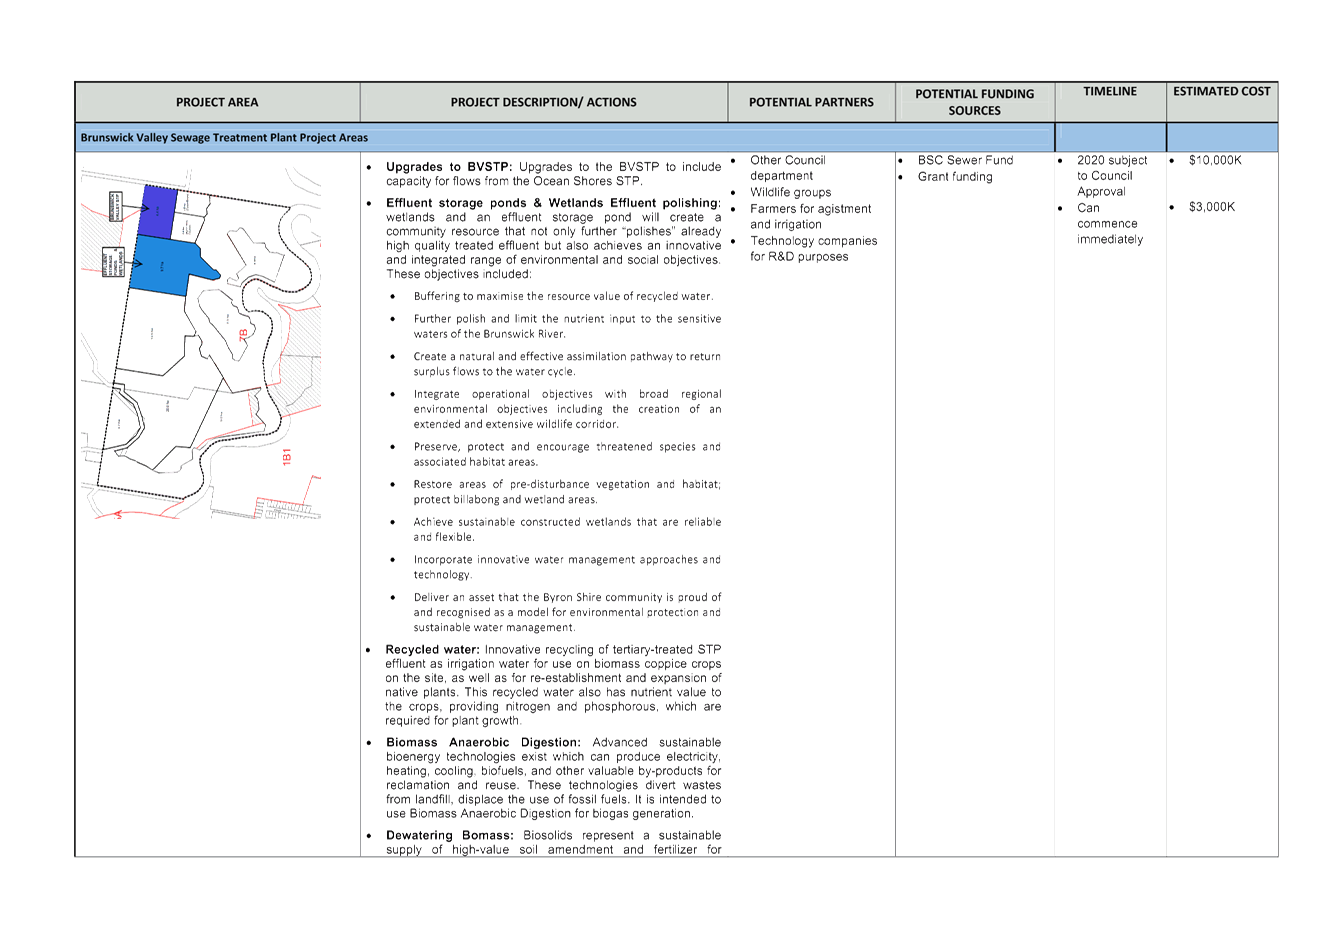
1. Brunswick
Valley STP Project areas – this includes the process plant and proposed
wetlands and effluent storage areas
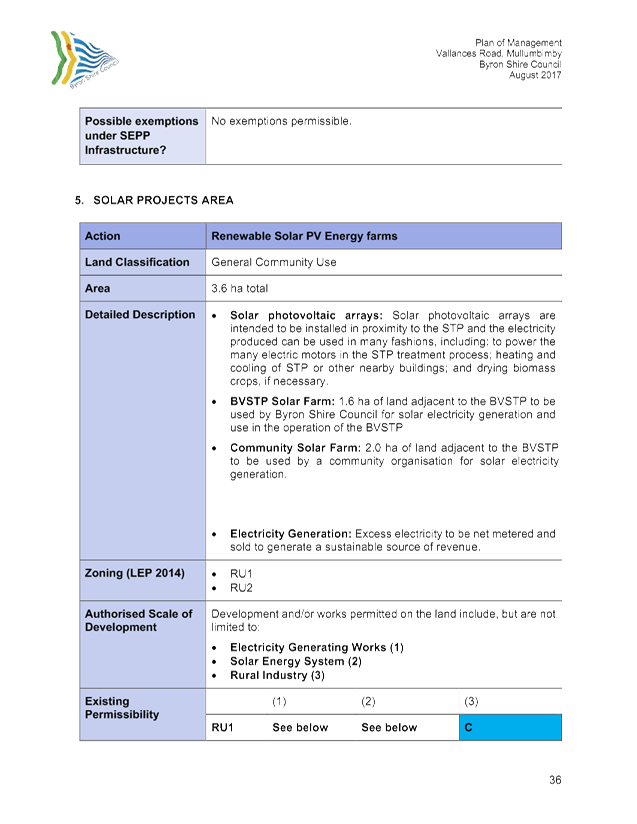
2. Solar
Farms – this is actually 2 areas with one for the BVSTP solar farm and
the other for a community solar farm
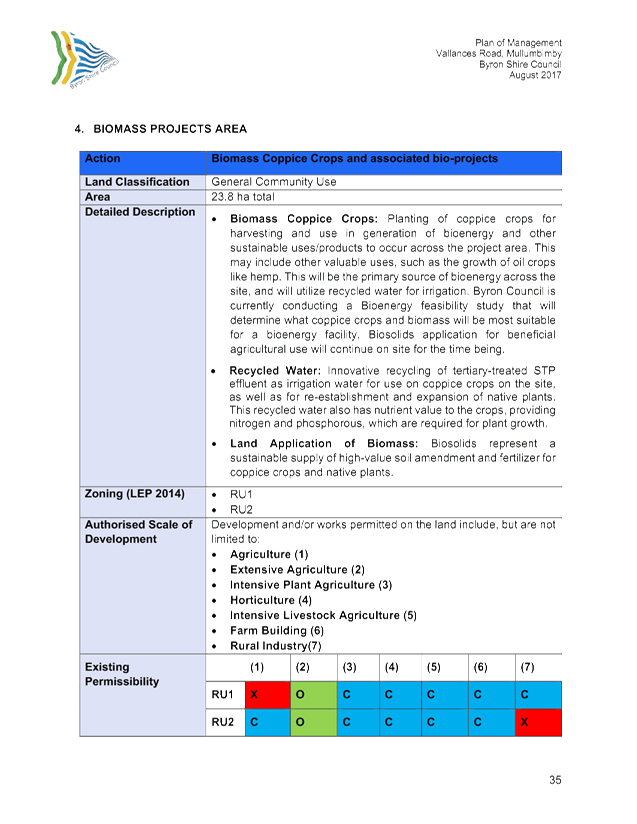
3. Biomass
project areas – for growing of biomass crops utilising biosolids and
recycled water and using the crops for power generation
4. Environmental
land use project areas – this will be a combination of revegetation
areas; rehabilitation of mangroves and billabongs; river bank stabilisation
works
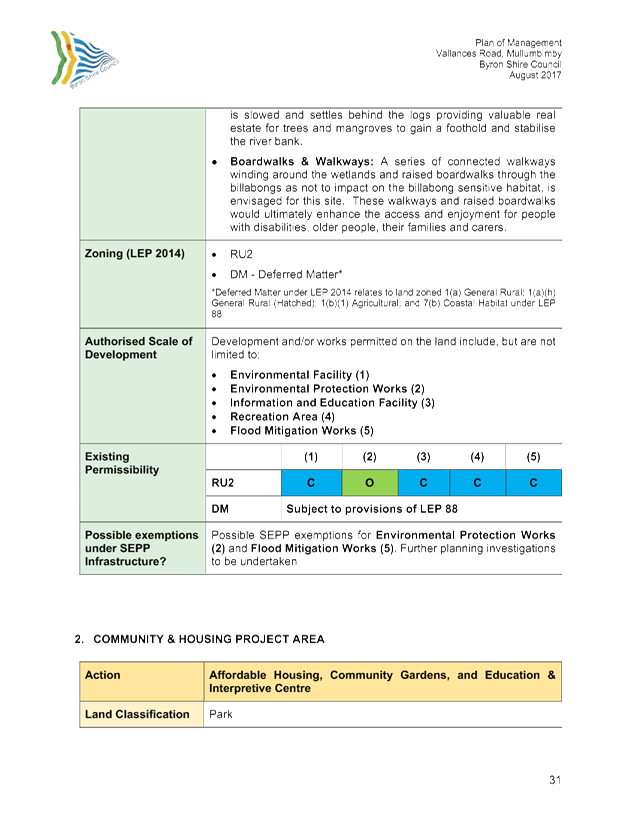
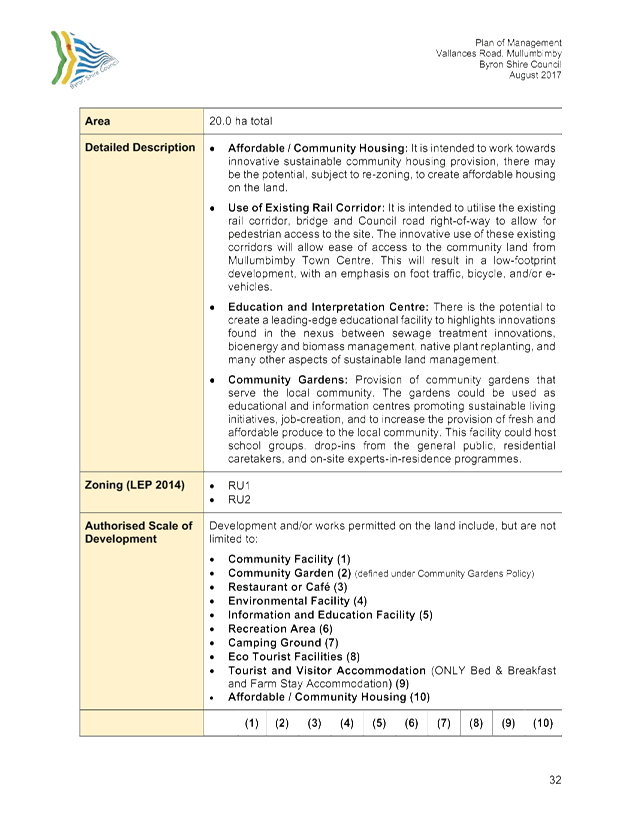
5. Affordable
Housing and Community Initiatives project area – it is recommended this
area be put out for public consultation to determine the best use alternatives.
Some immediate land use options that are available are eco tourism;
educational/interpretative centres; and community gardens. It has not as yet
been determined if the existing structures on the site including the 2 existing
dwellings are a benefit or a hindrance at this stage.
6. Community
access – possibly somewhat controversially, the POM has identified the
main access thoroughfare to the site as being via the existing rail line and
bridge that connects to an inactive road reserve into the western boundary.
This would require significant will on the part of Council to bring to
fruition. Parking would be at Lot 4 at the end of Station Street with access
along the rail / road corridor by foot / bicycle / electric cars.
7. Throughout
the site would be a network of walkways and information portals explaining the
“virtuous cycle” of waste conversion to energy; solar power; carbon
sequestration; environmental habitat; mangroves and riparian protection.
The site has real potential to be both a showcase for the
area and our community’s values.
A catalyst to bringing the project alive is the proposed
closing of the Ocean Shores STP and transferring the effluent to the Brunswick
Valley site. The will initiate a $10 million plus spend that, given the
healthy financial position of the Sewer Fund, can be expanded to include many
of the ancillary projects identified in the draft POM.
In relation to Item 3(e) it should also be noted the issue
of reducing stormwater entering the gravity sewer system in Mullumbimby is a
separate project and has no impact on this proposed Plan of Management.
In relation to Item 3(f) there is considered to be no
marginal utility in removing wetlands and in lieu upgrading the BVSTP recycled
water system to include dual reticulation standard. These effluent streams can
happen in parallel as occurs at the Byron Bay STP.
Financial Implications
The implementation of the draft Plan of Management for
valances Rd could occur under the umbrella of the OSSTP transfer project with
little material impact on the sewer reserve funds. Depending on the final
configuration of the Affordable Housing and Community Initiatives project area;
and the power generation projects, the site could in effect generate income that
would be beneficial to the sewer reserve funds.
Statutory and Policy Compliance Implications
The draft Vallances Rd Plan of Management document has
attempted to embody Council’s strategic objectives embodied in
· Biodiversity
Conservation Strategy
· Sustainable
Agriculture Strategy
· Low Carbon
Strategy 2014
· Climate Change
Strategic Planning Policy
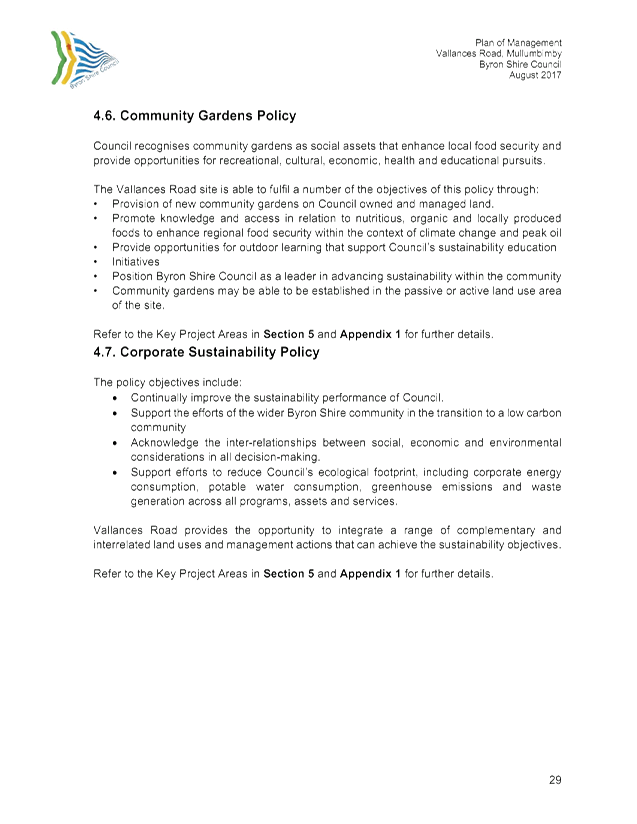
· Community Gardens
Policy
· Corporate
Sustainability Policy
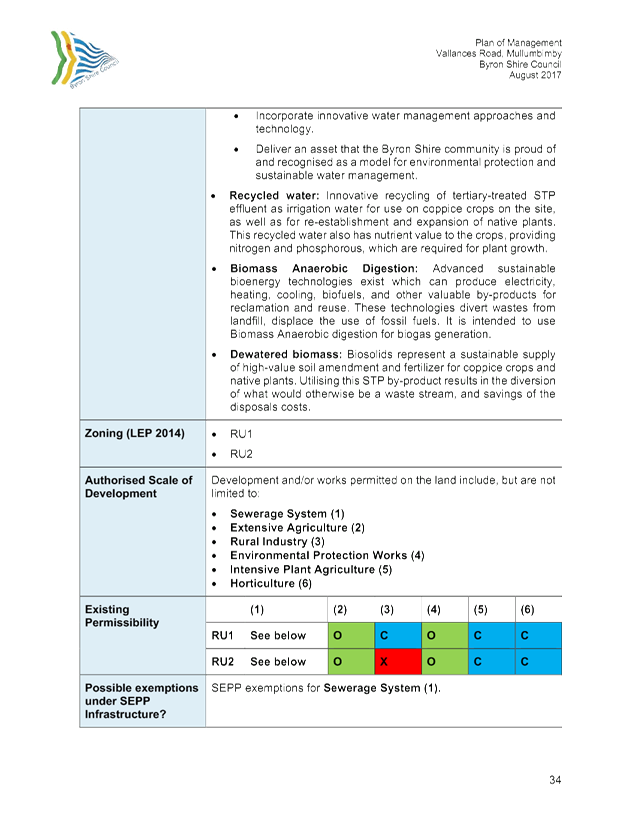
Staff Reports - Infrastructure Services 4.3 - Attachment 1

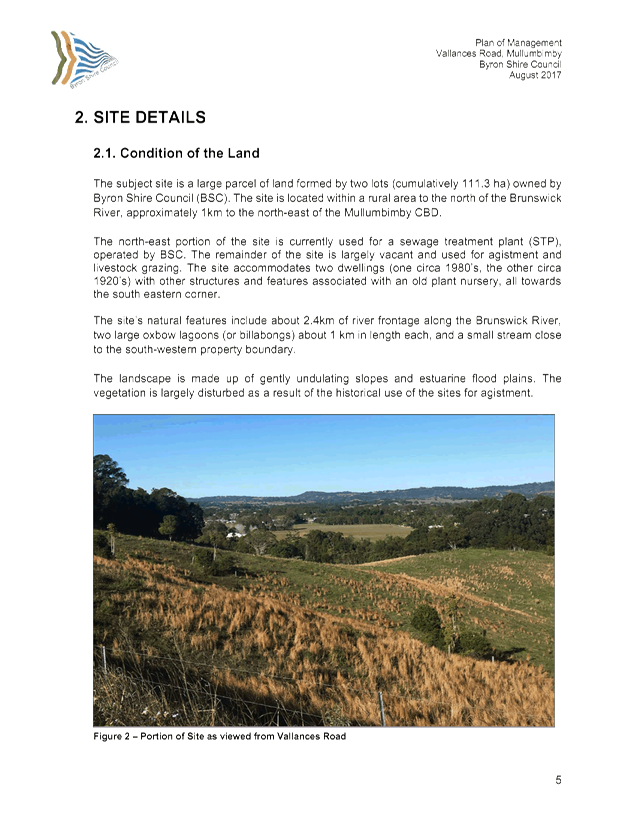
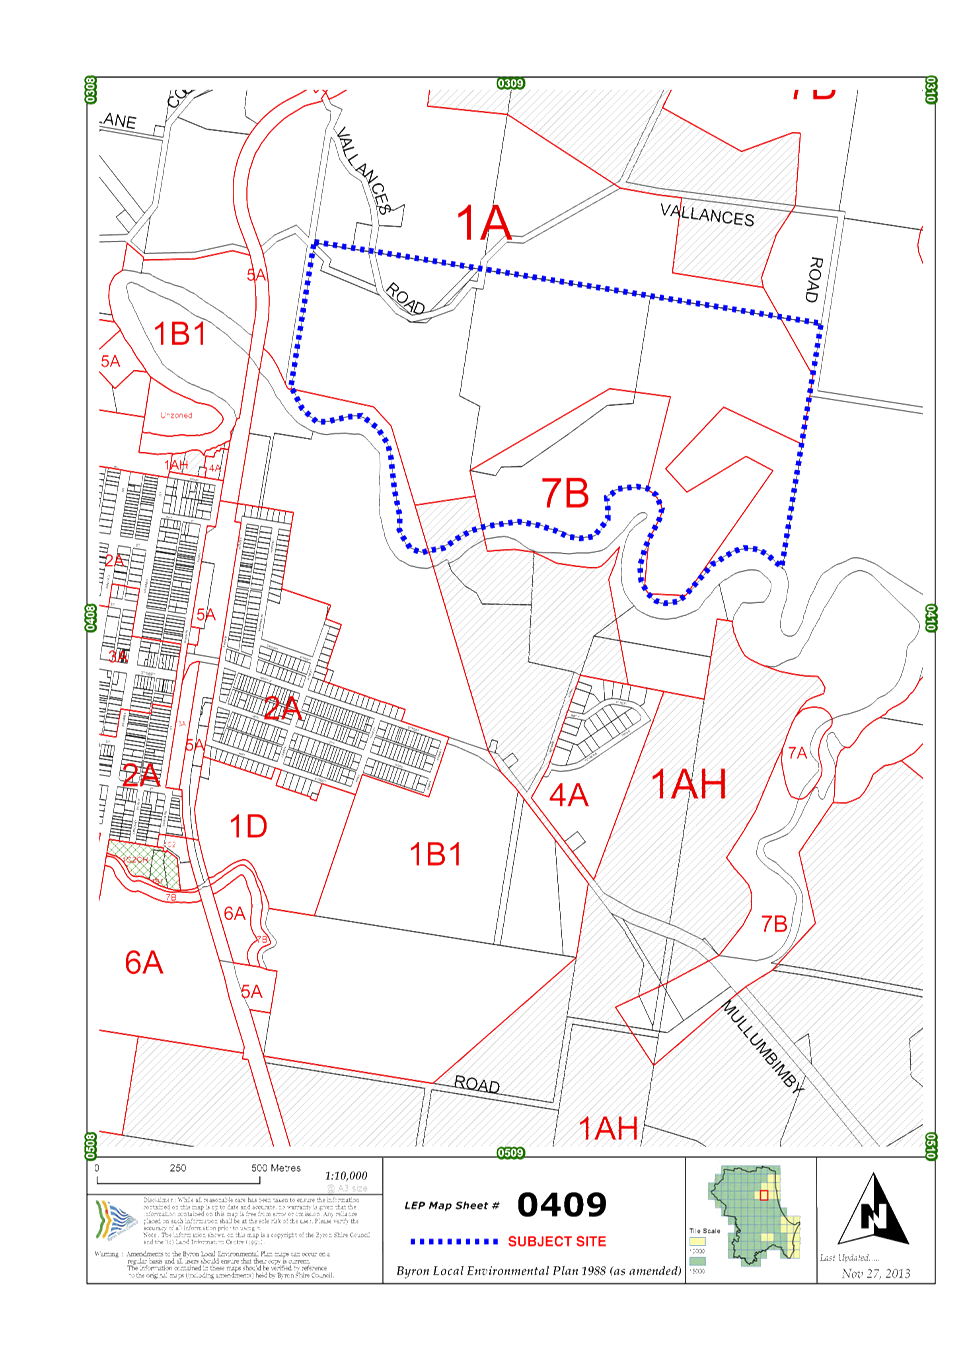
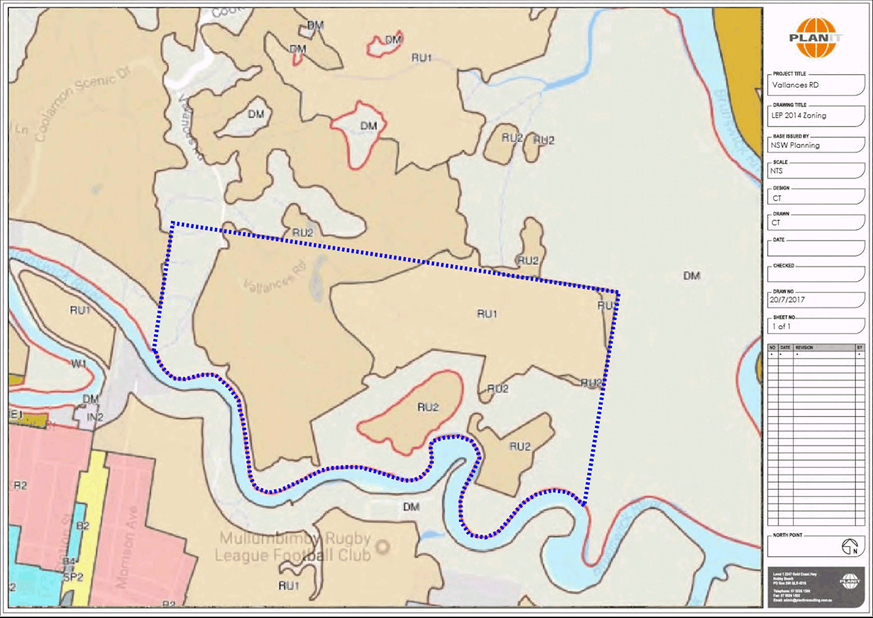
Staff Reports - Infrastructure Services 4.3 - Attachment 1
Staff Reports - Infrastructure Services 4.3 - Attachment 1


Staff Reports - Infrastructure Services 4.3 - Attachment 1
Staff Reports - Infrastructure Services 4.3 - Attachment 1
Staff Reports - Infrastructure Services 4.3 - Attachment 1
Staff Reports - Infrastructure Services 4.3 - Attachment 1
Staff Reports - Infrastructure Services 4.3 - Attachment 1
Staff Reports - Infrastructure Services 4.3 - Attachment 1
Staff Reports - Infrastructure Services 4.3 - Attachment 1
Staff Reports - Infrastructure Services 4.3 - Attachment 1
Staff Reports - Infrastructure Services 4.3 - Attachment 1
Staff Reports - Infrastructure Services 4.3 - Attachment 1
Staff Reports - Infrastructure Services 4.3 - Attachment 1
Staff Reports - Infrastructure Services 4.3 - Attachment 1
Staff Reports - Infrastructure Services 4.3 - Attachment 1
Staff Reports - Infrastructure Services 4.3 - Attachment 1

Staff Reports - Infrastructure Services 4.3 - Attachment 1
Staff Reports - Infrastructure Services 4.4
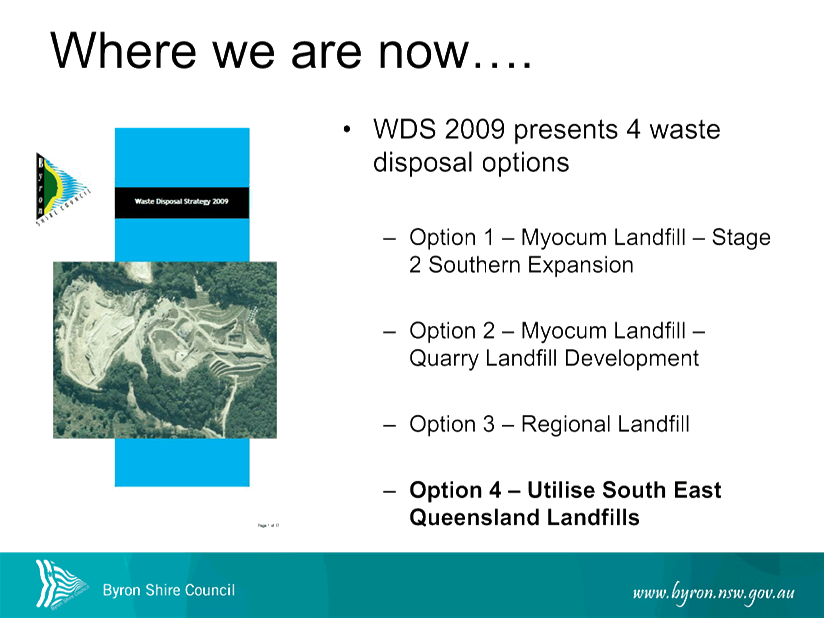
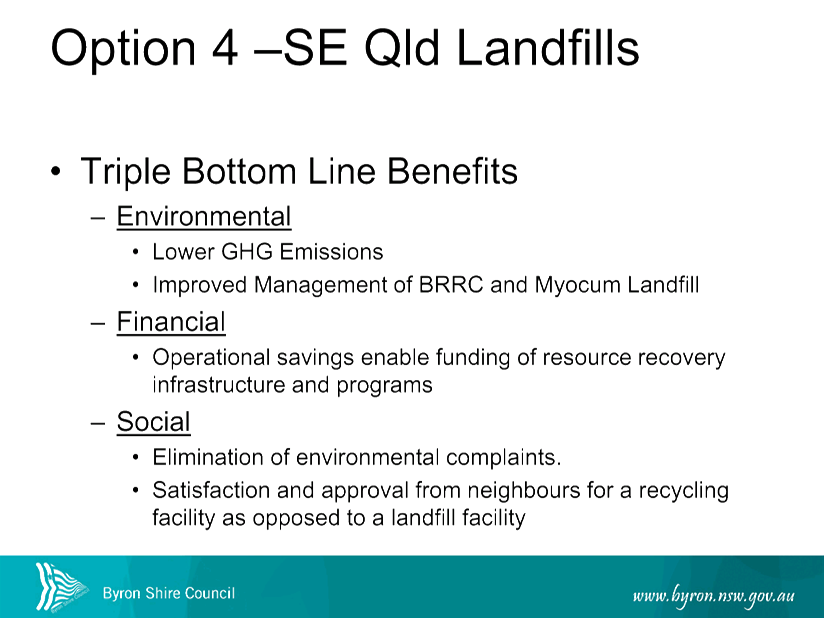
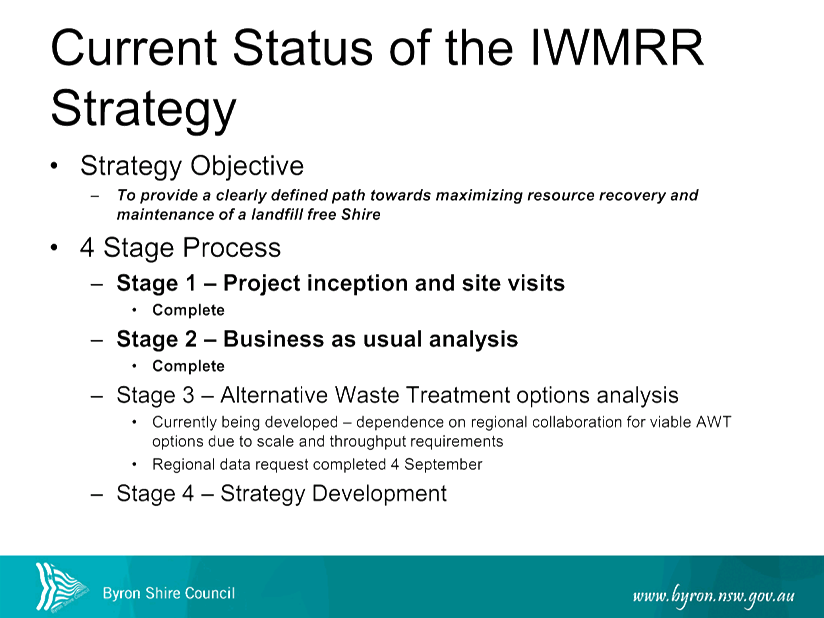
Report No. 4.4 Update
on the review of Council's Integrated Waste Management and Resource Recovery
Strategy
Directorate: Infrastructure
Services
Report
Author: Lloyd
Isaacson, Team Leader Resource Recovery and Quarry
File No: I2017/1262
Theme: Community Infrastructure
Waste and Recycling Services
Summary:
The attached presentation
provides an update on the status of the review of Council’s Integrated Waste Management and
Resource Recovery Strategy.
|
RECOMMENDATION:
That the report on the update of the review of
Council’s Integrated Waste Management and Resource Recovery Strategy be
noted.
|
Attachments:
1 Presentation
to September 2017 WWSAC - Update on the review of Council’s Integrated
Waste Management & Resource Recovery Strategy, E2017/88593 , page 102⇩
Report
The attached presentation
provides an update on the status of the review of Council’s Integrated Waste Management and
Resource Recovery Strategy
Financial Implications
Nil
Statutory and Policy Compliance Implications
Nil
Staff Reports - Infrastructure Services 4.4 - Attachment 1
Staff Reports - Infrastructure Services 4.5
Report No. 4.5 Response
to Alan Dickens Questions
Directorate: Infrastructure
Services
Report
Author: Peter
Rees, Manager Utilities
File No: I2017/1268
Theme: Community Infrastructure
Sewerage Services
Summary:
Mr Alan Dickens as a member of the Water Sewer and Waste
Advisory Committee asked for questions to be tabled at the next committee
meeting.
|
RECOMMENDATION:
That the Committee note the report.
|
Attachments:
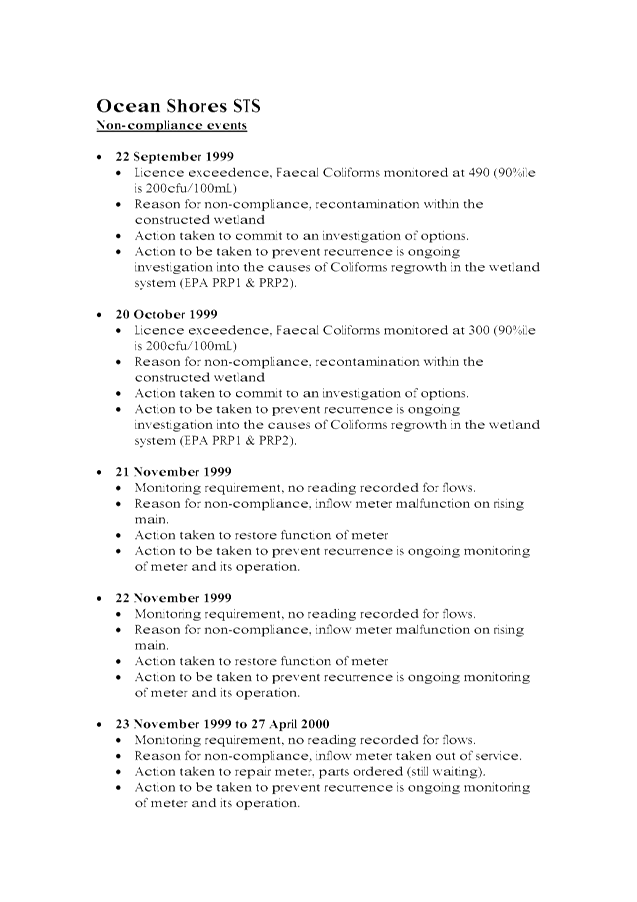
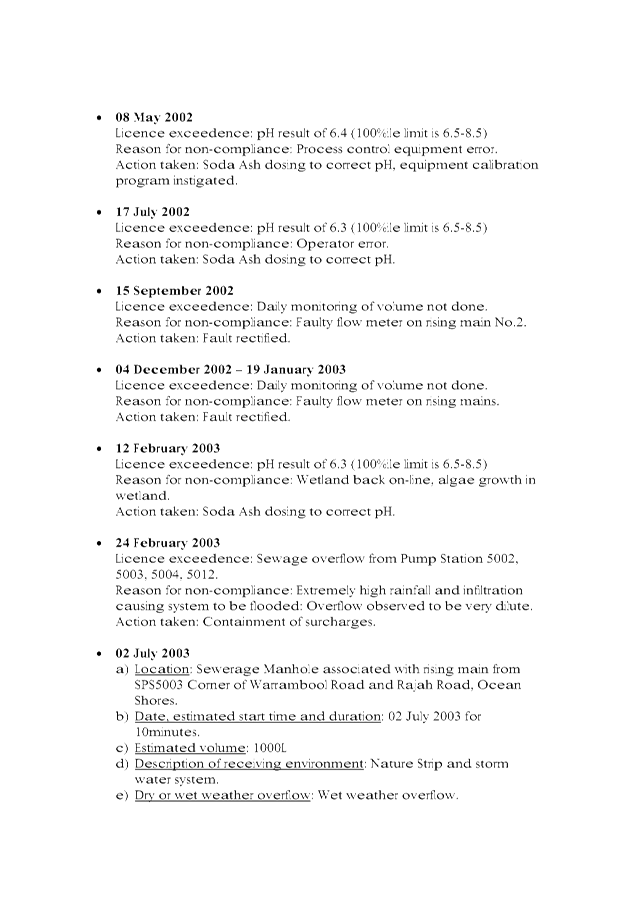
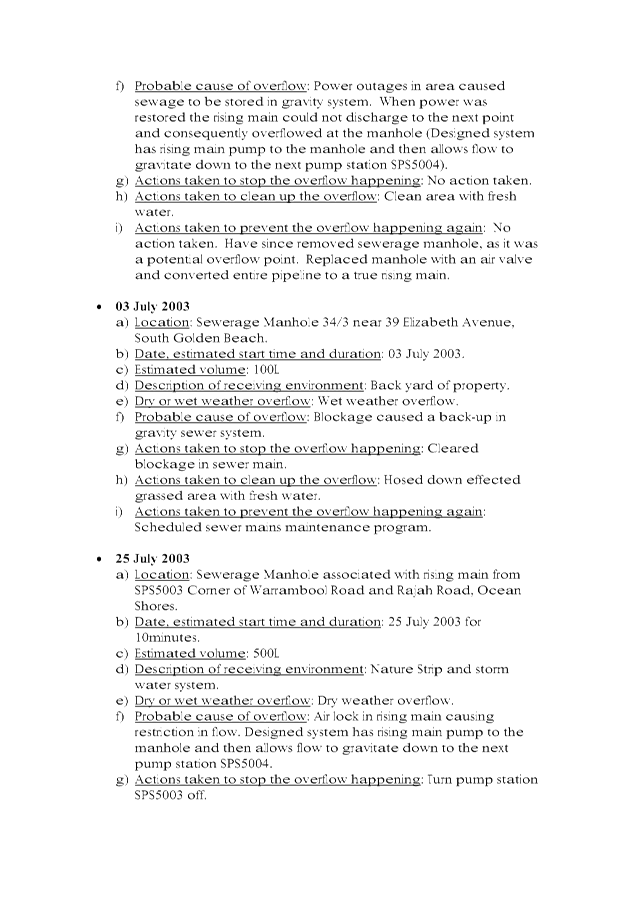
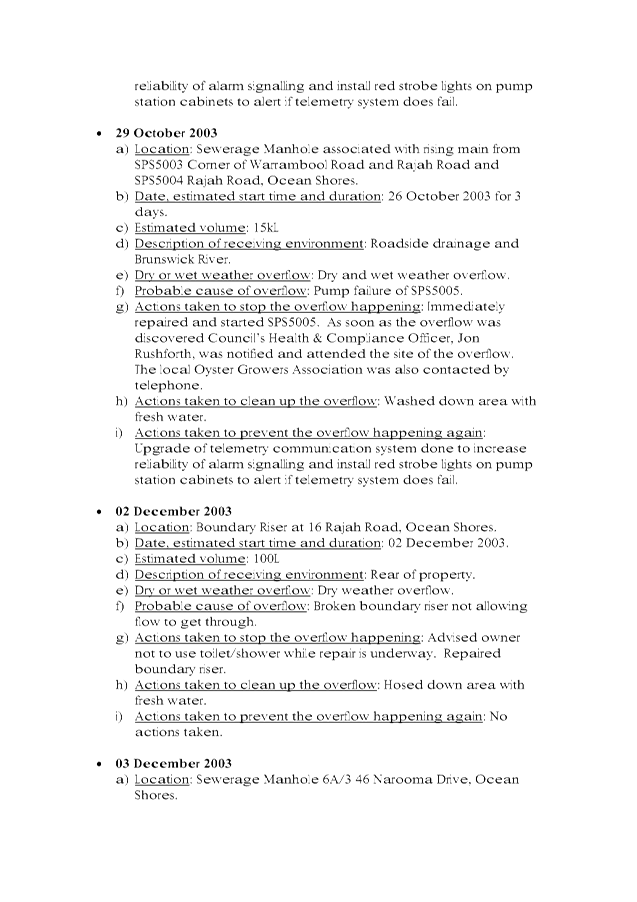
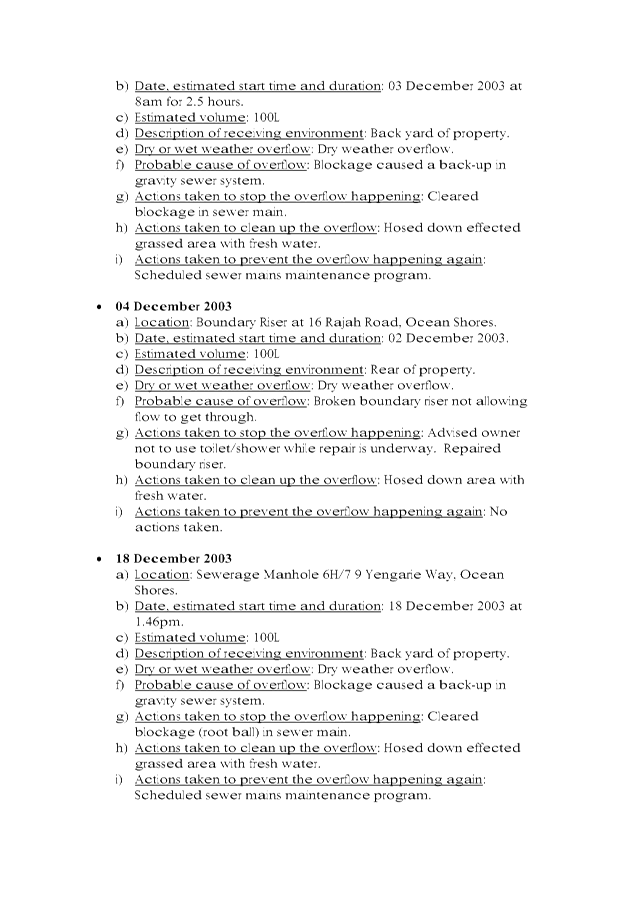
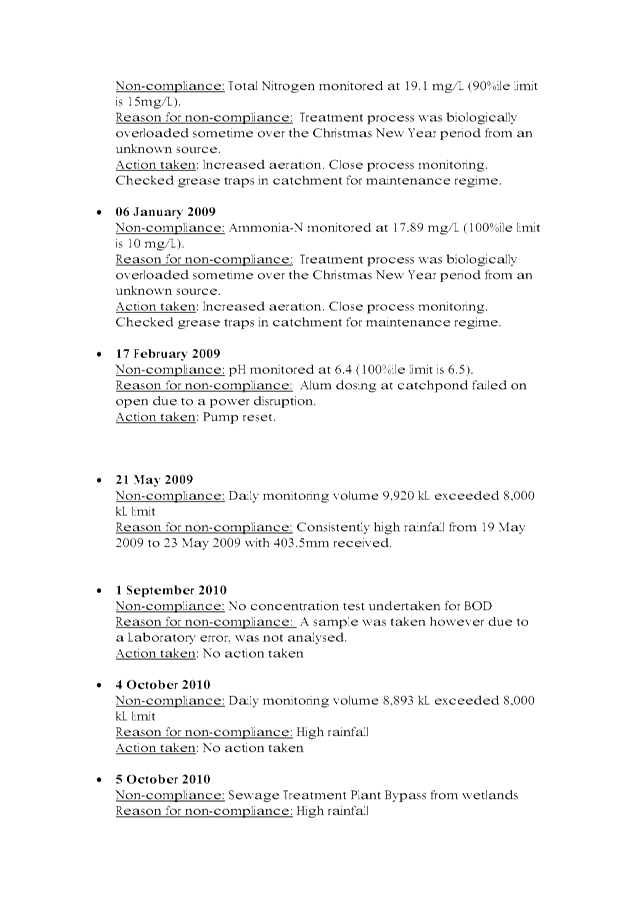
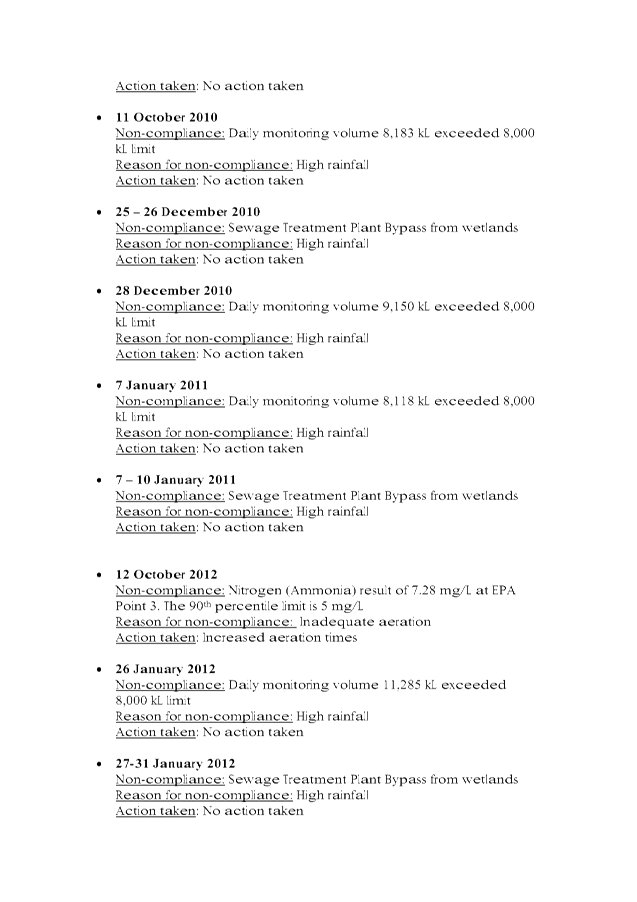
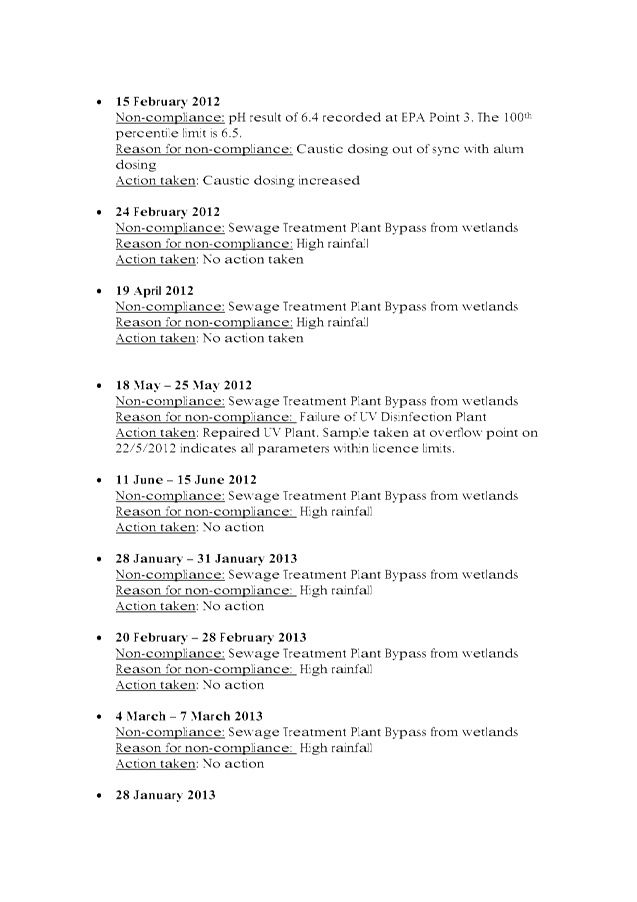
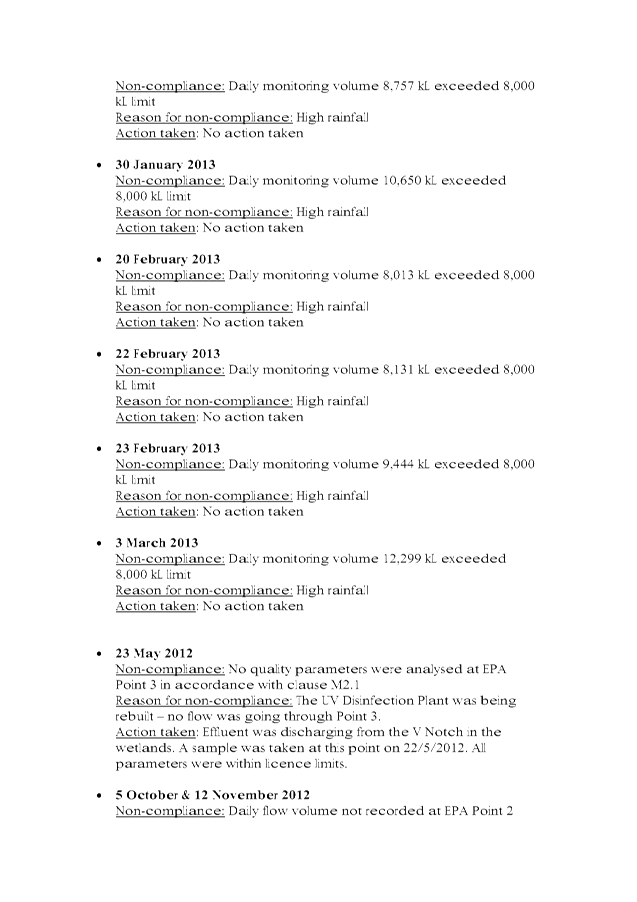
1 Ocean
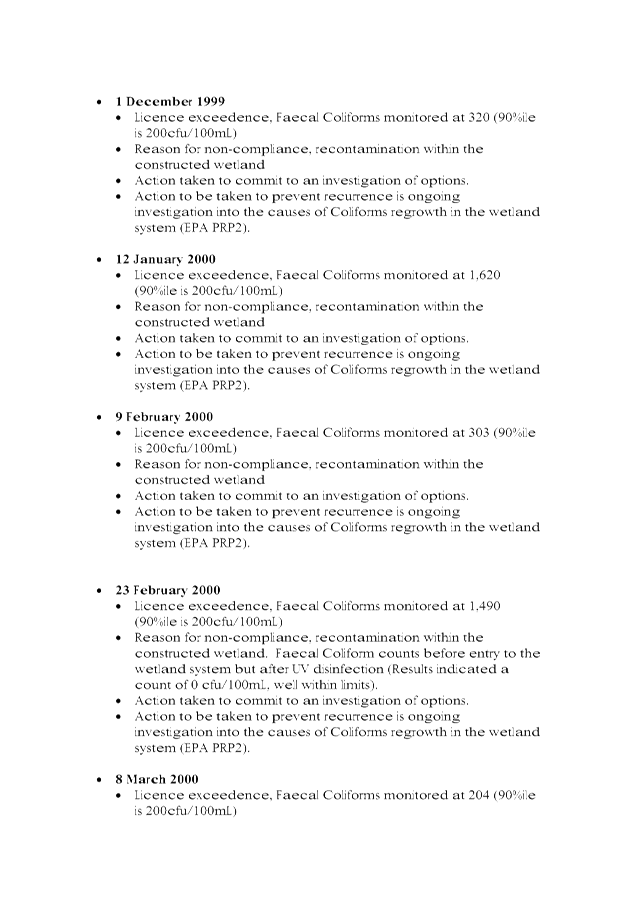
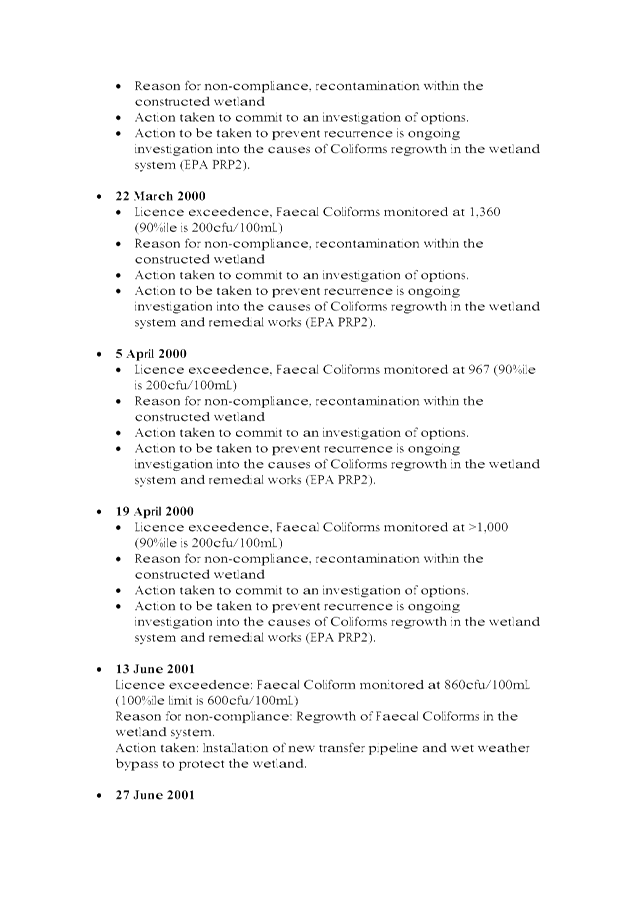
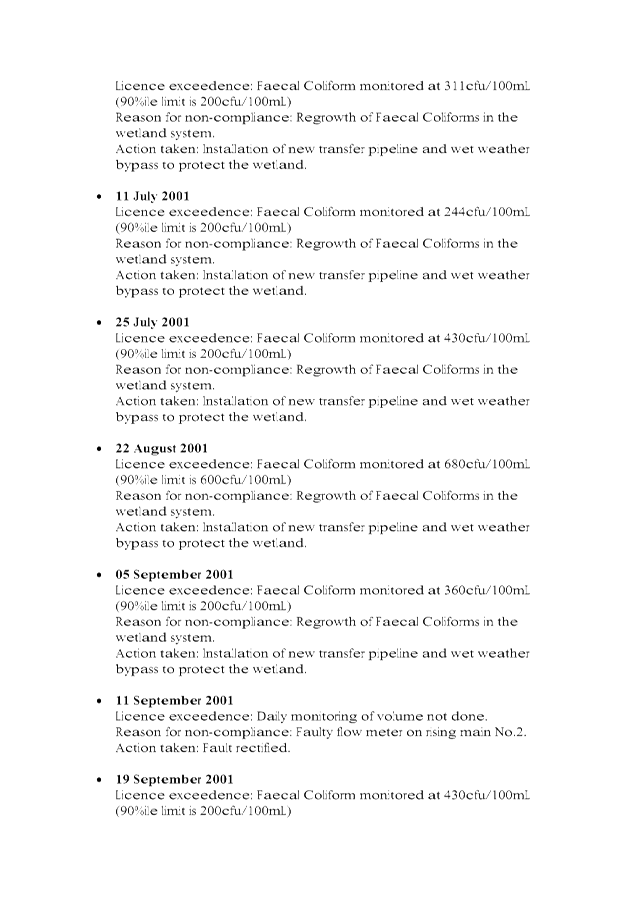
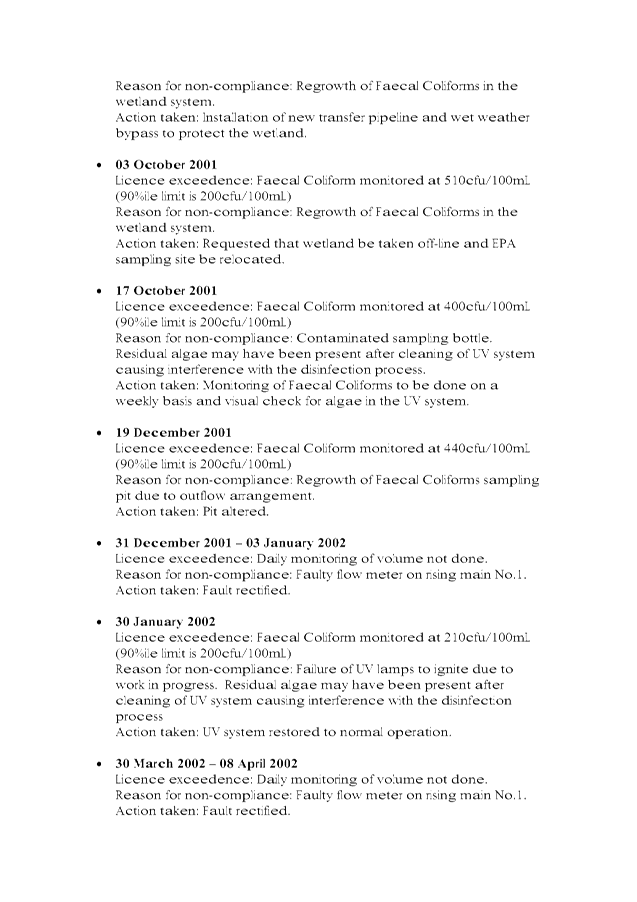
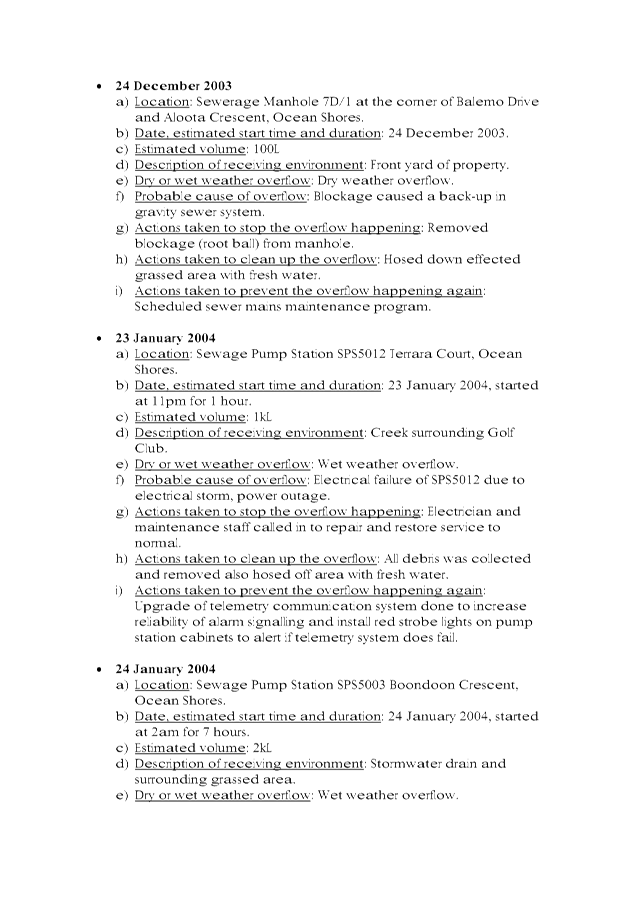
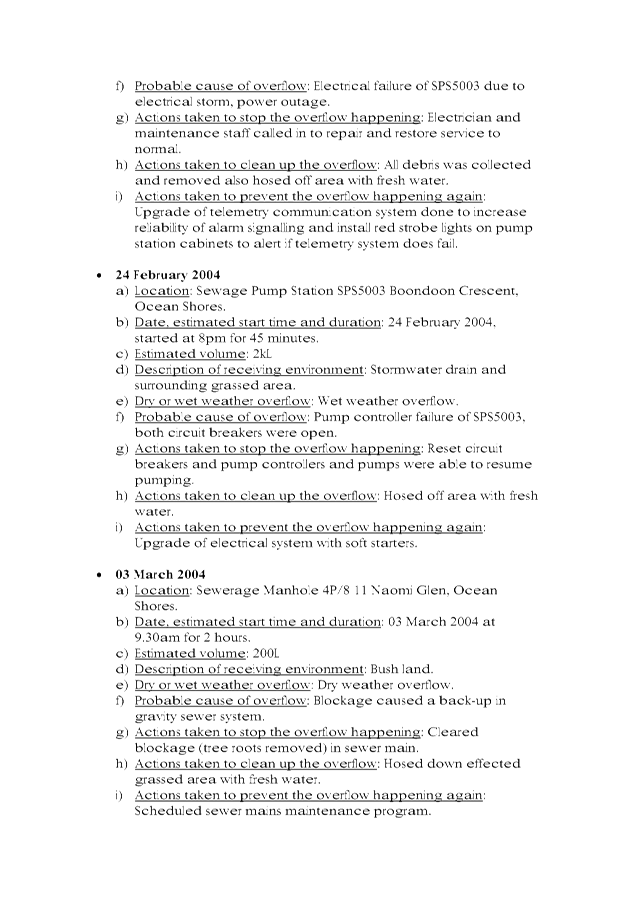
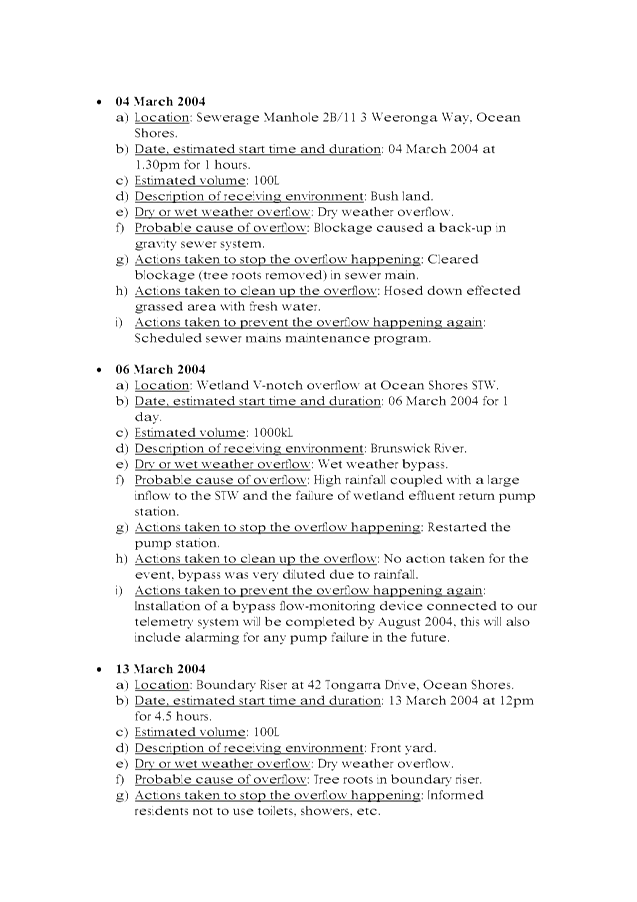
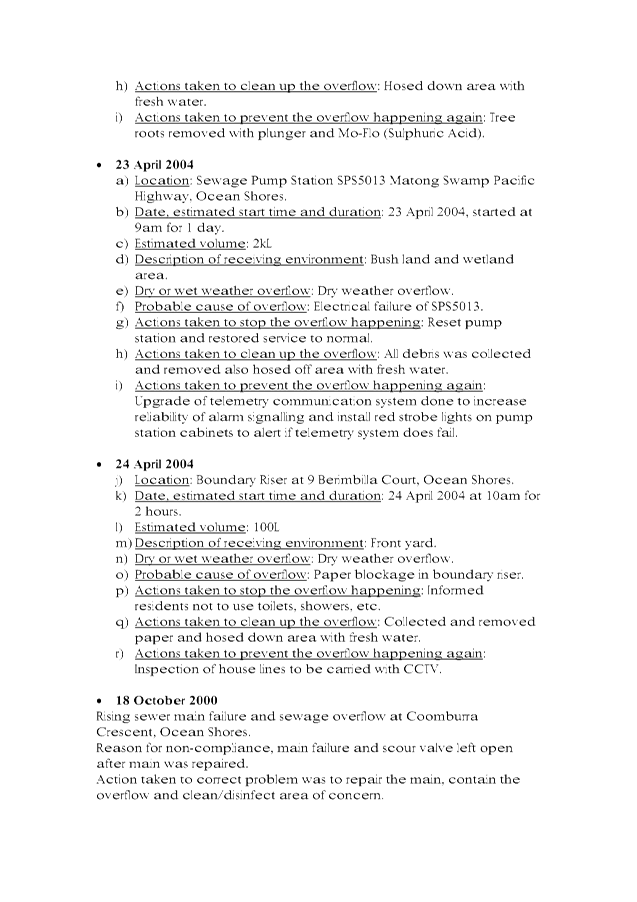
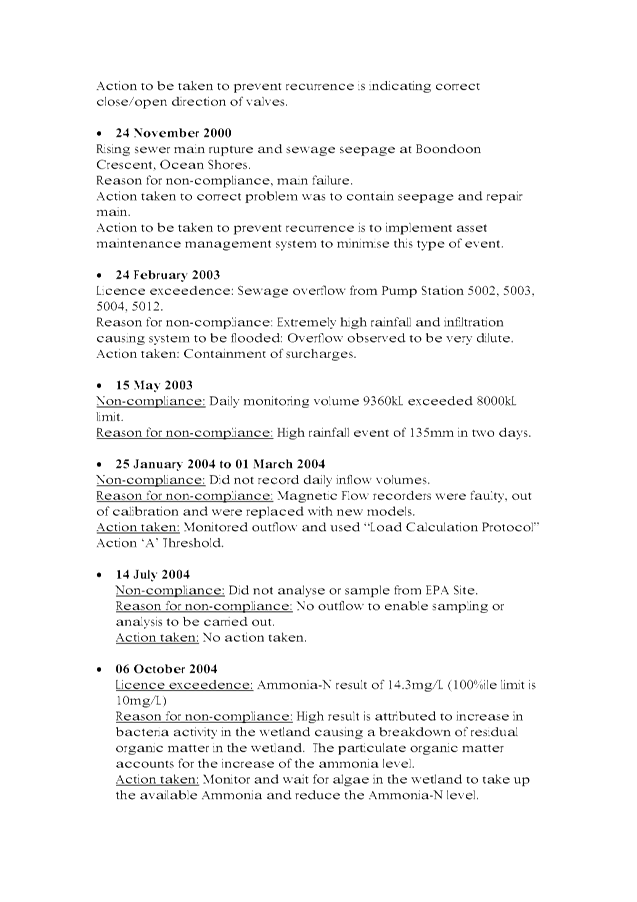
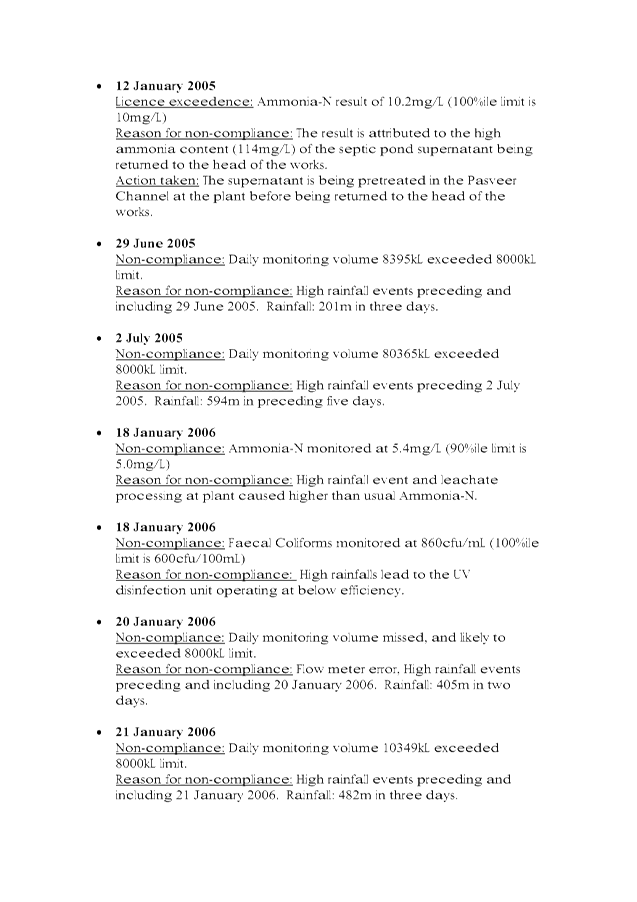
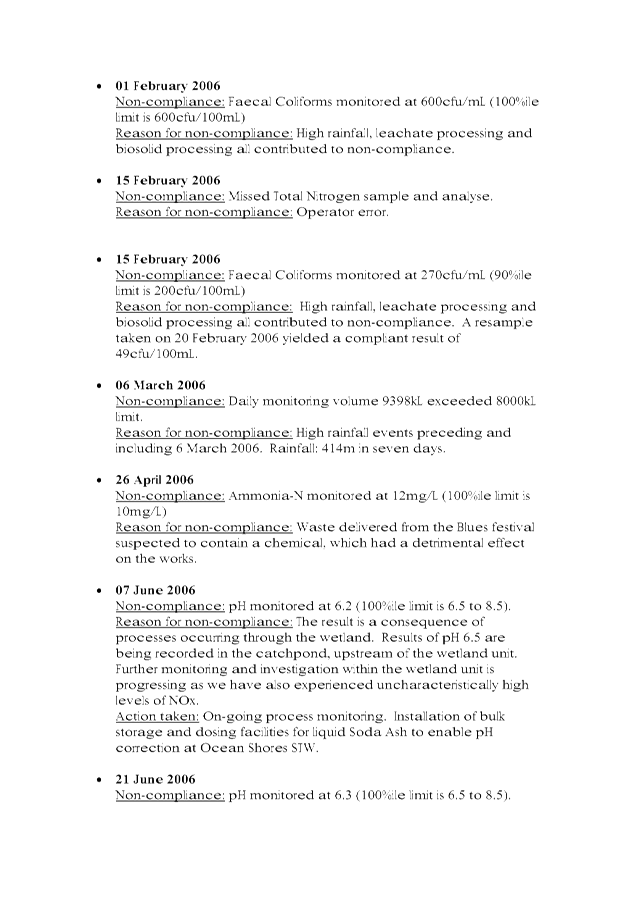
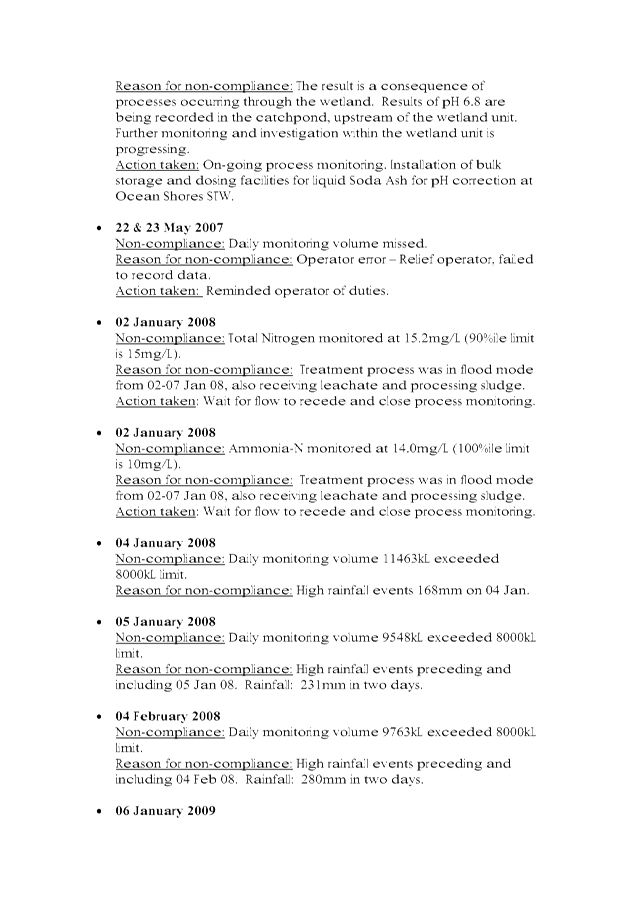
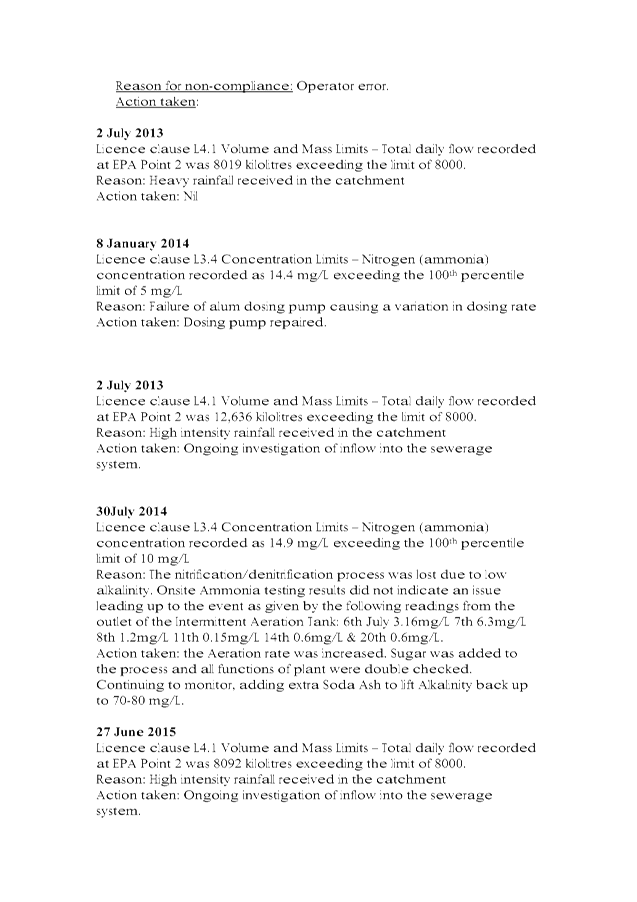
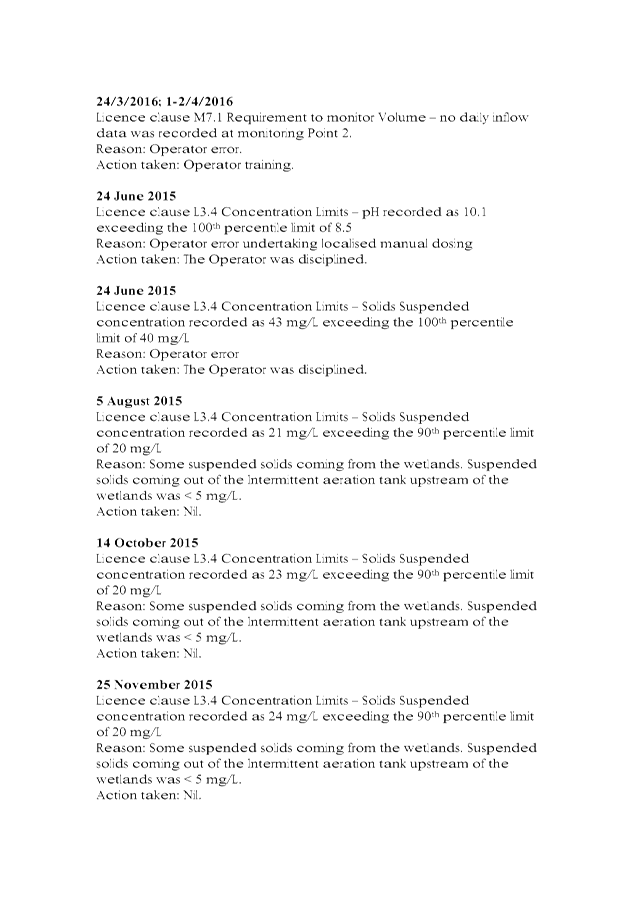
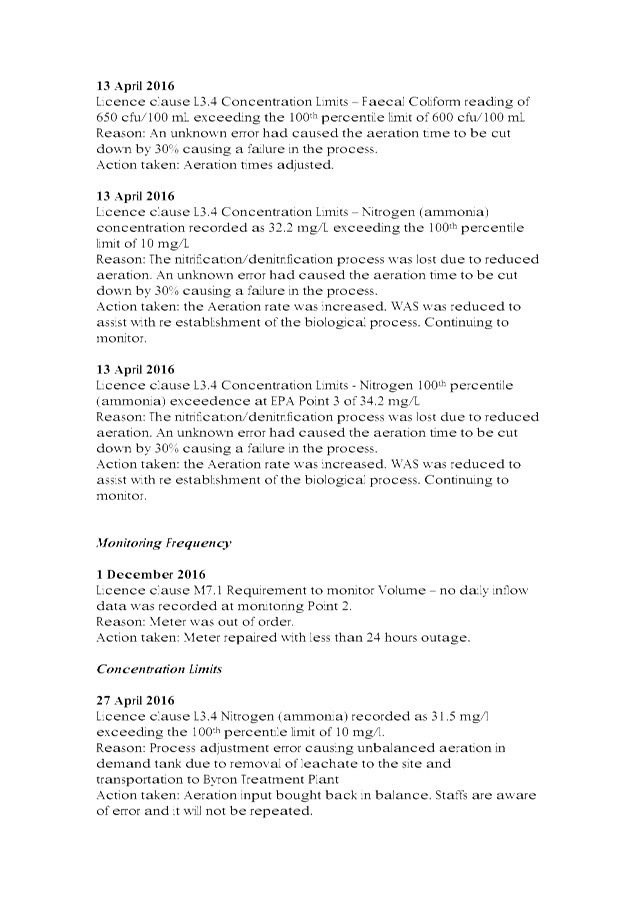
Shores STS EPA Licence 784 Non compliance events 1999 to 2017, E2017/86814 , page 109⇩
Report
On July 27 2017, Mr Alan Dickens as a member of the Water
Sewer and Waste Advisory Committee asked for questions to be tabled at the next
committee meeting. Please find below the questions and responses for each.
How many EPA license breeches including dates and types
of breeches plus location have occurred at Ocean Shores Treatment Plant?
Please refer to the attached file for the requested
information.
The upgrading of Ocean Shores sewer pump stations 5004
and 5009, how will this effect the hydraulic load on Ocean
Shores STP?
The upgrades have no effect on the hydraulic loading of the
Ocean Shores STP – 5009 is being retrofitted with a pump to take care of
lower flows, 5004 renewal is for the civil structures [existing pumps being
utilised].
Why when asked by a member of Brunswick Progress
Association in 2016 did the utility manager supply that the Design size for
Ocean Shores STP was 1.9 ML/day when he had a report from GH&D presented in
2005 stating Ocean Shores could only treat 1.1 ML/day?
The Manager Utilities did not have access to the 2005 report
at the time of preparing the response.
The Manager Utilities role was created in 2014/15 and was an
amalgamation of Strategic Planning and Operations of Water and Sewerage under
the one role.
Financial Implications
Nil
Statutory and Policy Compliance Implications
Nil
Staff Reports - Infrastructure Services 4.5 - Attachment 1


Staff Reports - Infrastructure Services 4.6
Report No. 4.6 Items
For the Committee Requested by Duncan Dey
Directorate: Infrastructure
Services
Report
Author: Peter
Rees, Manager Utilities
File No: I2017/1269
Theme: Community Infrastructure
Sewerage Services
Summary:
This report has presented 2 topics for discussion as
requested by committee member Duncan Dey.
|
RECOMMENDATION:
That the Committee note the report.
|
Attachments:
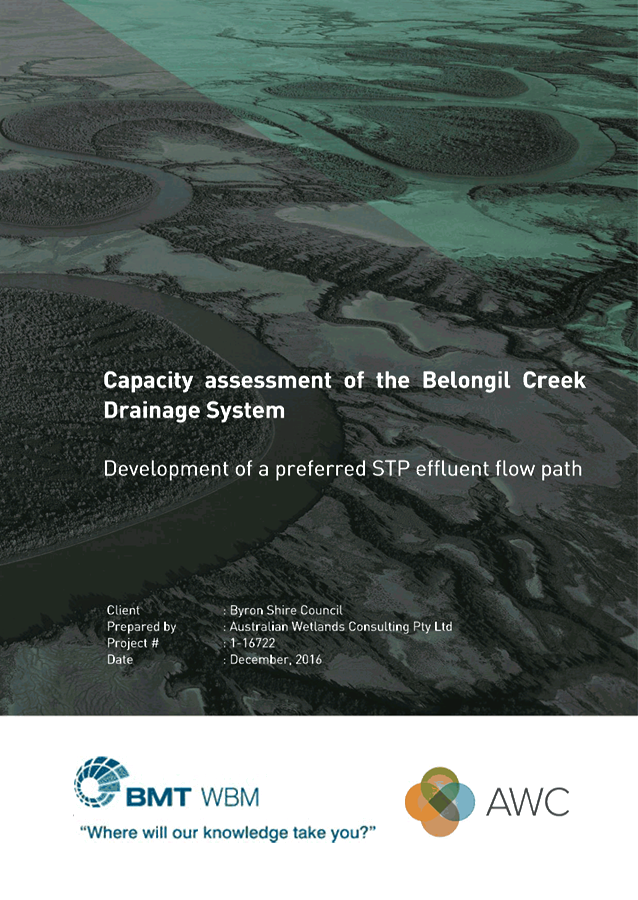
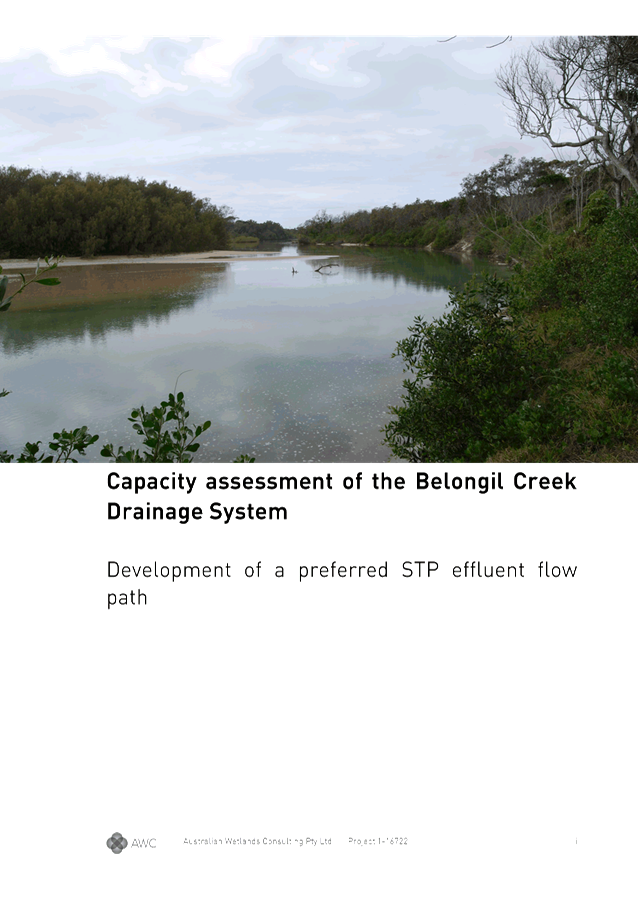
1 Capacity
Assessment of the Belongil Creek Drainage System Report No
16722b_ByronSTP_AlternativeFlowPath_BSC_opt, E2017/13761
, page 110⇩ 
Report
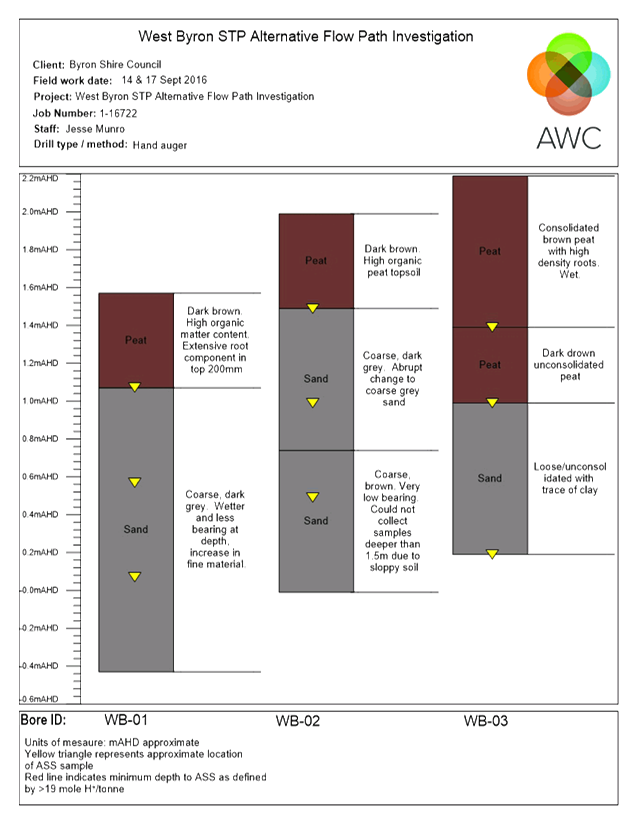
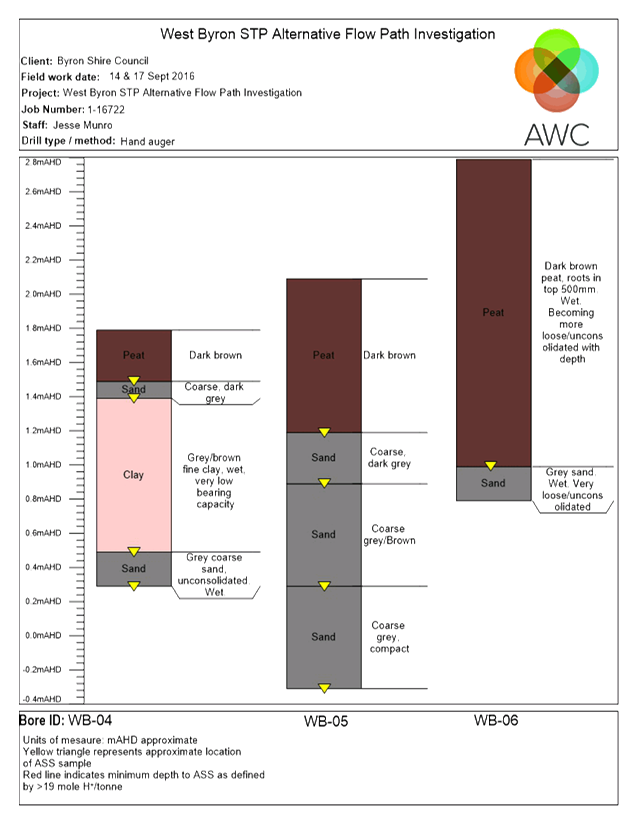
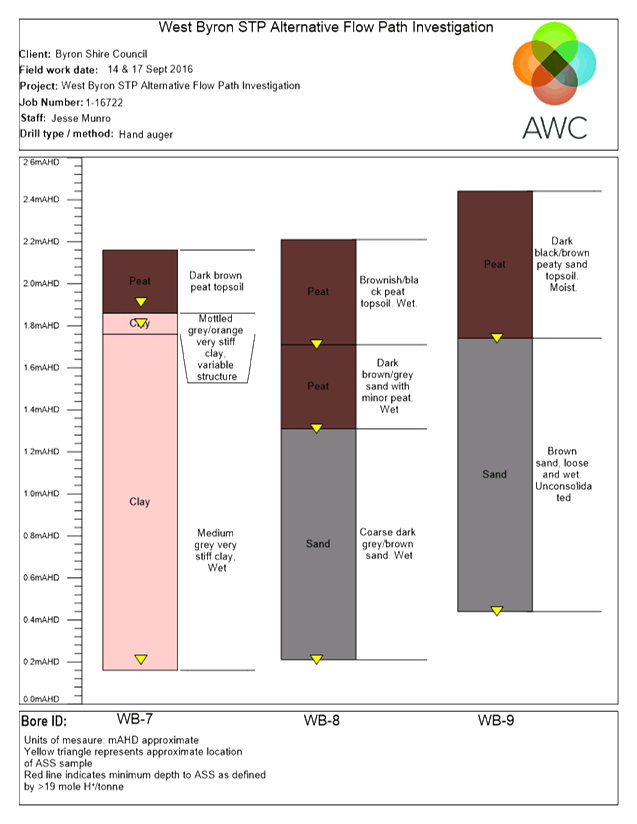
It was requested by committee member Duncan Dey to table the
following items at the next Water Waste and Sewer Advisory Committee meeting.
1. the capacity (and its
exceedence) of the receiving environment downstream from Byron STP;
2. the
comparative values of increasing size of STPs versus reducing stormwater sent
to them, and for Brunz Valley STP in particular.
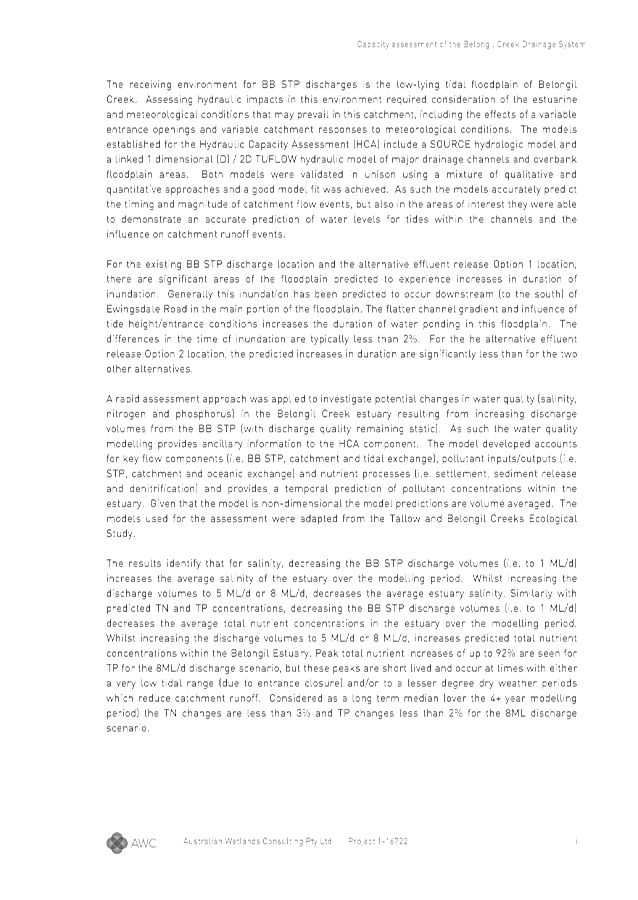
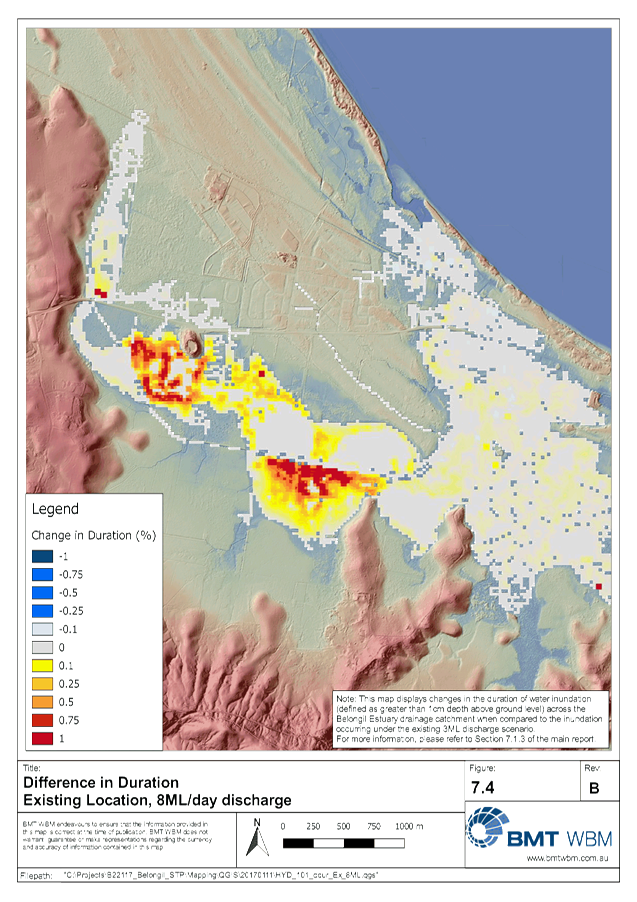
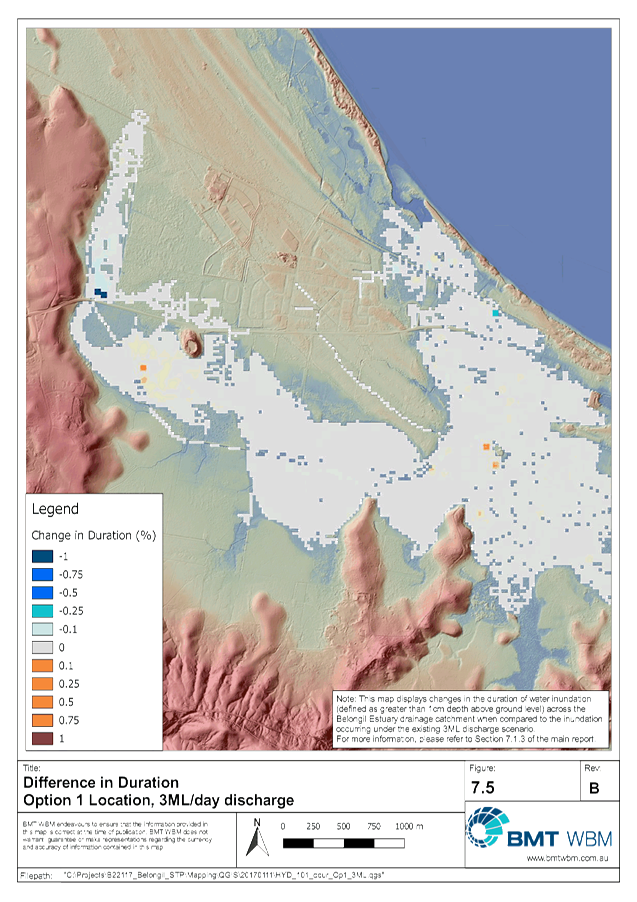
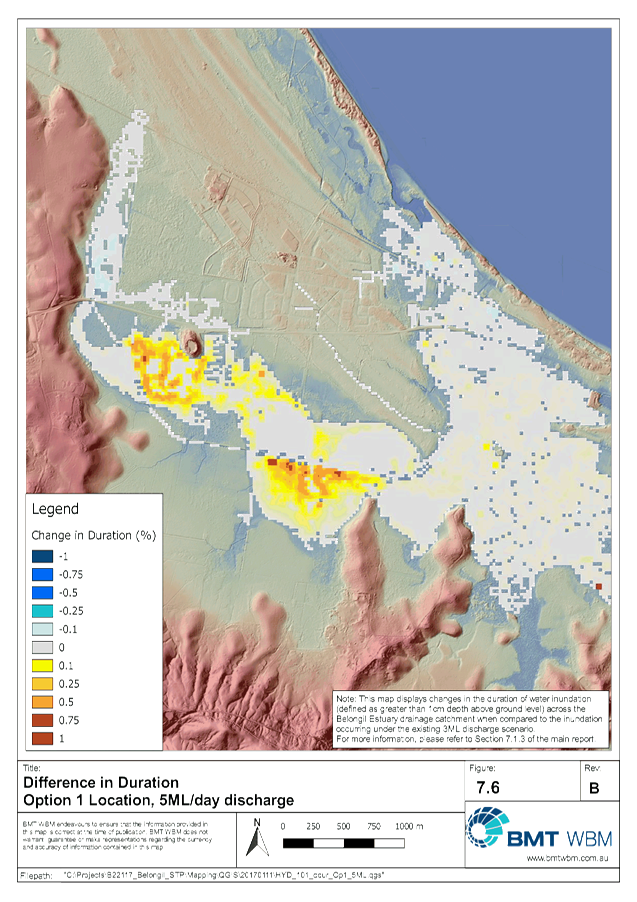
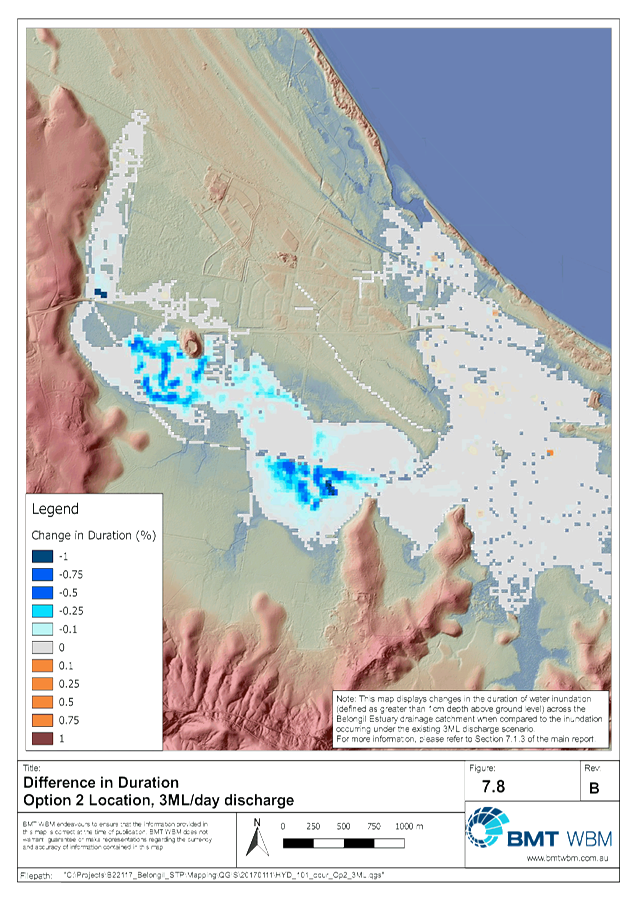
In relation to question 1, Council initiated a 12 month study
on the sustainable capacity of the Belongil. The resulting report was presented
to the Coastal Estuary Catchment Panel at its March 2017 meeting.
The study found the capacity of the Belongil was adequate to
undertake planning an upgrade of the Byron Bay Sewage Plant to 10 ML/day
average dry weather flow. On this basis it could be concluded there have been
no exceedences of the receiving environment downstream of the Byron Bay STP.
The study’s report is attached for information.
For the second item, it is proposed this item be discussed
at the meeting.
Financial Implications
Nil
Statutory and Policy Compliance Implications
Nil
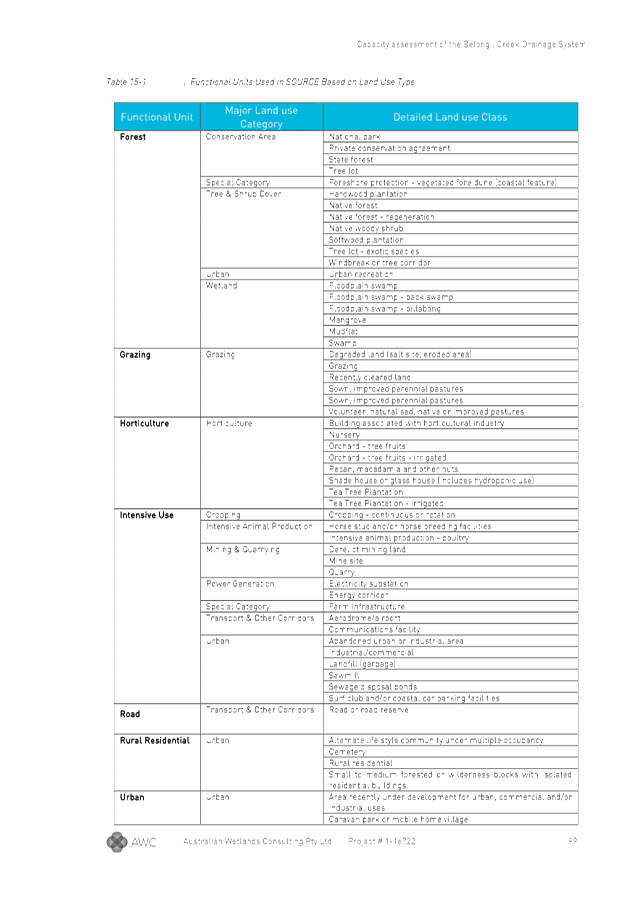
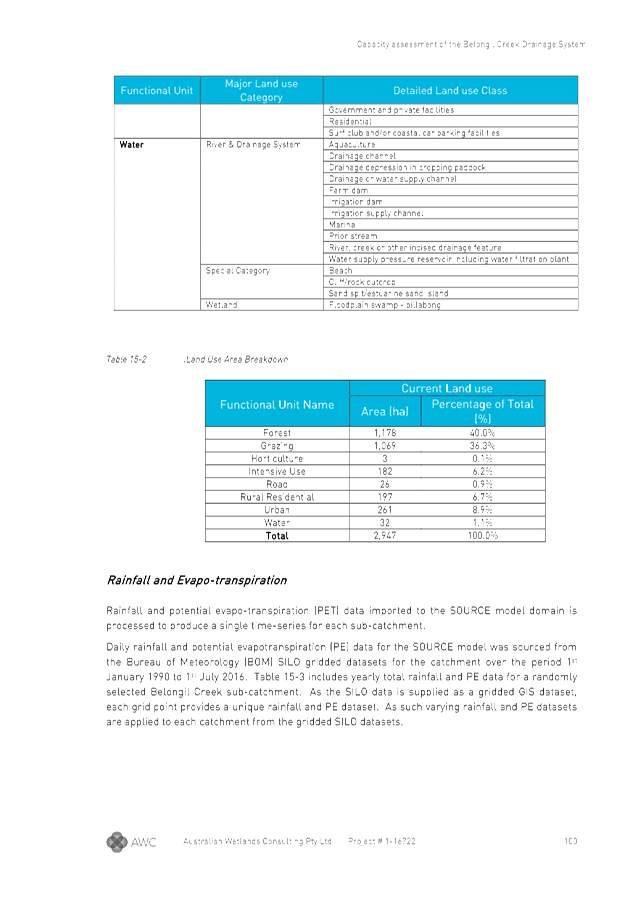
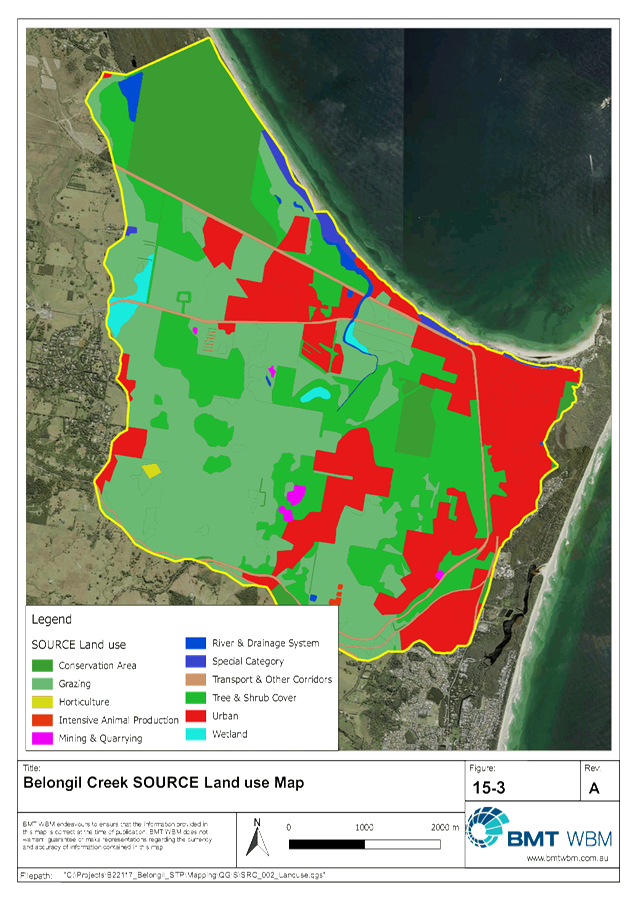
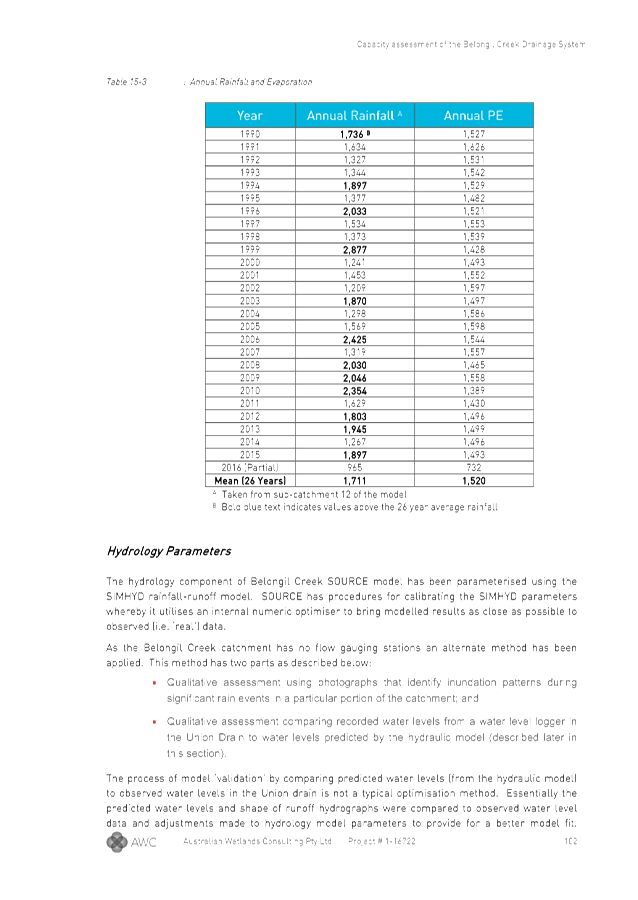
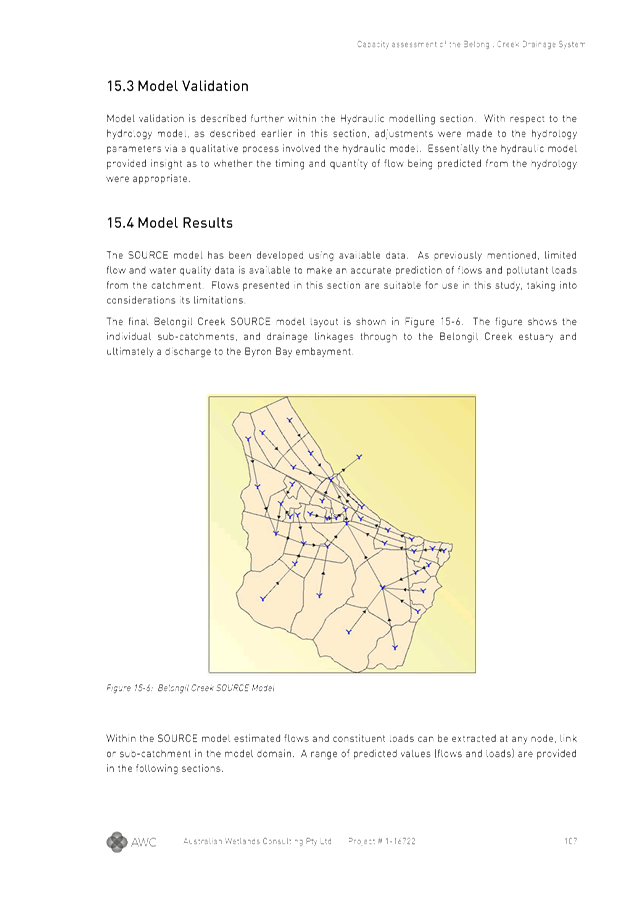
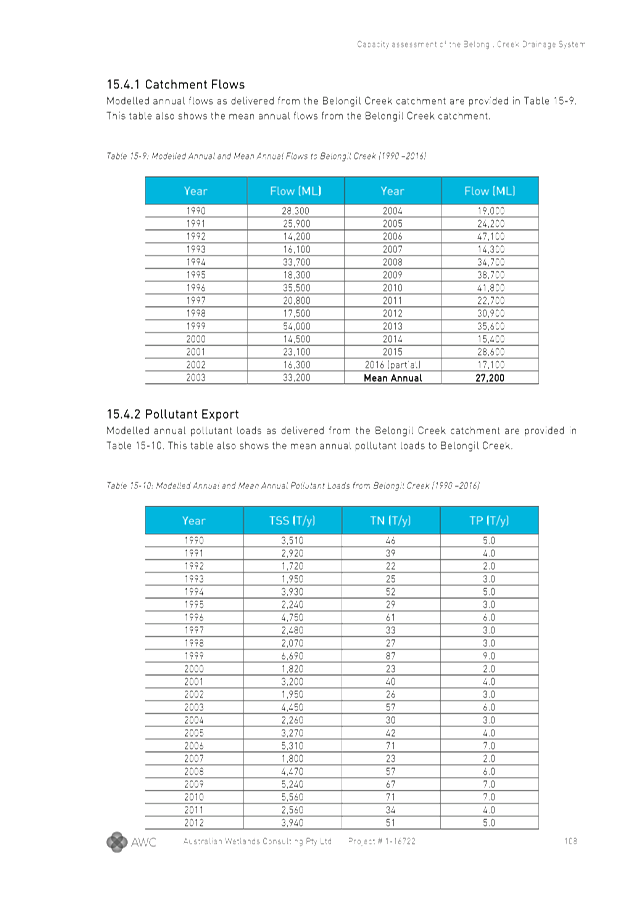
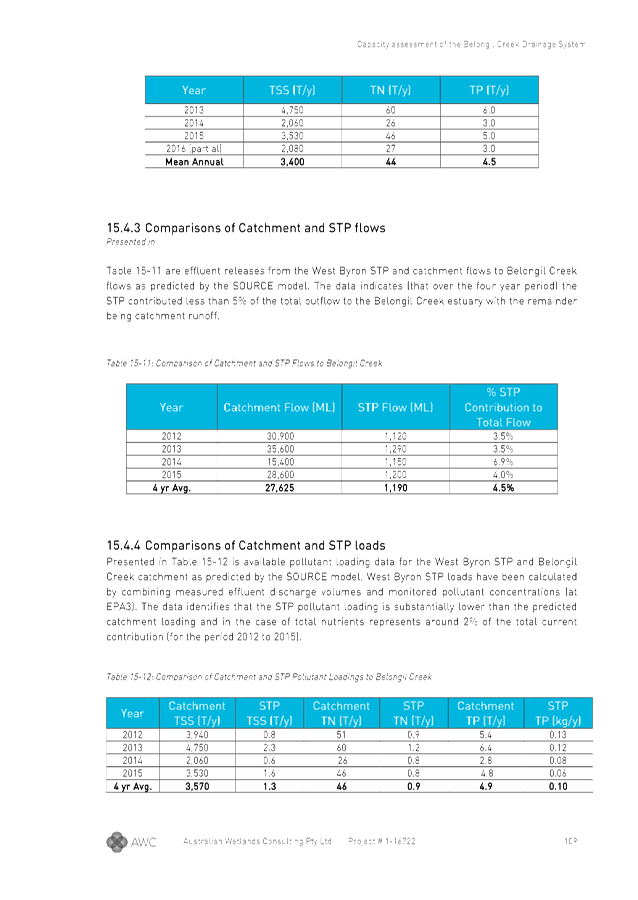
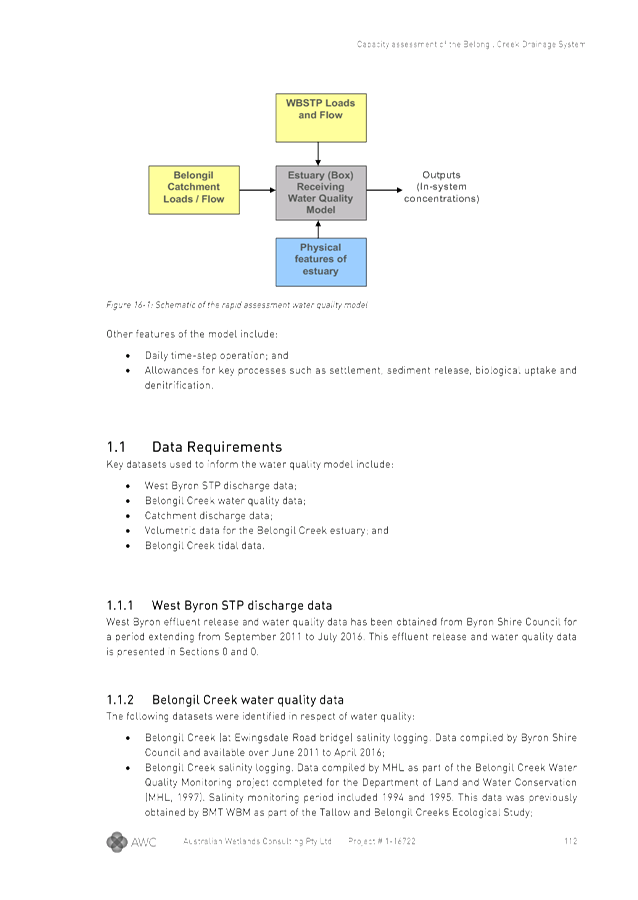
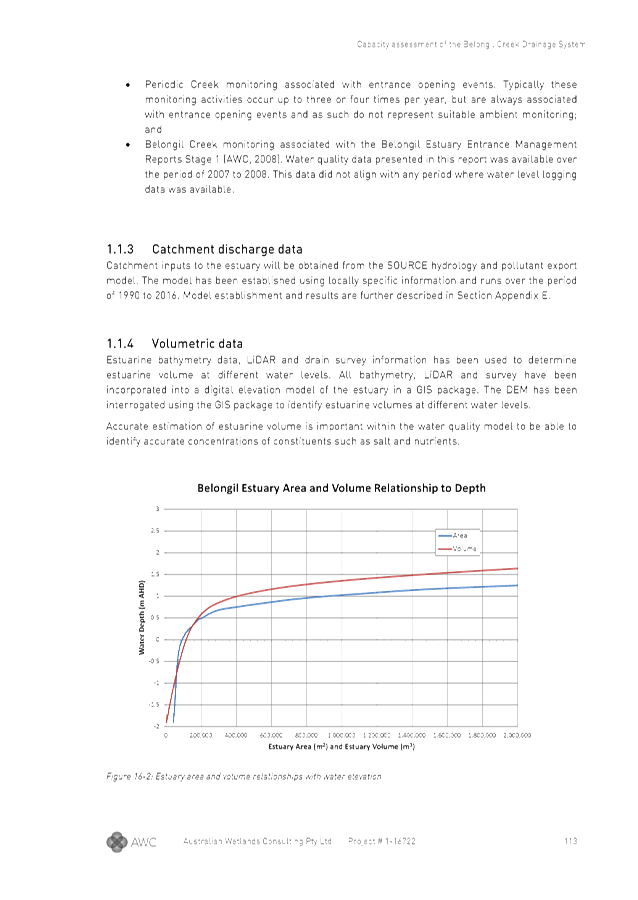
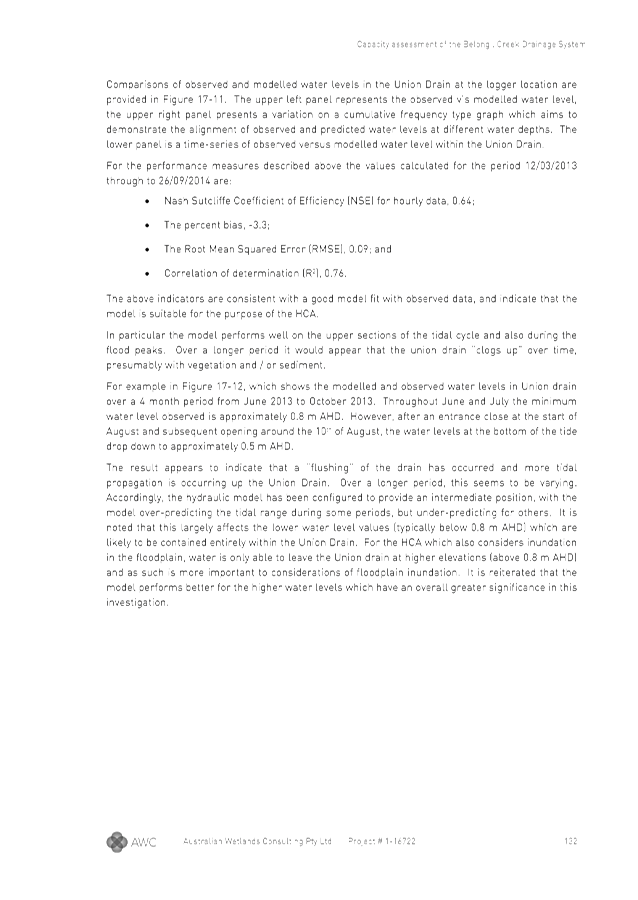
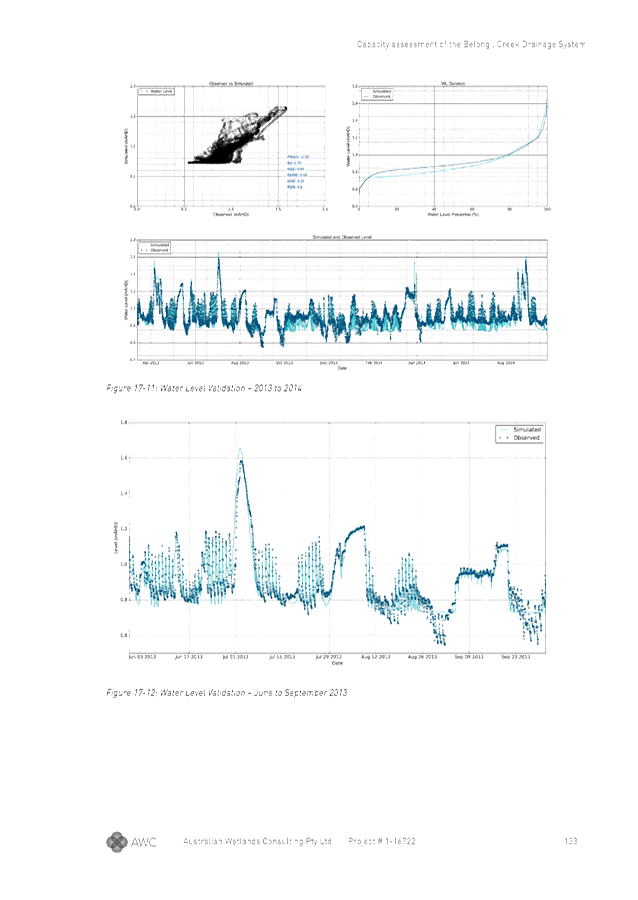
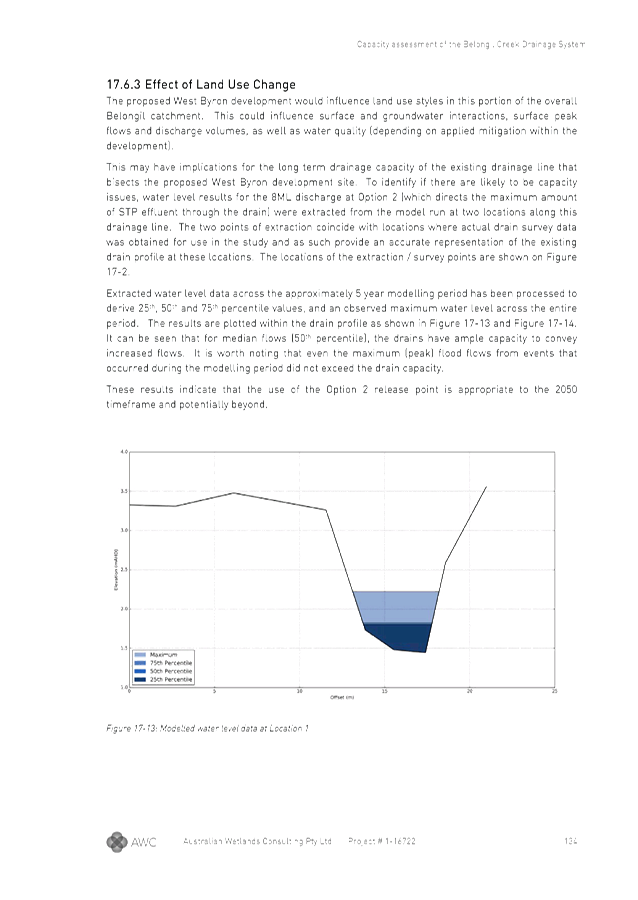
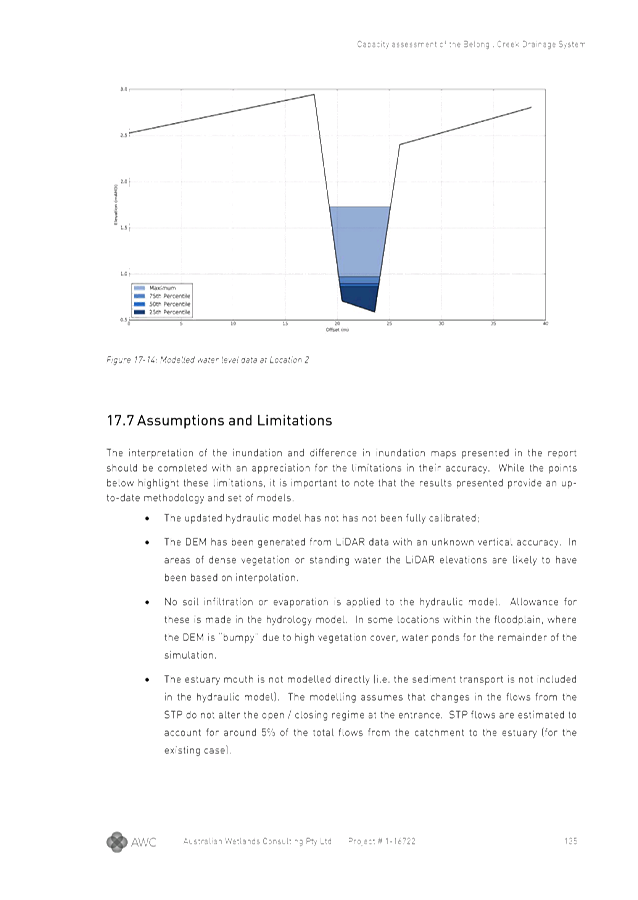
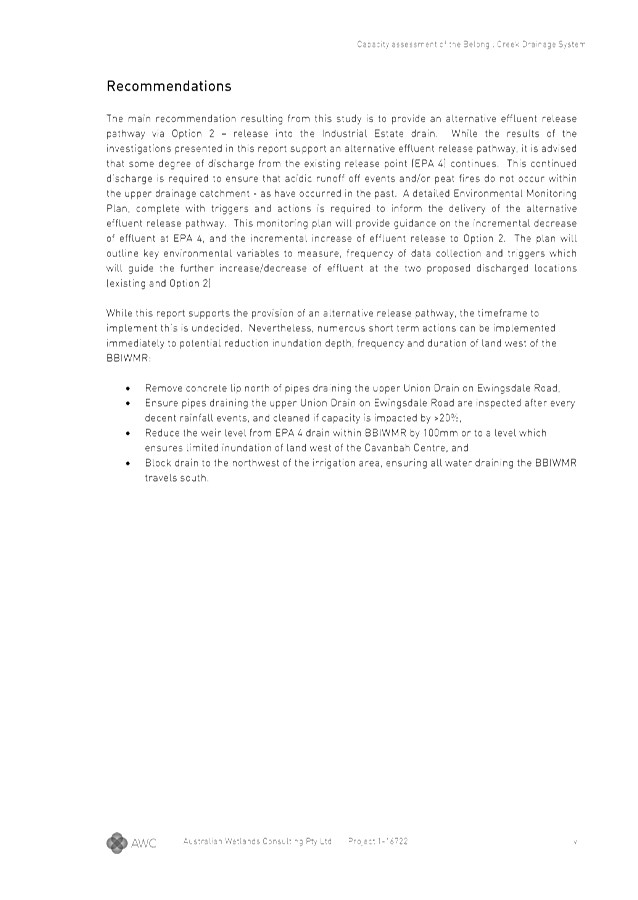
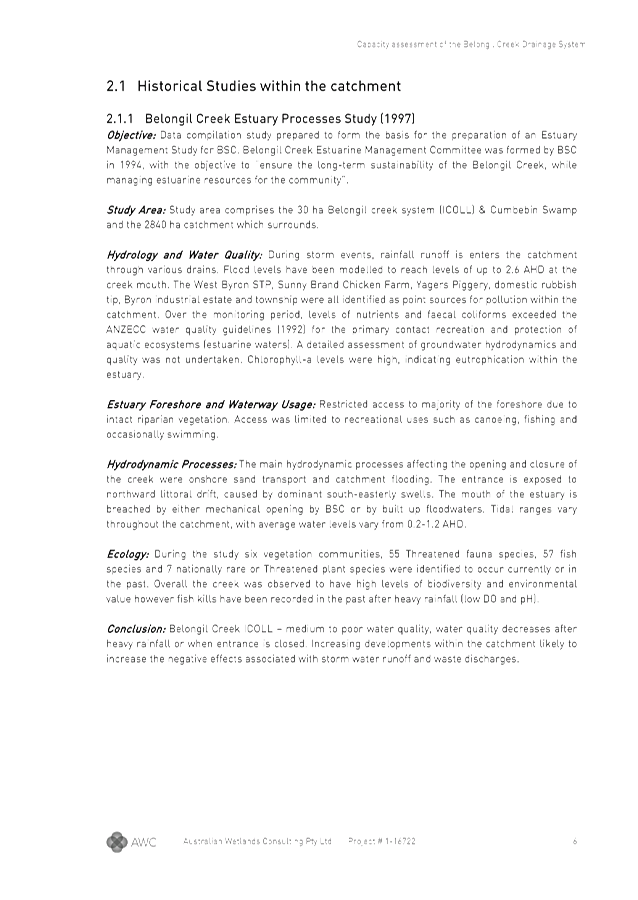
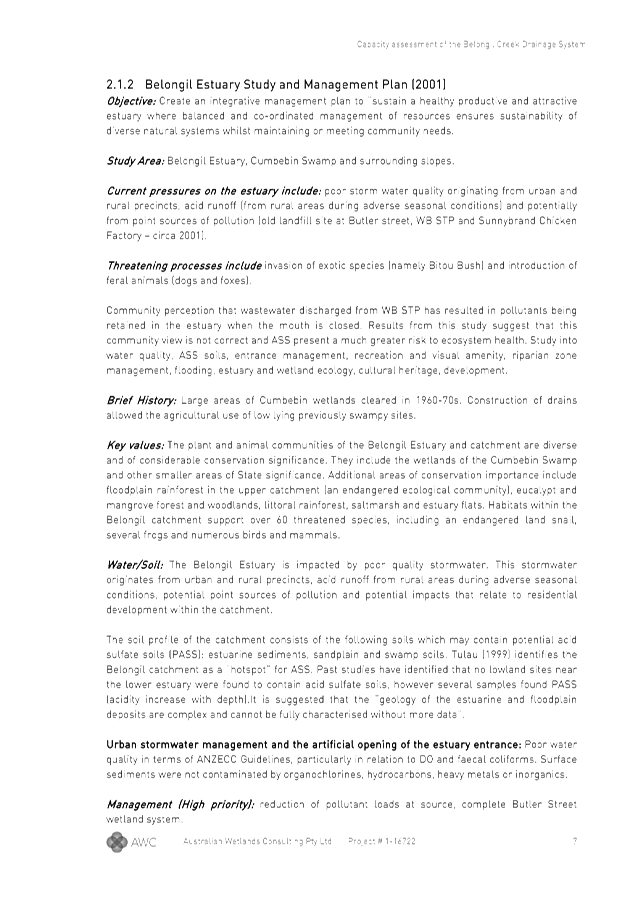
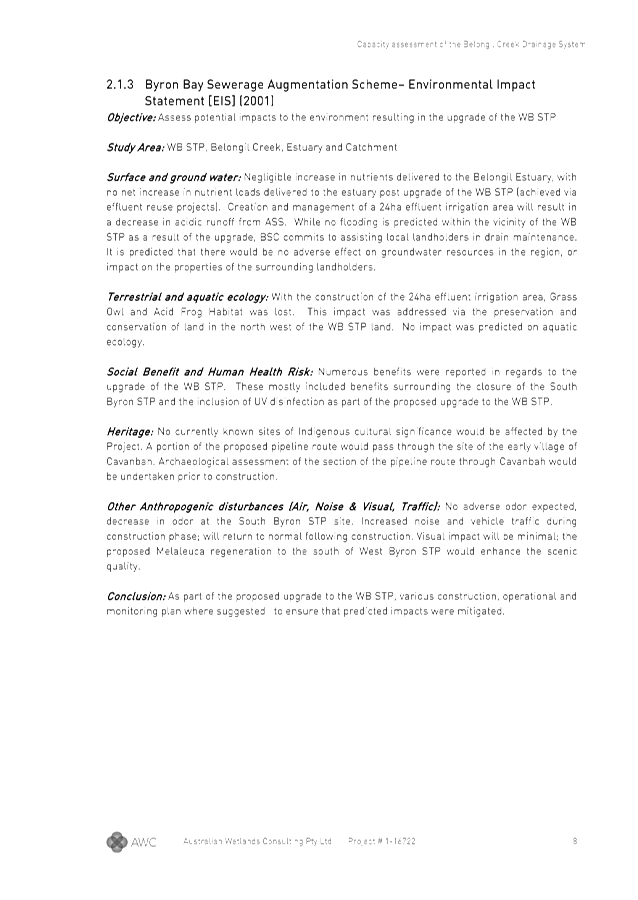
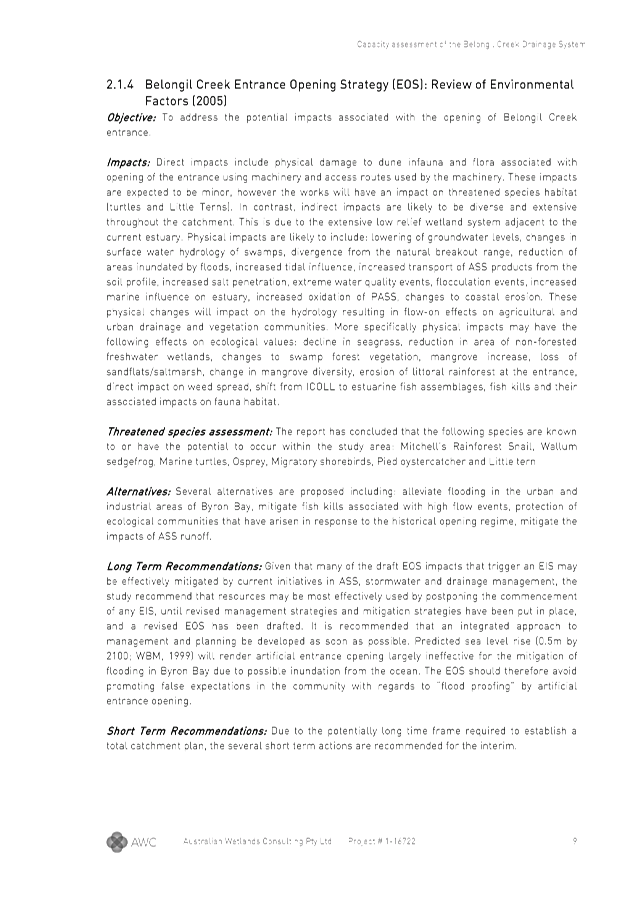
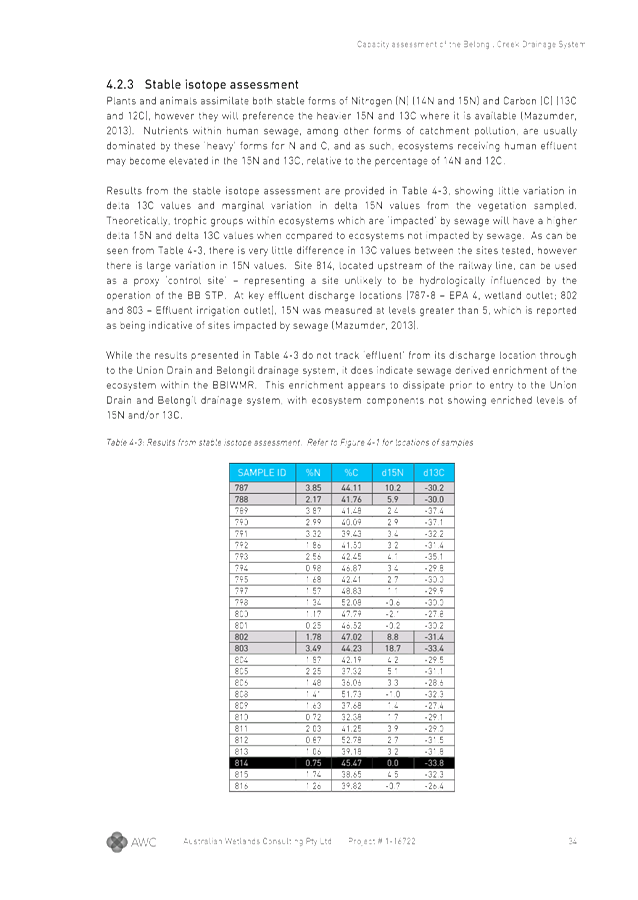
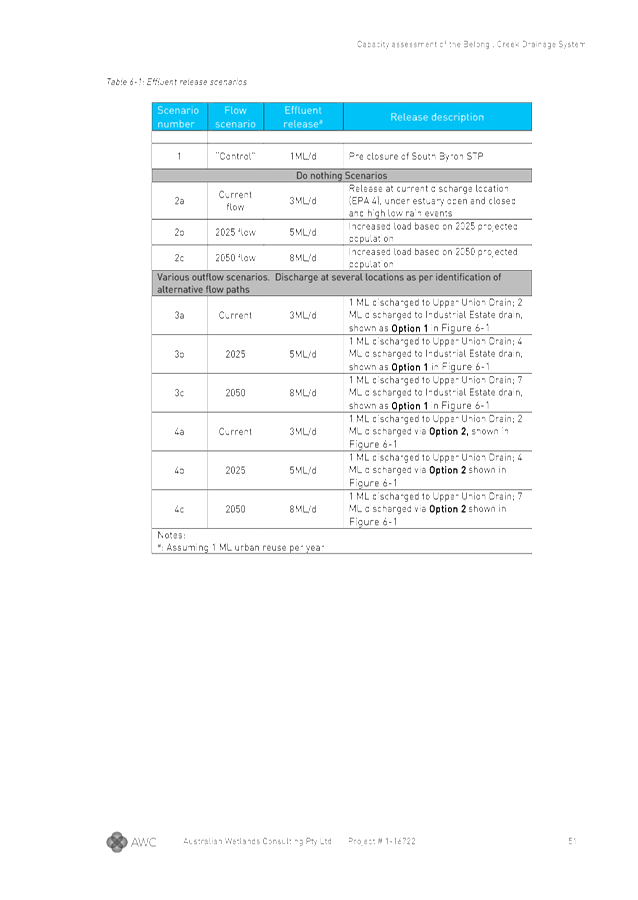
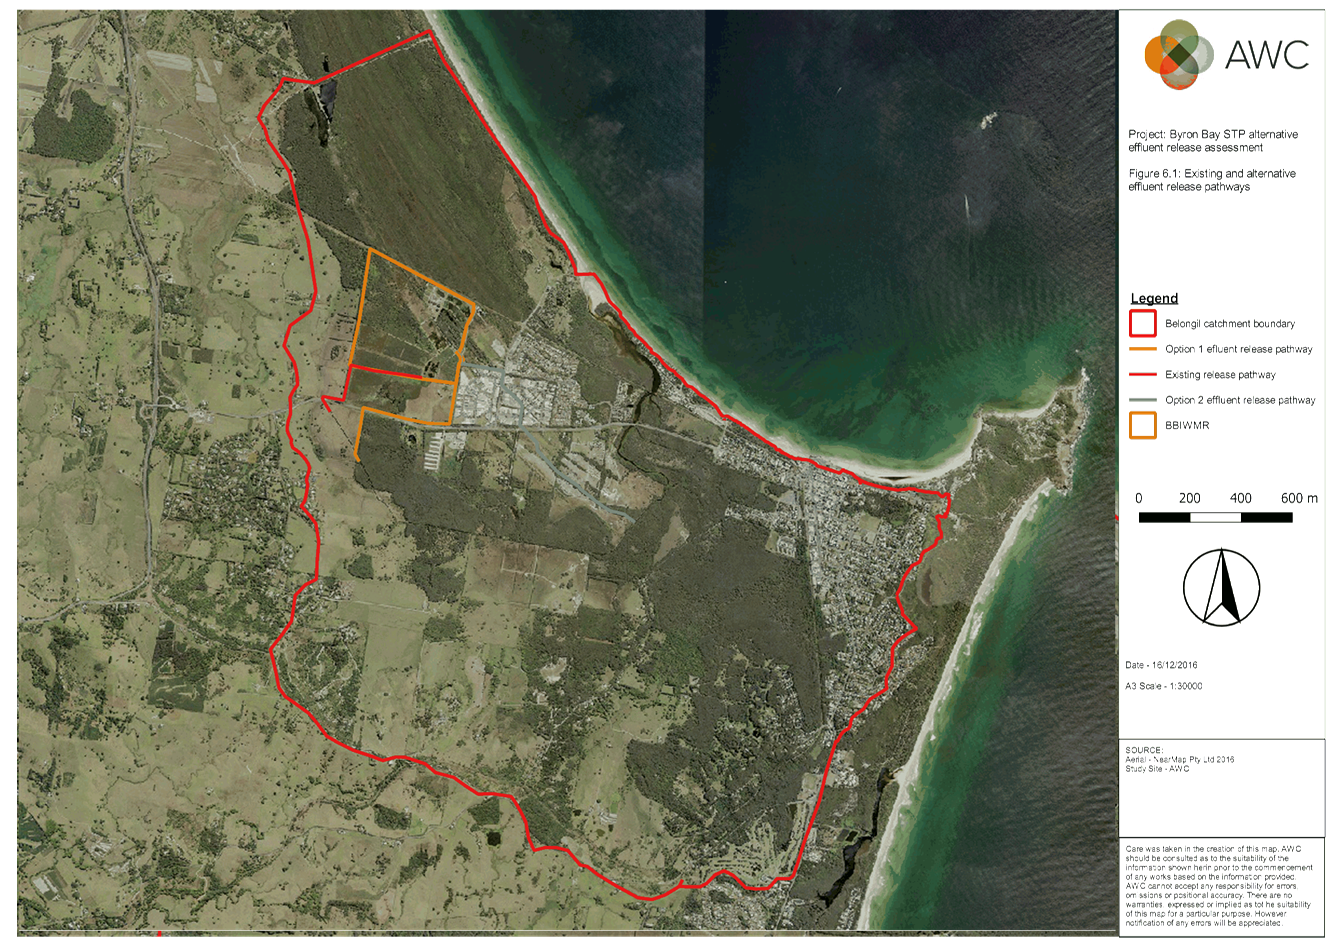
Staff Reports - Infrastructure Services 4.6 - Attachment 1
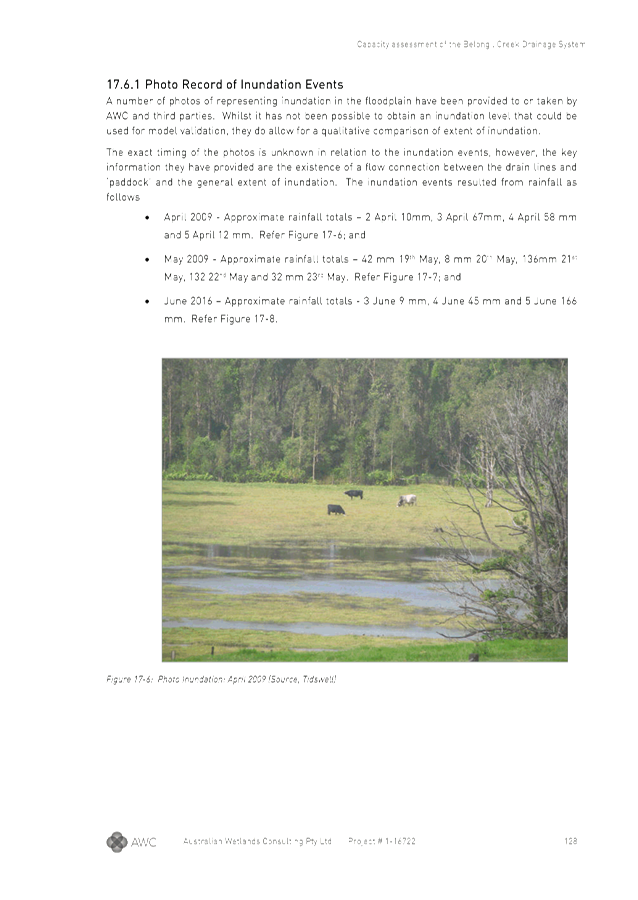
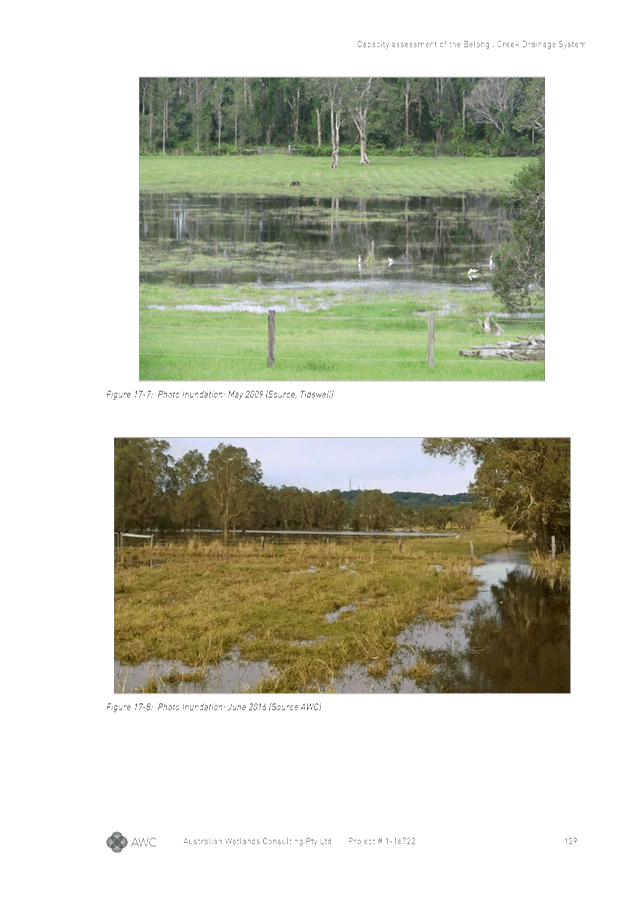
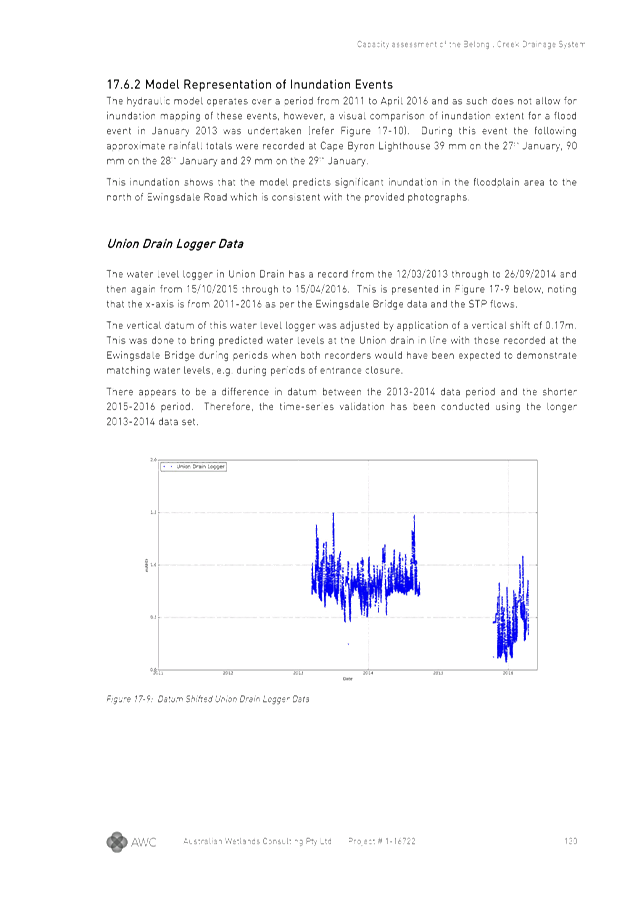
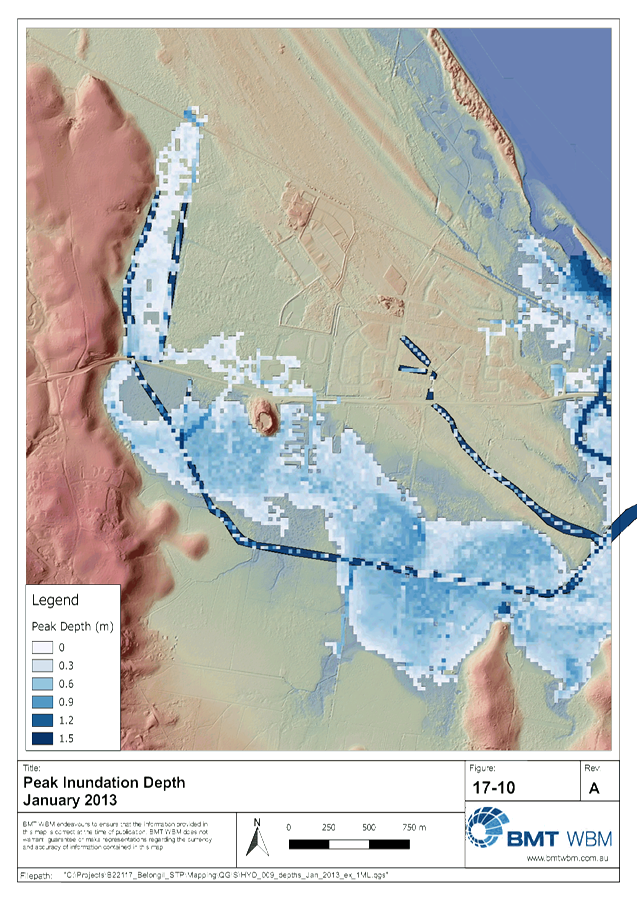
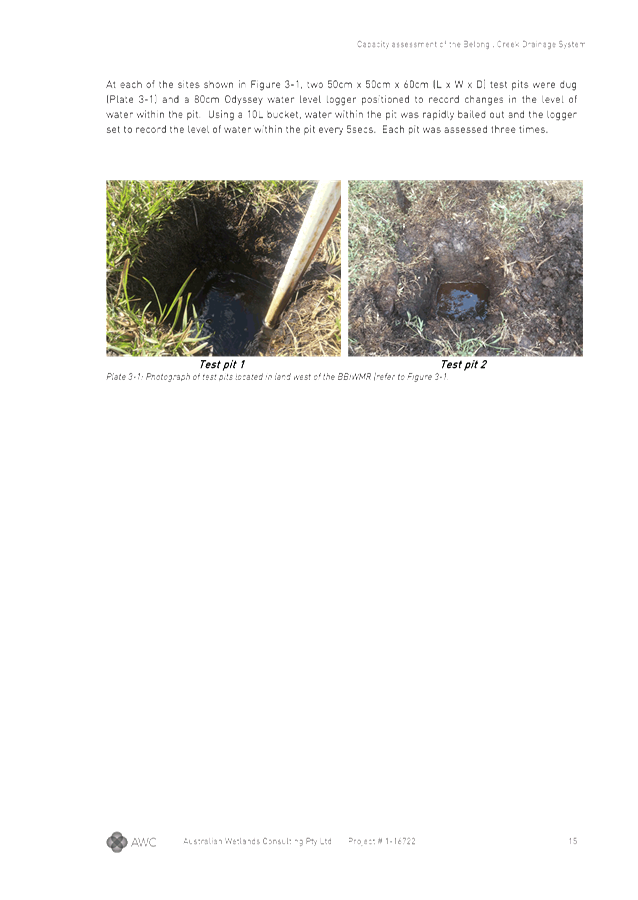
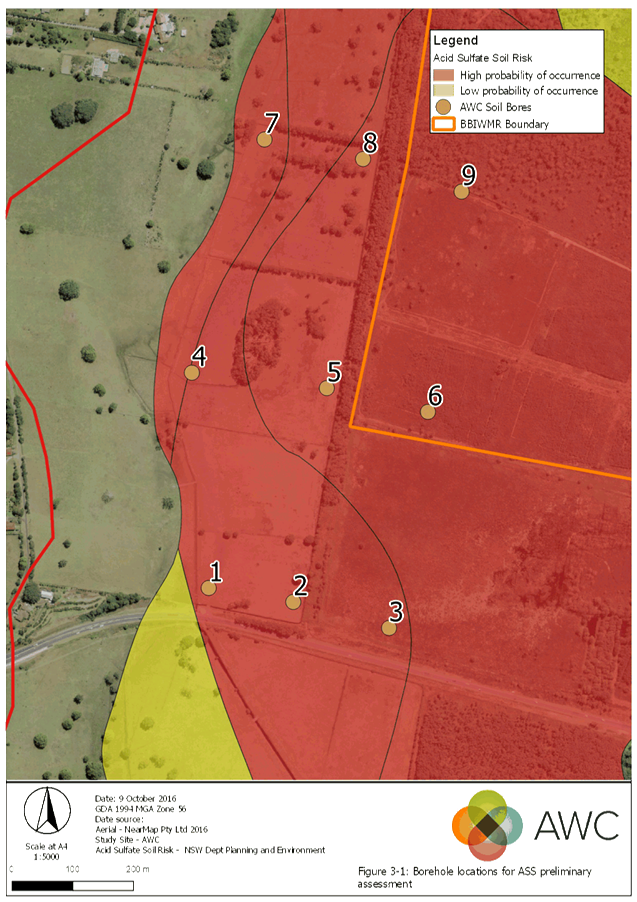
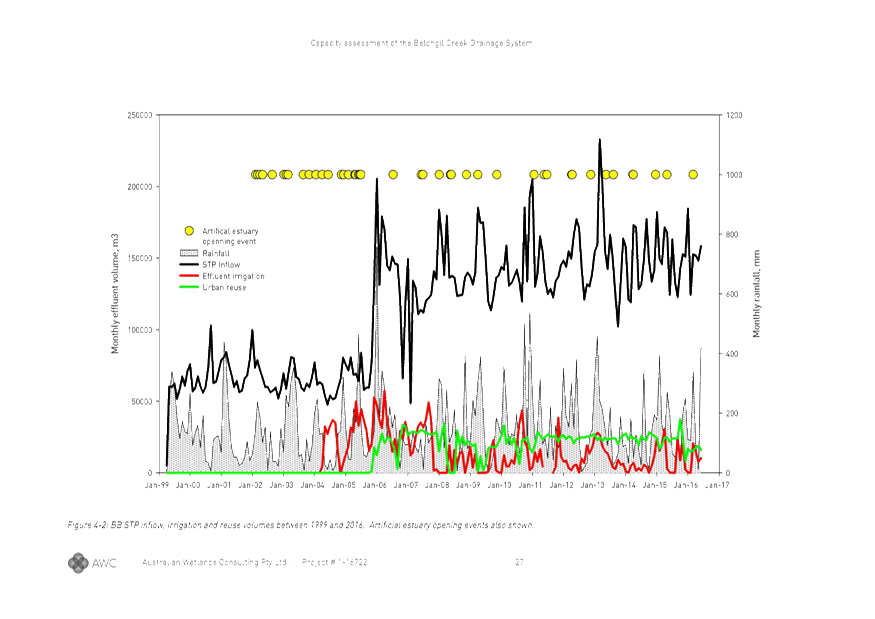
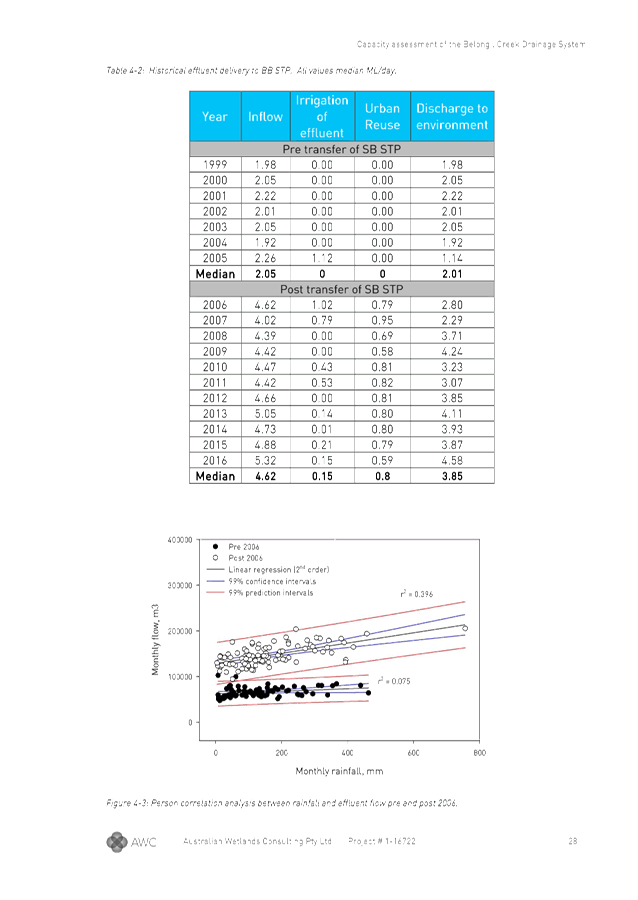
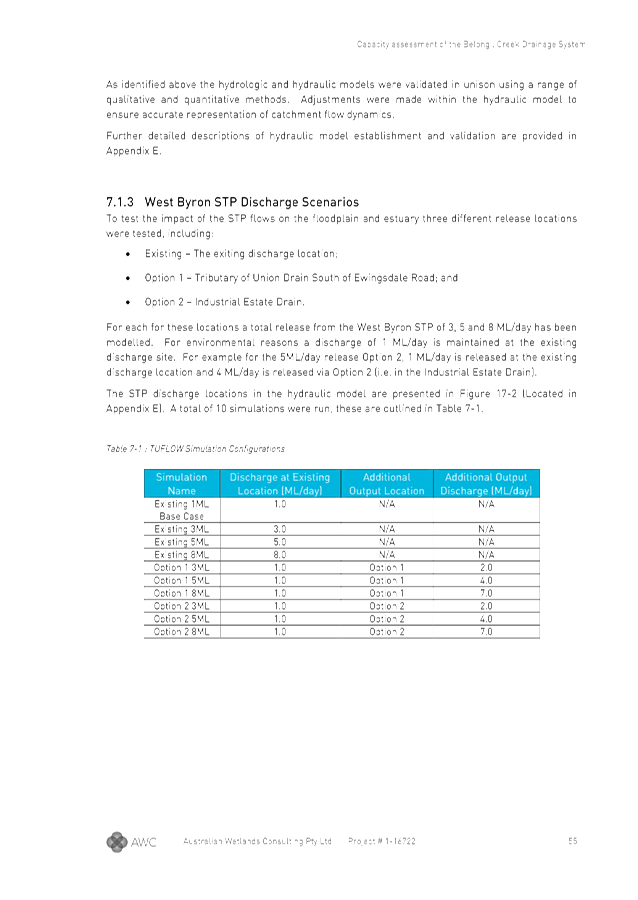
Staff Reports - Infrastructure Services 4.6 - Attachment 1
Staff Reports - Infrastructure Services 4.6 - Attachment 1
Staff Reports - Infrastructure Services 4.6 - Attachment 1
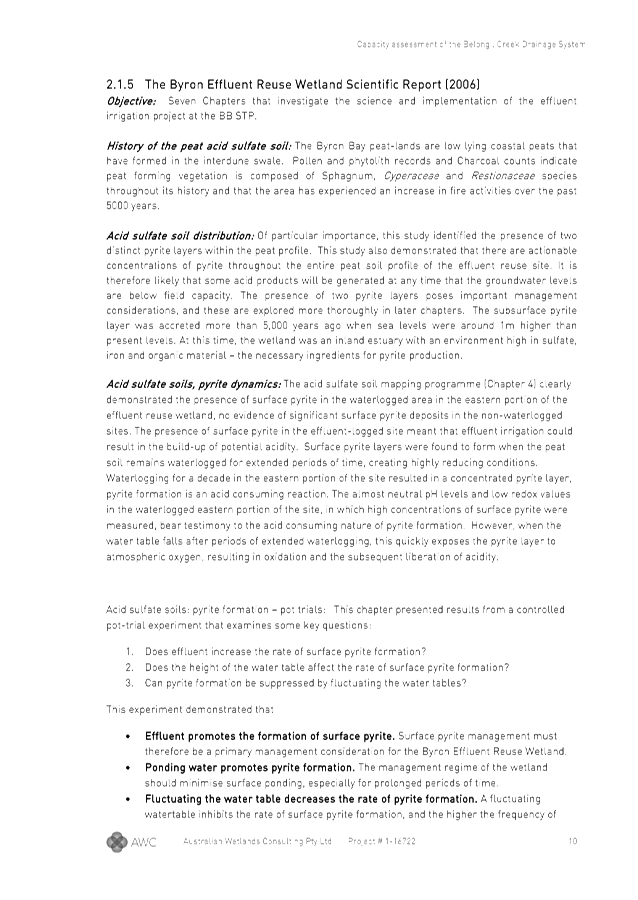
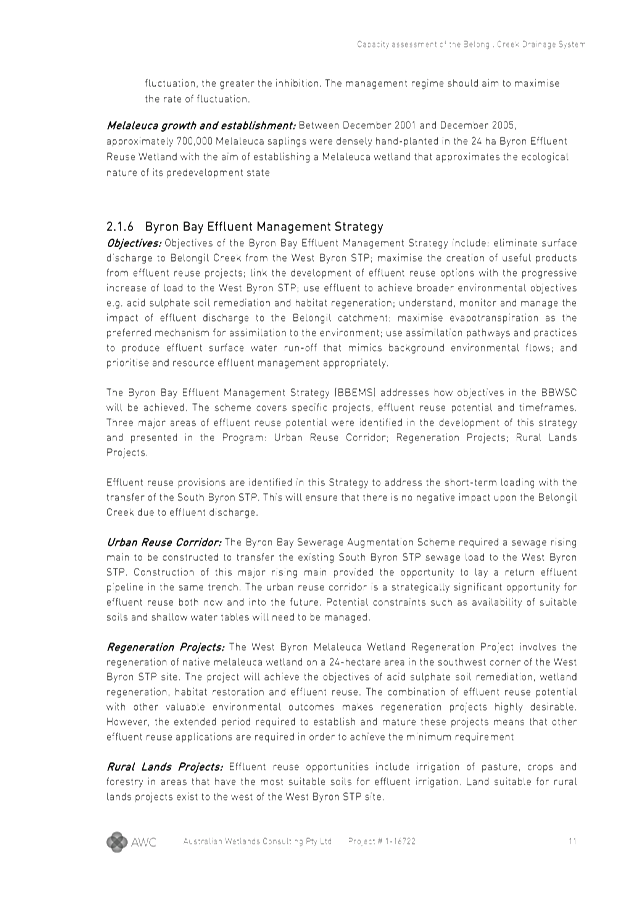
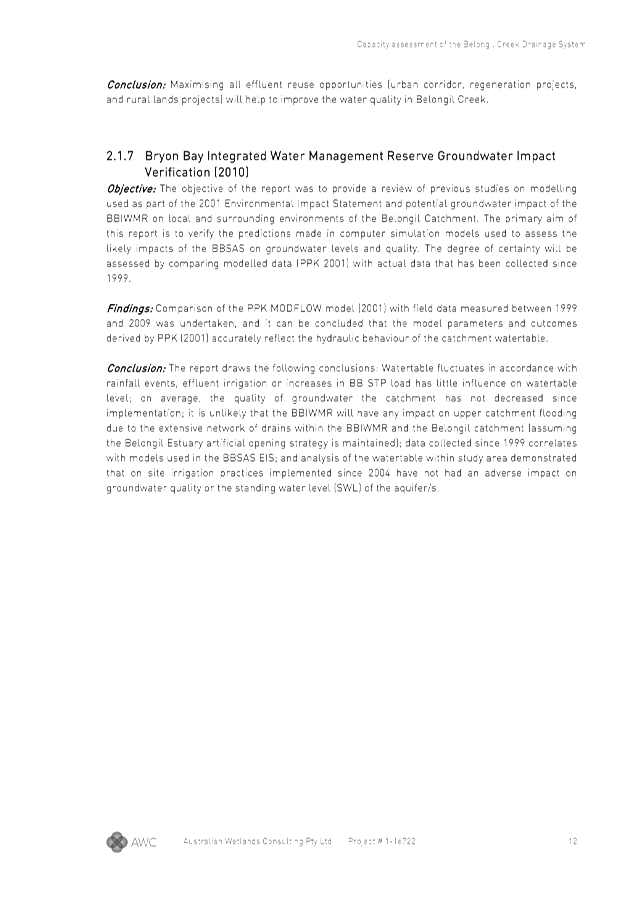
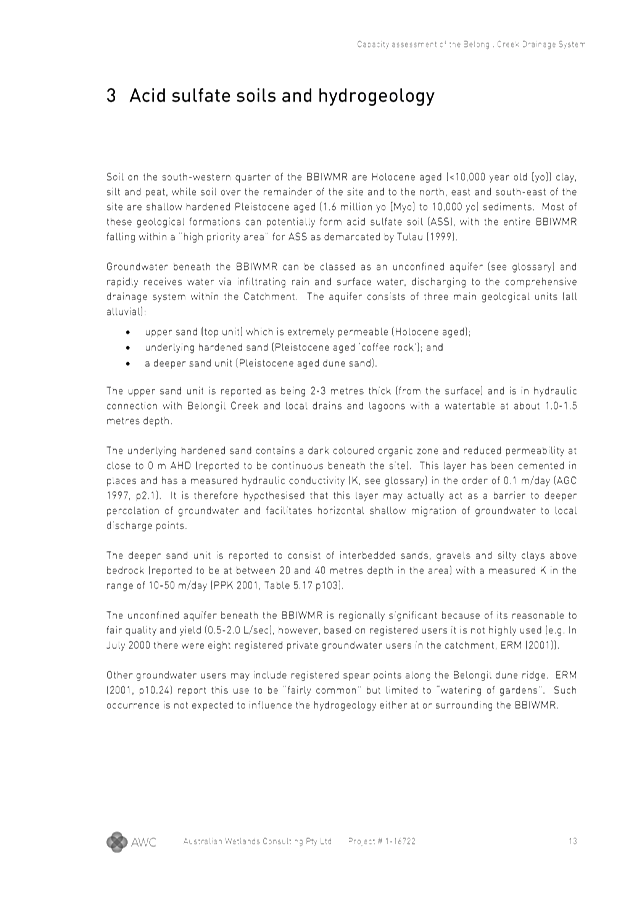
Staff Reports - Infrastructure Services 4.6 - Attachment 1
Staff Reports - Infrastructure Services 4.6 - Attachment 1
Staff Reports - Infrastructure Services 4.6 - Attachment 1
Staff Reports - Infrastructure Services 4.6 - Attachment 1
Staff Reports - Infrastructure Services 4.6 - Attachment 1
Staff Reports - Infrastructure Services 4.6 - Attachment 1
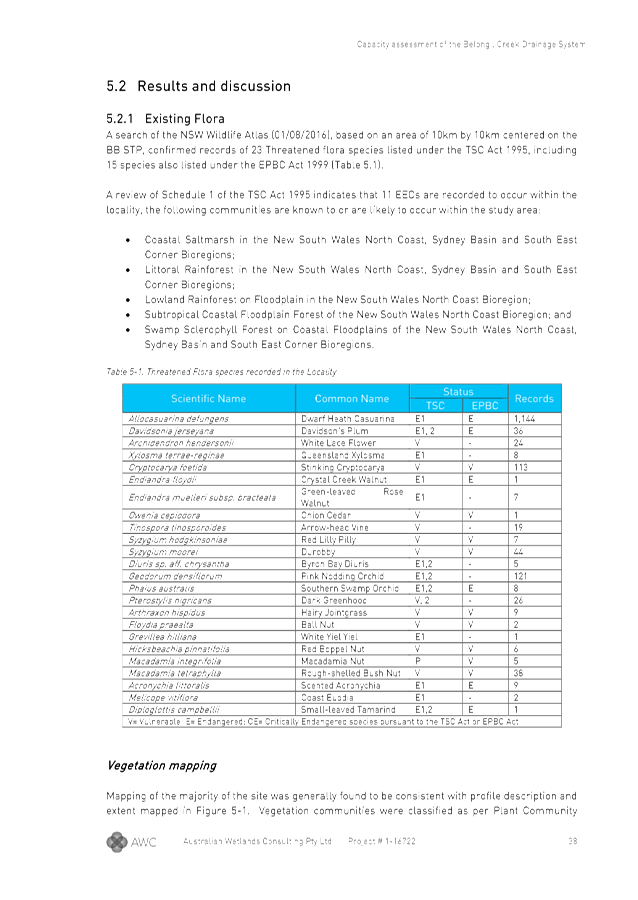
Staff Reports - Infrastructure Services 4.6 - Attachment 1
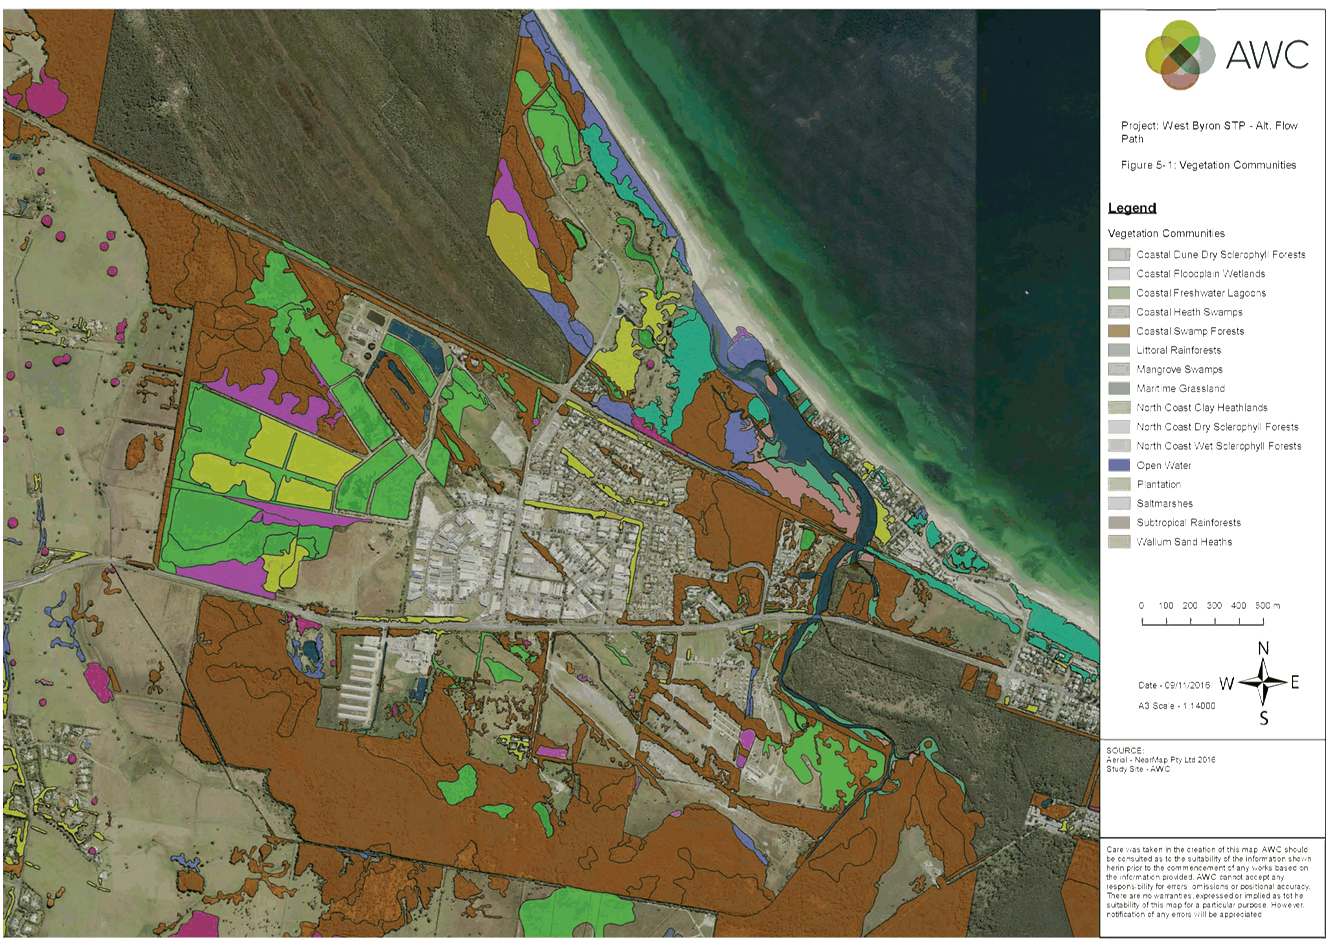

Staff Reports - Infrastructure Services 4.6 - Attachment 1
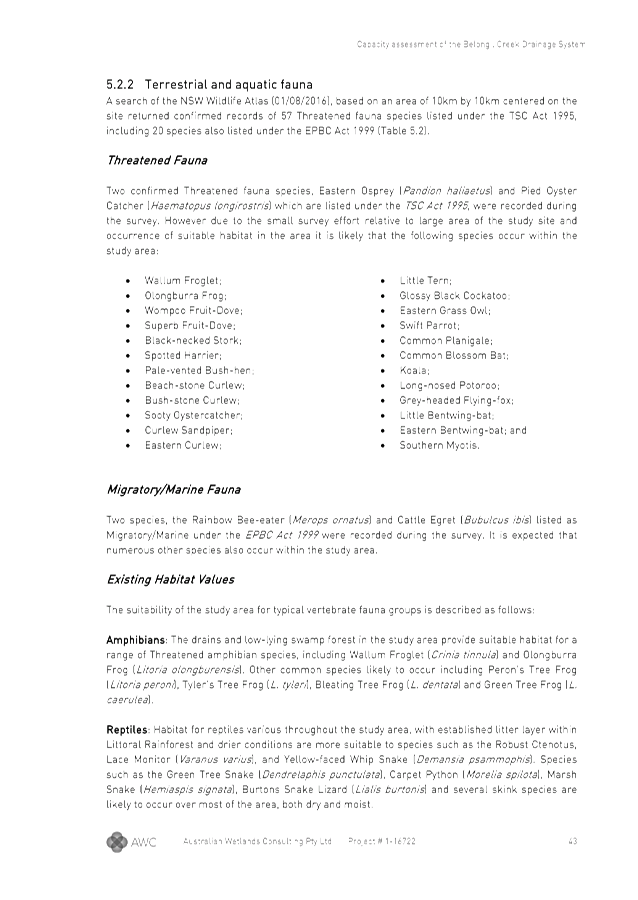
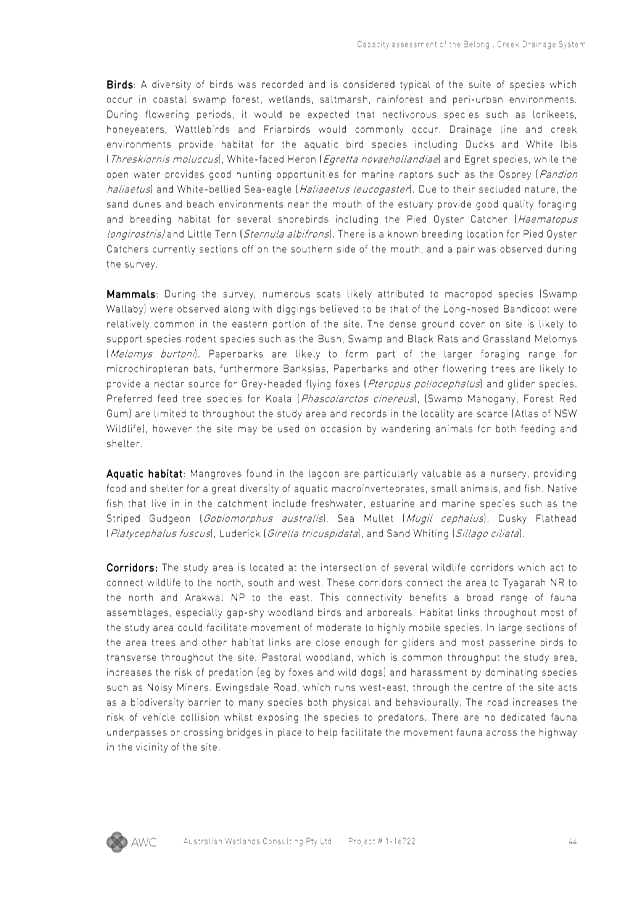
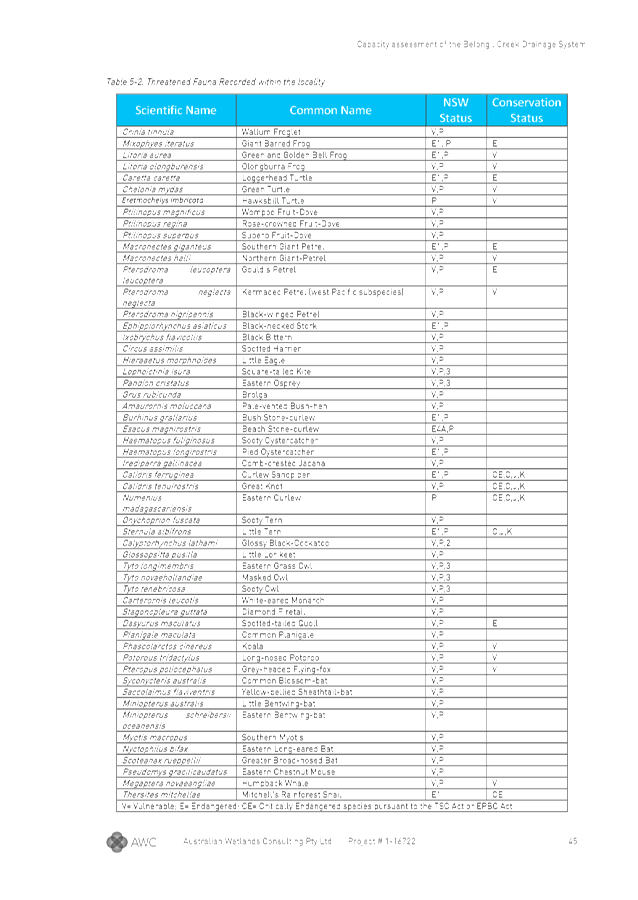
Staff Reports - Infrastructure Services 4.6 - Attachment 1
Staff Reports - Infrastructure Services 4.6 - Attachment 1


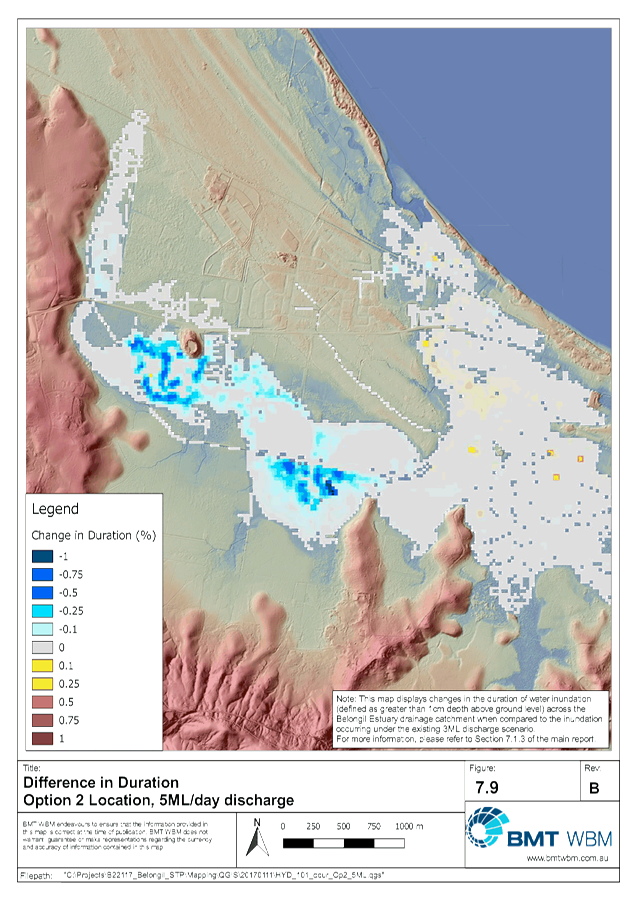
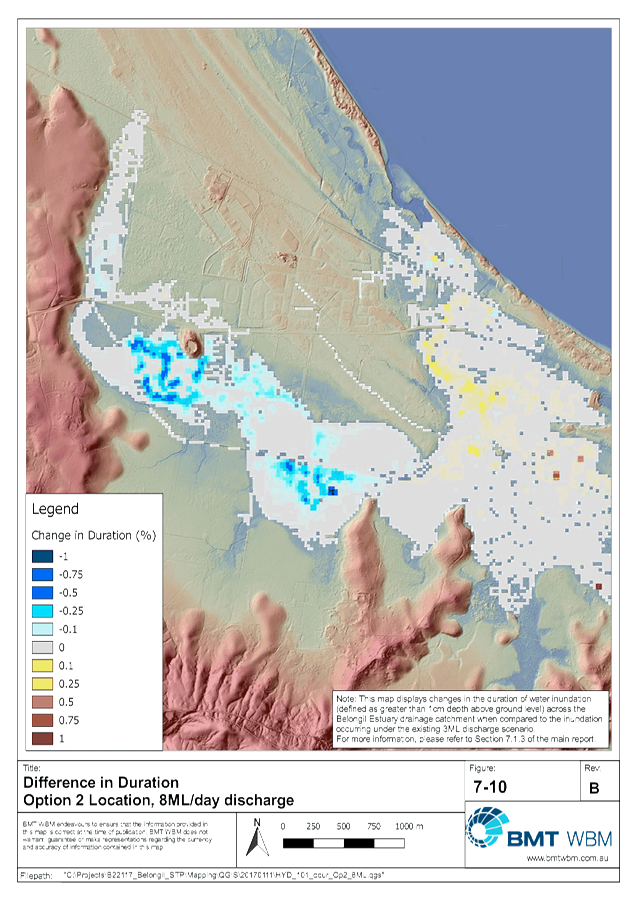
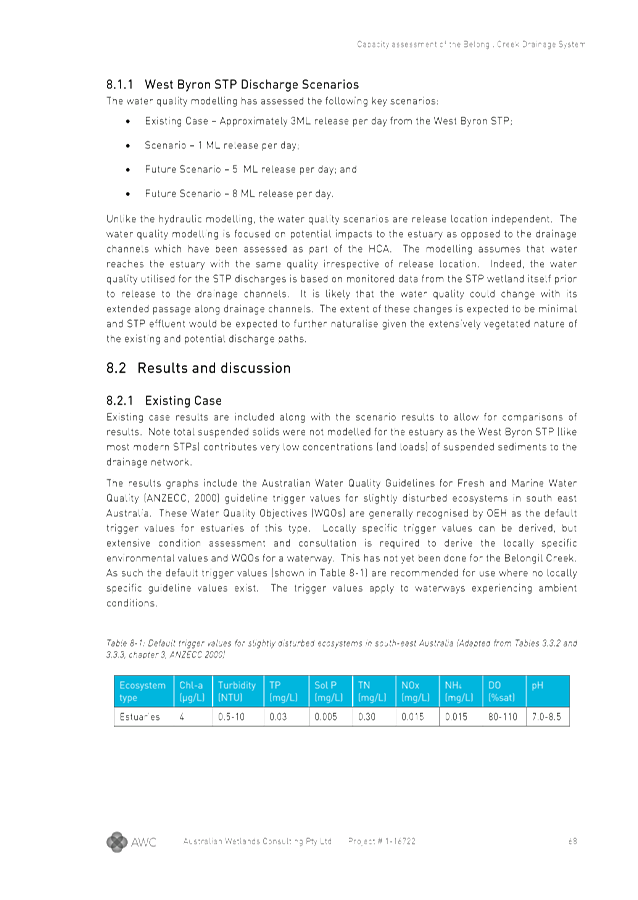
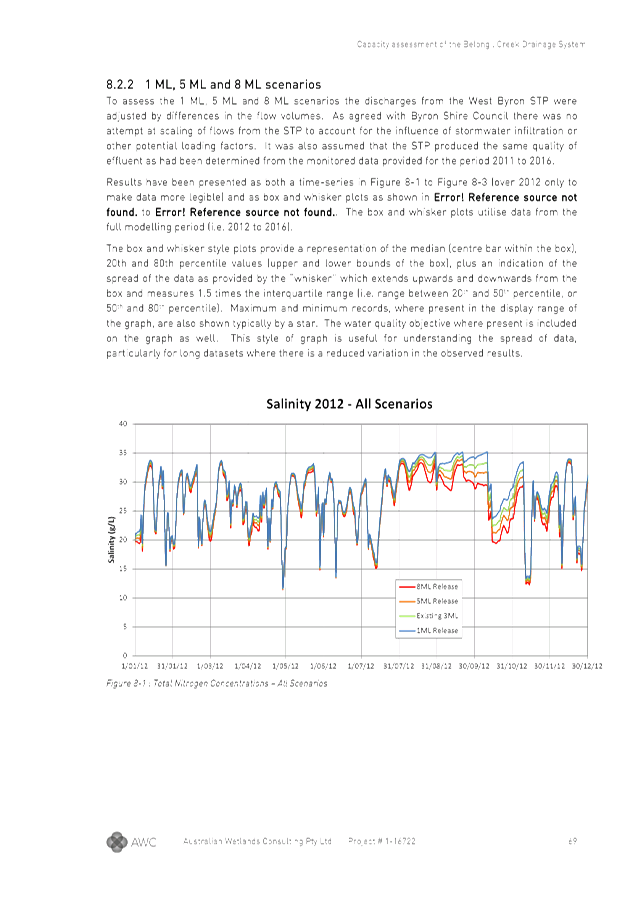
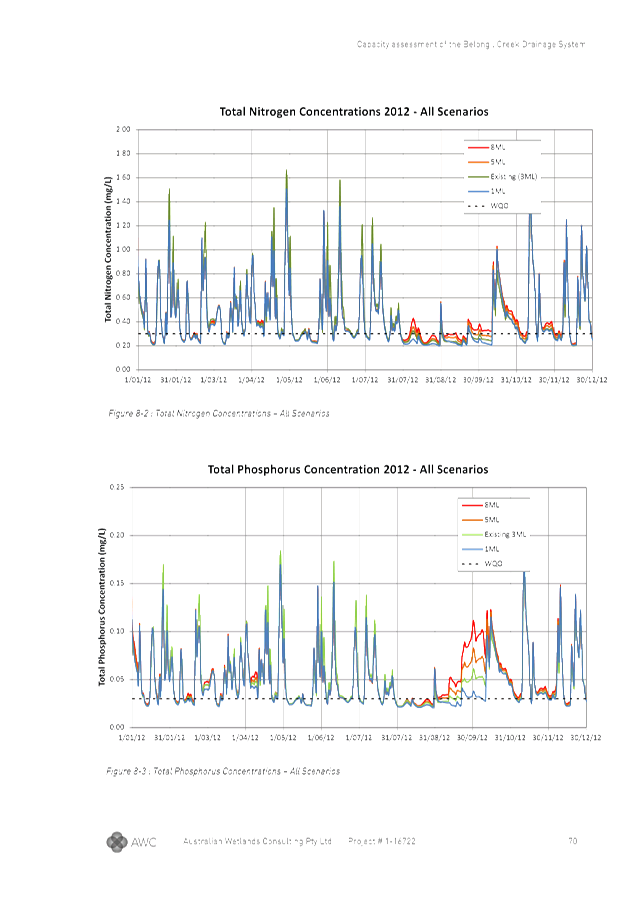
Staff Reports - Infrastructure Services 4.6 - Attachment 1
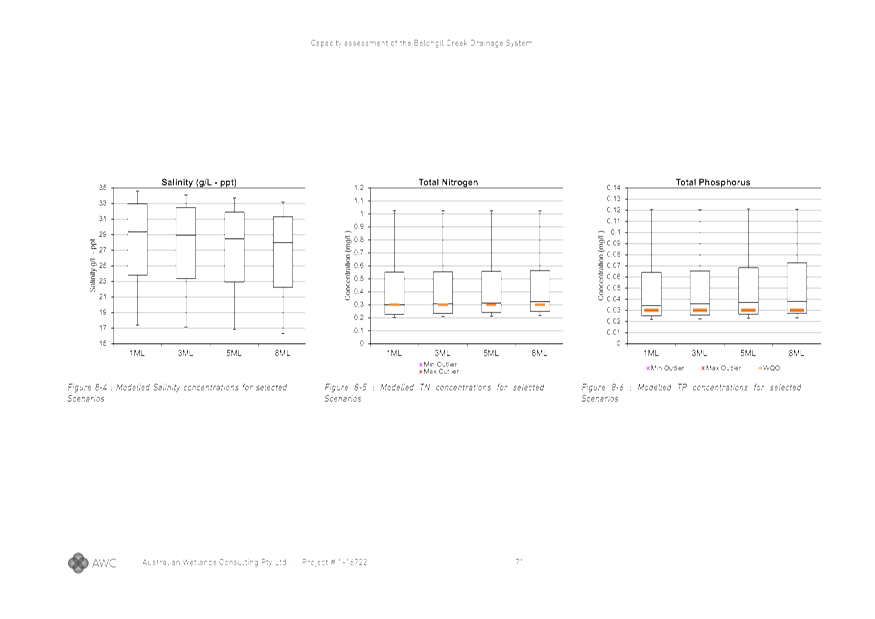
Staff Reports - Infrastructure Services 4.6 - Attachment 1
Staff Reports - Infrastructure Services 4.6 - Attachment 1
Staff Reports - Infrastructure Services 4.6 - Attachment 1
Staff Reports - Infrastructure Services 4.6 - Attachment 1
Staff Reports - Infrastructure Services 4.6 - Attachment 1


Staff Reports - Infrastructure Services 4.6 - Attachment 1

Staff Reports - Infrastructure Services 4.6 - Attachment 1