Transport and Infrastructure Advisory Committee Meeting
A Transport and Infrastructure Advisory
Committee Meeting of Byron Shire Council will be held as follows:
|
Venue
|
Council Chambers, Station Street, Mullumbimby
|
|
Date
|
Thursday, 15 March 2018
|
|
Time
|
9.00am
|

Phil Holloway
Director Infrastructure Services I2018/426
Distributed 09/03/18
What is a “Conflict of Interests” - A conflict of
interests can be of two types:
Pecuniary - an interest that a person has in a matter because of a reasonable
likelihood or expectation of appreciable financial gain or loss to the person
or another person with whom the person is associated.
Non-pecuniary – a private or personal interest that a Council
official has that does not amount to a pecuniary interest as defined in the
Local Government Act (eg. A friendship, membership of an association, society
or trade union or involvement or interest in an activity and may include an
interest of a financial nature).
Remoteness – a person does not have a pecuniary interest in a matter
if the interest is so remote or insignificant that it could not reasonably be
regarded as likely to influence any decision the person might make in relation
to a matter or if the interest is of a kind specified in Section 448 of the
Local Government Act.
Who has a Pecuniary Interest? - a person has a pecuniary interest in a
matter if the pecuniary interest is the interest of the person, or another
person with whom the person is associated (see below).
Relatives, Partners - a person is taken to have a pecuniary interest in a
matter if:
§ The person’s
spouse or de facto partner or a relative of the person has a pecuniary interest
in the matter, or
§ The person, or a
nominee, partners or employer of the person, is a member of a company or other
body that has a pecuniary interest in the matter.
N.B. “Relative”, in relation to a person means any of the
following:
(a) the
parent, grandparent, brother, sister, uncle, aunt, nephew, niece, lineal
descends or adopted child of the person or of the person’s spouse;
(b) the
spouse or de facto partners of the person or of a person referred to in
paragraph (a)
No Interest in the Matter - however, a person is not taken to have a
pecuniary interest in a matter:
§ If the person is
unaware of the relevant pecuniary interest of the spouse, de facto partner,
relative or company or other body, or
§ Just because the
person is a member of, or is employed by, the Council.
§ Just because the
person is a member of, or a delegate of the Council to, a company or other body
that has a pecuniary interest in the matter provided that the person has no
beneficial interest in any shares of the company or body.
Disclosure and participation in meetings
§ A Councillor or a
member of a Council Committee who has a pecuniary interest in any matter with
which the Council is concerned and who is present at a meeting of the Council
or Committee at which the matter is being considered must disclose the nature
of the interest to the meeting as soon as practicable.
§ The Councillor or
member must not be present at, or in sight of, the meeting of the Council or
Committee:
(a) at any
time during which the matter is being considered or discussed by the Council or
Committee, or
(b) at any
time during which the Council or Committee is voting on any question in
relation to the matter.
No Knowledge - a person does not breach this Clause if the person did
not know and could not reasonably be expected to have known that the matter
under consideration at the meeting was a matter in which he or she had a
pecuniary interest.
Participation in Meetings Despite Pecuniary Interest (S 452 Act)
A Councillor is not prevented from taking part in the consideration or
discussion of, or from voting on, any of the matters/questions detailed in
Section 452 of the Local Government Act.
Non-pecuniary Interests - Must be disclosed in meetings.
There are a broad range of options available for managing conflicts &
the option chosen will depend on an assessment of the circumstances of the
matter, the nature of the interest and the significance of the issue being
dealt with. Non-pecuniary conflicts of interests must be dealt with in at
least one of the following ways:
§ It may be appropriate
that no action be taken where the potential for conflict is minimal.
However, Councillors should consider providing an explanation of why they
consider a conflict does not exist.
§ Limit involvement if
practical (eg. Participate in discussion but not in decision making or
vice-versa). Care needs to be taken when exercising this option.
§ Remove the source of
the conflict (eg. Relinquishing or divesting the personal interest that creates
the conflict)
§ Have no involvement by
absenting yourself from and not taking part in any debate or voting on the
issue as if the provisions in S451 of the Local Government Act apply
(particularly if you have a significant non-pecuniary interest)
RECORDING OF VOTING ON PLANNING MATTERS
Clause 375A of the Local Government Act 1993
– Recording of voting on planning matters
(1) In this section, planning
decision means a decision made in the exercise of a function of a council
under the Environmental Planning and Assessment Act 1979:
(a) including a decision
relating to a development application, an environmental planning instrument, a
development control plan or a development contribution plan under that Act, but
(b) not including the making of
an order under Division 2A of Part 6 of that Act.
(2) The general manager is
required to keep a register containing, for each planning decision made at a
meeting of the council or a council committee, the names of the councillors who
supported the decision and the names of any councillors who opposed (or are
taken to have opposed) the decision.
(3) For the purpose of maintaining
the register, a division is required to be called whenever a motion for a
planning decision is put at a meeting of the council or a council committee.
(4) Each decision recorded in
the register is to be described in the register or identified in a manner that
enables the description to be obtained from another publicly available
document, and is to include the information required by the regulations.
(5) This section extends to a
meeting that is closed to the public.
Transport and Infrastructure Advisory
Committee Meeting
BUSINESS OF MEETING
1. Apologies
2. Declarations of Interest
– Pecuniary and Non-Pecuniary
3. Adoption of Minutes from
Previous Meetings
3.1 Transport
and Infrastructure Advisory Committee Meeting held on 31 December 2017
3.2 Extraordinary
Transport and Infrastructure Advisory Committee Meeting held on 13 February
2018
4. Staff Reports
Infrastructure Services
4.1 Draft
Transport Asset Managment Plan (TAMP)............................................................. 4
4.2 Byron
Bay (Browning St) to Suffolk Park (Clifford St) Cycleway Investigation............ 76
4.3 High
Risk Infrastructure Service Priorities.................................................................... 158
4.4 Bike
Plan and PAMP Status Report............................................................................. 164
4.5 Development
of a Shire-wide Transport Strategy........................................................ 176
Staff Reports - Infrastructure Services 4.1
Staff Reports - Infrastructure Services
Report No. 4.1 Draft
Transport Asset Managment Plan (TAMP)
Directorate: Infrastructure
Services
Report
Author: Blyth
Short, Asset Management Coordinator
File No: I2018/341
Theme: Community Infrastructure
Asset Management
Summary:
Following the adoption of
the Strategic Asset Management Plan and the integration with the successful
Special Rate Variation application, a draft Transport Asset Management Plan
(TAMP) has been developed.
This plan represents the
next level of asset planning and has been prepared using the guidance of the
International Infrastructure Management Manual.
Following the
consideration of the Committee it is hoped the document will be reported to
Council and move to a public consultation phase commencing in May 2018.
The process of achieving
an adopted TAMP will be integrated with the recommendations of the Community
Solutions Panel which are due in April 2018.
|
RECOMMENDATION:
That the draft Transport Asset Management Plan
(TAMP) and associated Community Summary be considered by the Advisory
Committee with feedback provided to staff.
|
Attachments:
1 Draft
Transport Asset Management Plan V5, E2018/14868
, page 9⇩ 
Report
A draft Transport Asset Management Plan (TAMP) has been
prepared and in addition a community summary with info-graphics has also been
produced to assist customers in understanding the content.
The following is provided as a summary of some of the key
content of the TAMP.
Transport Assets do not include trains, bus or taxi
services which are beyond council’s responsibility, and they include the
following:
· Sealed
Roads 508km
· Unsealed
roads 96km
· Bridges
33 and Footbridges 12
· Rural
Causeways 88 and Major culverts 90
· Footpaths/shared
paths 89km
· Roundabouts,
islands 727 and street signs
· Kerb
and gutter 257km
· Road
barriers 31 km
· Bus
Shelters 49
· Retaining
Walls 75
· Car
Parks 24 off road
Byron Shire Council’s Transport assets enable the
community to access and enjoy a range of services and facilities that Byron
Shire has to offer. It has an asset replacement value of $364 million for Road
and $64.3 million for stormwater, as at 30 June 2017. The efficient
management of these road and stormwater assets is vital to provide safe,
reliable and efficient services.
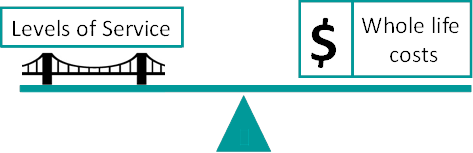
Key messages in the TAMP:
Ø Asset Management needs to balance
Levels of Service and whole of life costs.
Ø The challenge for council is to
invest in the renewal of existing infrastructure before building new
assets which increase the asset portfolio and further increase operational cost
and long term renewal liabilities.
Ø The current long term financial
expenditure on maintenance and capital renewal is insufficient to
‘maintain’ Transport assets.
Ø The current spend on road reseals
and reconstructions fluctuate from year to year and are affected by maintenance
overruns.
Ø Roads and stormwater have big
financial challenges with a current Capital Renewal and Maintenance gap of
$14.3M.
Ø Road ‘Bring to
Satisfactory’ backlog is $24M. Sealed roads have 41% in poor condition.
Ø Assets have much longer
operational life prior to renewal than industry average.
Ø There is insufficient maintenance
for urban and rural drainage. The challenge is the competing pothole
maintenance budget of $1.3M.
Ø To “maintain” the
overall sealed road network condition the average renewal investment needs to
increase to 10.4M by 2028.
Ø On an average basis, the
investment in road reseals needs to target 39km per year for an estimated value
of $ 3.8M.
Ø On an average basis, the
investment in road reconstruction needs to target 6km per year for an estimated
value of $7.5M.
Ø New and upgrade work
should be funded through the Section 94 Plan and grants, with the ongoing
impact of operational costs considered.
Ø Asset Sustainability
and Renewal Ratios appear to be improving as Council has increased spending in
order to address the backlog of previously underfunded asset renewals.
Ø Ongoing innovation is necessary,
for example five poor condition bridges will be cost effectively replaced with
steel Australian Defence Force bridges in 2018/19.
Ø Investment in asset management
with the latest technology and innovation should continue.
Ø Asset management systems that are
well established and integrated must be maintained.
In the financial year of 2016/17 Council spent $4.1
million on maintenance and $13.1 million on capital expenditure for road
and stormwater assets. Based on the Asset Predictor© modelling for roads
(sealed and unsealed), footpaths and bridges current spending with the 7.5%
rate increase will see the Transport assets overall condition deteriorate.
Capital renewal for sealed roads needs to grow to $10.4 million in 10 years to
maintain the overall condition of the road network. This work is for
replacement of assets only and does not account for new assets such as
roundabouts and new footpaths.
Failure to adequately plan for the replacement of these
existing assets and the development of new assets will result in assets not
meeting the needs of the community now, and into the future. Councils ‘Bring
to Satisfactory Standard’ (BTS) backlog (capital renewal) for Road
and Stormwater infrastructure is $35 million out of a total of $38
million for all infrastructure (Special Schedule 7, 30 June 2017). To
address this significant BTS backlog it will take consistent capital renewal
effort over the next 20 years.
In the financial year of 2016/17 Council spent $4.1
million on maintenance and $13.1 million on capital expenditure for
road and stormwater assets. Based on the Asset Predictor© modelling for
roads (sealed and unsealed), footpaths and bridges, current spending with the
additional 7.5% rate increase will still see the Transport assets overall
condition deteriorate. Capital renewal for sealed roads needs to grow to $10.4
million in 10 years to maintain the overall condition of the road network. This
work is for replacement of assets only and does not account for new assets such
as roundabouts and new footpaths.
Recent Level 2 structural inspections of causeways and
major culverts have identified 7 urgent ($2.2million) and 16 high priority
($5.5million) poor condition rural drainage assets. The 7 urgent assets are
either load limited and or have temporary steel plates and require full
replacement. If the 16 high priority assets are not addressed in the very
near future, further load limits will be implemented. There is currently no
source of funding to renew these deteriorated and failing rural drainage
assets.
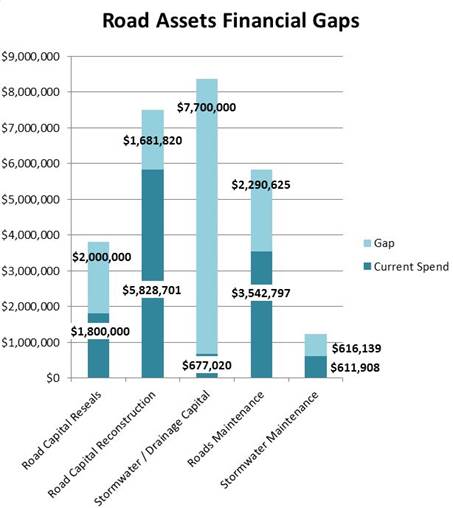
Figure 1 Transport Assets Financial Gaps
Council’s Long Term Financial Plan as adopted by
Council in E2017/96003 allows expenditure of $61.65 million on the renewal of
its Road asset portfolio over the next 10 years as summarised below.

Figure 2 Long Term Financial Plan and Annual Required
Renewal
This Transport Asset Management Plan (TAMP) demonstrates how
Council will endeavour to achieve its strategic asset management outcomes by
applying strategic asset management planning with the available funding. The
key elements of infrastructure asset management are:
· Taking
a life cycle approach
· Developing
cost-effective management strategies for the long term
· Providing
a defined level of service and monitoring performance
· Understanding
and meeting the demands of growth through demand management and infrastructure
investment
· Managing
risks associated with asset failures
· Sustainable
use of physical resources
· Continuous
improvement in asset management practices.
A detailed improvement plan generated during the creation of
this Asset Management Plan is shown in Section 13, for those activities and
processes that need to be monitored, developed and fine-tuned over time. Some
of the priority actions include:
· Obtain
Council approval/endorsement of this Plan,
· Develop
unit rates to calculate required maintenance for all asset sub-types e.g.
guardrails, guideposts etc.,
· Formalise
the new, renewal and disposal policies,
· Test
current levels of service to determine if they’re achievable,
· Establish
and document a Maintenance Plan and
· Update,
revise and expand asset sub-types (e.g. causeways and culverts) in the
prediction modelling.
The key areas of this Transport Asset Management Plan are
the Levels of Service, the Life Cycle Management, Financial Summary and
Improvement Plan.
It should be noted that this Asset Management Plan is not a
stand-alone document, and is closely related to Council’s Strategic Asset
Management Plan and other significant Council documents. Council will
measure the effectiveness and application of the asset management plan through:
· Stakeholder
consultation
· Regular
condition and maintenance inspections
· Continued
use of Assetic Predictor© to predict renewal requirements
· Continuous
review and improvement to asset management practices
· Key
Performance Indicators (KPI) monitoring and recording of customer levels of
service
Financial Implications
The financial implications
are referenced in the report.
Statutory and Policy Compliance Implications
The TAMP has been prepared in accordance with the adopted
Asset Management Policy.
Staff Reports - Infrastructure Services 4.1 - Attachment 1
 Byron Shire Council
Transport
Asset
Management
 Plan
Plan
March
2018
Table of contents
1. Executive Summary. 6
2. Purpose. 10
What is
Asset Management?. 10
Objective of
Asset Management 10
Benefit of
Asset Management 10
Related
Council Documents. 11
3. Current Position. 12
Transport
Asset Stock. 12
Replacement
Cost of Council’s Transport assets. 13
Present
Condition of Council’s Transport assets. 13
Remaining
Life. 21
4. Levels of Service. 22
Technical
Levels of Service. 22
Community
Levels of Service. 22
Condition
Assessment 33
5. Future Demand. 34
Demand Forecast 34
Demand
Management Plan. 34
New Assets
from Growth. 35
Changes in
Technology. 36
6. Asset Management Practices. 36
Financial
Systems. 36
Asset
Management Systems. 36
Accounting
Framework. 37
Standards
and Guidelines. 38
Risk
Management 38
7. Lifecycle Management Plan. 38
Asset
Capacity and Performance. 39
Asset
Condition. 39
Useful Lives
and Unit Rates. 40
Asset
Valuations. 41
8. Maintenance Plan. 42
Standards
and Specifications. 42
Future
Maintenance Expenses. 42
Maintenance
Challenges. 42
9. Renewal Plan. 43
Renewal
Prioritisation. 43
Road Renewal
Targets. 44
Bitumen -
Design Life Bitumen average 12years. 44
(Austroads
AGPT05-11) 44
Asphalt
average 15 years (Austroads AGPT05-11) 44
Concrete. 44
(Austroads
AGPT05-11) 44
Bridge
Renewals. 45
Impact of
Deferring Renewal Works. 45
Managing the
Risks and Renewal Challenges. 46
10. New and Upgrade Plan. 47
Selection
Criteria. 47
Developer
Contributions. 47
Forecast
Upgrade/New Expenditure. 47
11. Disposal of Assets. 47
12. Financial Summary. 48
Financial
Statements and Projections. 48
Funding
Strategy. 48
Financial
Ratios. 53
13. Improvement Plan. 58
Improvement
Actions. 58
14. Glossary. 59
15. APPENDIX A Special Schedule 7 –
Report on Infrastructure Assets as at 30 June 2017 63
16. APPENDIX B Community Transport Asset Management
Plan. 65
17. References. 67
Figures
Figure
1 Transport Assets Financial Gaps. 7
Figure
2 Transport Long Term Financial Plan and Annual Required Renewal 8
Figure
3 Asset Management simplified. 10
Figure
4 Transport Asset Stock. 12
Figure
5 Overall breakdown of replacement cost for Transport assets. 13
Figure
6 Transport assets by condition. 14
Figure
7 Asset Remaining Life. 21
Figure
8 Customer Satisfaction Transport Assets Performance Gap. 23
Figure
9 Top 3 Community Priorities (BSC Survey, 2016) 34
Figure
10 Asset Management Systems and Elements. 37
Figure
11 Asset life cycle stages. 38
Figure
12 Actual life comparison between industry average and Byron Shire. 40
Figure
13 Road and stormwater Maintenance 2016-17. 43
Figure
14 Pavement Deterioration and Maintenance Curve (Public Works Training, 2016) 46
Figure
15 Long Term Financial Plan - Transport 48
Figure
16 Long Term Financial Plan (LTFP) funding & Annual Required Renewal
Expenditure (ARRE) 48
Figure
17 Asset Maintenance Ratio General Fund SS7. 56
Figure
18 Infrastructure Backlog Ratio General Fund SS7. 57
Tables
Table
1 Related Council Documents. 11
Table
2 Condition Grading Model 14
Table
3 Customer Satisfaction Performance Gap Ranking (Summarised version) 24
Table
4 Sealed Roads Levels of Service. 25
Table
5 Unsealed Roads Levels of Service. 28
Table
6 Footpath and Shared Path Levels of Service. 30
Table
7 Kerb and Gutter Levels of Service. 31
Table
8 Stormwater Levels of Service. 32
Table
9 NSW population projections regional LG data. 34
Table
10 Demand management plan summary. 35
Table
11 Transport assets useful lives. 40
Table
12 Transport assets treatment unit rates. 41
Table
13 Transport asset valuation data (SS7 30 June 17) 41
Table
14 Asset Predictor© Modelling Sealed Roads to “Maintain” at
10%.. 44
Table
15 Road Capital Renewal Annual Targets. 44
Table
16 Reseals for the last 3 years. 45
Table
17 Long Term Financial Plan. 49
Table
18 Capital Funding Predictor© (IS Master Sheet for 10 Year Plan) 49
Table
19 Maintenance Funding Predictor©.. 50
Table
20 Maintenance Funding. 50
Table
21 Maintenance expenditure (2016/17) 51
Table
22 Financial Gaps additional to Predictor© modelling. 52
Table
23 Asset Consumption Ratios. 53
Table
24 Asset Sustainability Ratio Figures. 54
Table
25 Asset Renewal Funding Ratio Figures. 55
Table
26 Improvement actions summary. 58
Asset Management Definitions
Maintenance is
work performed on an asset that just keeps it in a useable condition, for
example:
- filling potholes,
- replacing guideposts,
- repairing broken stormwater pipes,
- grading a gravel road
Capital Renewal is work performed on an asset to bring it back to a good or
fair condition. It can include both simply repairing an existing asset (like
for like) an existing asset. Examples include:
- resealing a sealed road,
- reconstructing a portion of road segment
- putting new gravel on a gravel road
Capital New is
work performed to create a new asset or additional work performed on an
existing asset to provide more than what is currently there, for example:
- building a new roundabout or a new road from
developer contributions;
- constructing stormwater pipes where there
currently aren’t any;
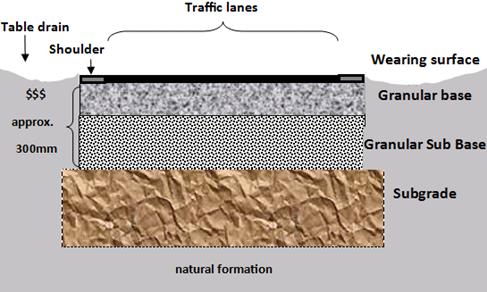
In relation to roads:
· Resealing is placing a new layer of bitumen over the existing
pavement. The purpose of a reseal is to the base and sub-base to extend the
life of the road.
Resealing also involves new line marking, if
required, and often guide post replacement, shoulder/side drain works or
vegetation management.
· Re-constructing is tearing up the existing pavement, base course and often
also the sub-base and replacement with new material (See diagram below).
It also involves the reconstruction of shoulders
and often side drains, or where there is kerb and gutter. It often involves
vegetation management and working around or with other utility services in the
road reserve, for example telecommunications, electricity, water or sewer
services.
The typical cross section of a road and the names of the
different components are:
1. Executive
Summary
Byron
Shire Council’s (BSC) Transport assets enable the community to access and
enjoy a range of services and facilities that Byron has to offer. It has an
asset replacement value of $364 [PC1] million
for Road and $64.3 million for
stormwater, as at 30 June 17. The efficient management of these road and
stormwater assets is vital to provide safe, reliable and efficient services.
Transport
Assets do not include trains, bus or taxi services which are beyond
council’s responsibility. This Transport Asset Management Plan (TAMP)
includes the following:
· Sealed Roads 508km
· Unsealed roads 96km
· Bridges 33 and Footbridges 12
· Rural Causeways 88 and Major culverts 90
· Footpaths/shared paths 89km
· Roundabouts / islands 727 and street signs
· Kerb and gutter 257km
· Road barriers 31 km
· Bus Shelters 40
· Retaining Walls 75
· Car Parks 24 off road
Key messages
Ø Asset Management
needs to balance Levels of Service and whole of life costs.
Ø The challenge for
council is to invest in capital renewal of existing infrastructure
before building capital new assets which increases the assets portfolio and
increases costs.
Ø The current long term
financial expenditure on maintenance and capital renewal is insufficient to
‘maintain’ Transport assets.
Ø The current spend on
road reseals and reconstructions fluctuate from year to year and are affected
by maintenance overruns.
Ø Roads and stormwater
have big financial challenges with a current Capital Renewal and Maintenance
gap of $14.3M.
Ø Road ‘Bring to
Satisfactory’ backlog is $24M. Sealed roads have 41% in poor condition.
Ø Byron leads asset
management with the latest technology and innovation.
Ø Asset management
systems are well established and integrated.
Ø Byron Shire Council
has longer useful lives than industry average which requires more maintenance.
Ø There is insufficient
maintenance for urban and rural drainage. The challenge is the competing
pothole maintenance budget of $1.3M.
Ø To
“maintain” the overall sealed road network condition the average capital
renewal needs to increase to 10.4M by 2018.
Ø The reseals target is
39km per year averaging at $ 3.8million.
Ø The reconstruction
target is 6km per year averaging at $7.5M.
Ø Five Poor condition
bridges will be replaced with steel Australian Defence Force bridges for $7.5M
in early 2019.
Ø New and
upgrade work is mostly funded through the Section 94 Plan.
Ø Asset Sustainability and Renewal Ratios appear to be
improving as we have increased spending in order to make up the backlog of
previously underfunded assts.
Failure
to adequately plan for the replacement of these existing assets and the
development of new assets will result in assets not meeting the needs of the
community now, and into the future. Councils ‘Bring to Satisfactory
Standard’ (BTS) backlog (capital renewal) for Road and stormwater is $35
million out of a total of $38 million for all infrastructure (Special
Schedule 7, 30 June 2017, Appendix A). To address this significant BTS backlog
it will take consistent capital renewal effort over the next 20 years.
In the
financial year of 2016/17 Council spent $4.1 million on maintenance and $13.1
million on capital expenditure for road and stormwater assets. Based on the
Asset Predictor© modelling for roads (sealed and unsealed), footpaths and
bridges current spending with the 7.5% rate increase will see the Transport
assets overall condition deteriorate. Capital renewal for sealed roads needs to
grow to $10.4 million in 10 years to maintain the overall condition of the road
network. This work is for replacement of assets only, and does not account for
new assets such as roundabouts and new footpaths.
The current long term financial expenditure on
maintenance and capital renewal is insufficient to ‘maintain’
Transport assets.
After
Level 2 structural inspections of causeways and major culverts council has
identified 7 urgent ($2.2million) and 16 high priority ($5.5million) poor
condition rural drainage assets. The 7 urgent assets are either load limited
and or have temporary steel plates and require full replacement. If the 16 high
priority assets are not addressed in the very near future load limits will be
implemented. These 23 rural drainage assets totalling $7.7 million is currently
unfunded (Figure 1 Transport Assets Financial Gaps).
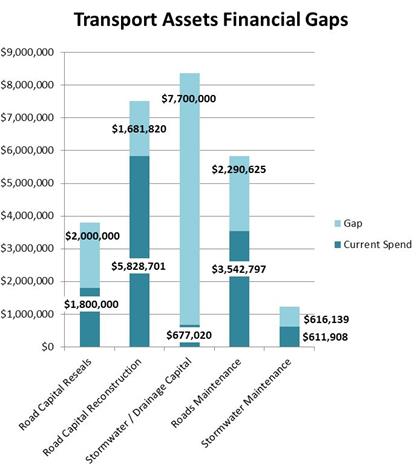
Figure 1 Transport Assets Financial Gaps
The challenge for council is to invest in capital
renewal of existing infrastructure before building capital new assets which
increases the asset portfolio and increases costs.
Council’s
Long Term Financial Plan (E2017/96003) as adopted by Council in 2017, allows
expenditure of $61.65 million on the renewal of its Road asset portfolio over
the next 10 years as summarised below. The works program and predicted renewal
requirements are detailed in Section 12.
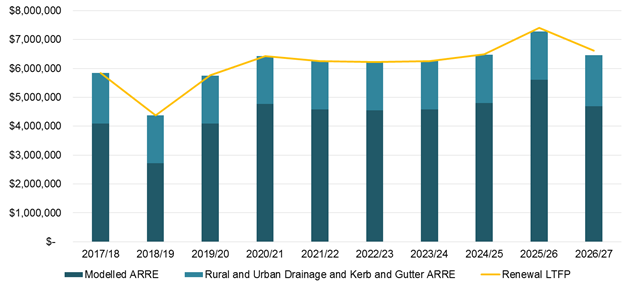
Figure 2 Transport Long
Term Financial Plan and Annual Required Renewal
This
Transport Asset Management Plan demonstrates how Council will endeavour to
achieve its strategic asset management outcomes by applying strategic asset
management planning with the available funding. The key elements of
infrastructure asset management are:
· Taking a life cycle approach
· Developing cost-effective management strategies for the
long term
· Providing a defined level of service and monitoring
performance
· Understanding and meeting the demands of growth through
demand management and infrastructure investment
· Managing risks associated with asset failures
· Sustainable use of physical resources
· Continuous improvement in asset management practices.
A detailed
improvement plan generated during the creation of this Asset Management Plan is
shown in Section 13, for those activities and processes that need to be
monitored, developed and fine-tuned over time. Some of the priority actions
include:
· Obtain Council approval/endorsement of this Plan,
· Develop unit rates to calculate required maintenance for
all asset sub-types e.g. guardrails, guideposts etc.,
· Formalise the new, renewal and disposal policies,
· Test current levels of service to determine if they’re
achievable,
· Establish and document a Maintenance Plan and
· Update, revise and expand asset sub-types (e.g. causeways
and culverts) in the prediction modelling.
The
key areas of this Transport Asset Management Plan are the Levels of Service, the
Life Cycle Management, Financial Summary and Improvement Plan.
It
should be noted that this Asset Management Plan is not a stand-alone document,
and is closely related to Council’s Strategic Asset Management Plan and
other significant Council documents. Council will measure the
effectiveness and application of the asset management plan through:
· Stakeholder consultation
· Regular condition and maintenance inspections
· Continued use of Assetic Predictor© to predict renewal
requirements
· Continuous review and improvement to asset management
practices
· Key Performance Indicators (KPI) monitoring and recording
of customer levels of service
As a result of Council
restructuring, an asset team was formed in 2015. This now consists of 4 full
time staff dedicated to strategically managing assets. This has provided the
opportunity to increase capacity and scale to improve asset management systems
and technologies which ultimately will translate into improved operational
delivery over the next 10 to 20 years.
Fixing our roads will take committed effort for the next
20 years and this Transport Asset Management Plan is councils way to set goals
to achieve this.
2.
Purpose
What is Asset Management?
Asset
management is the planning, acquisition, operation, maintenance, renewal and
disposal of assets. In simplest terms, asset management is about the way in
which assets are looked after, both on a day-to-day basis (i.e. maintenance and
operations) and in the medium to long-term (i.e. capital renewal and forward
planning). Asset management ensures that council’s assets are capable of
providing services, of an agreed quality, in a sustainable manner, for present
and future communities.
This
asset management plan is prepared to meet legislative and organisational
requirements for sustainable service delivery and long term financial planning
and reporting.
Objective of Asset Management
The
objective of asset management is to maximise asset service delivery potential
and manage related risks and costs over an assets entire life. Asset management
is about intervening at strategic points in an asset’s life cycle,
optimising the performance of the asset and the cost to maintain it. It
requires a proactive approach to asset maintenance and planning to identify
works prior to costly and dangerous asset failure occurring.
The
goal set out by this asset management plan is to meet the required levels of
service in the most cost effective way for present and future communities
(Figure 3).
Asset Management needs to balance Levels of Service
and
whole of life cycle costs.
Figure 3 Asset Management
simplified
Benefit of Asset Management
Asset
management delivers benefits that are realised in the areas of improved
accountability, sustainable service deliver, risk reduction and financial
management and forecasting.
Improving
council’s asset management practices will enable optimised spending by
doing more with less through knowing what assets we own, what condition
they’re in and by monitoring the effect of our actions.
Doing more with less.
Related Council Documents
This
Transport Asset Management Plan sets out the implementation of Council’s
Asset Management Strategy for the long-term management of its Transport assets
in a financially responsible manner. It determines recommended service levels,
inspection regimes and proactive maintenance routines to keep the Transport
assets in safe and serviceable conditions. In order to do this effectively,
other Council policies, strategies and plans must be considered to determine
how this impacts on this asset management plan.
Table 1 Related Council
Documents
|
Key
Council Documents
|
Relationship
|
|
Strategic
Asset Management Plan (SAMP) - E2016/100839
|
Outlines
the framework for the management of Byron Bay Council’s General Fund
Infrastructure assets to deliver Council’s Vision.
|
|
Byron
Shire Bike Strategy and Action Plan (Bike Plan) – DM790722
|
Links
to Future Demand, Section 6.
|
|
Byron
Shire Developer Contribution Plan 2012 (Section 94) - E2015/540
|
Links
to Future Demand, Section 6.
|
|
Draft
Infrastructure Service Risk Management Procedure (ISRMP) - E2015/23531
|
Links
to the Levels of Service, Section 5
|
|
IPART
Determination of Council’s Application for Special Variation for
2017-18 – E2017/54521
|
Links
to the Financial Statement Projections and Funding Strategy, Section 13.
|
|
IPART
Application of Councils Special Variation for 2017-18 –E2017/15274
|
Links
to the Customer Levels of Service tables, Section 5.
|
|
MR545
Strategic Study – DM844180
|
Links
to Future Demand, Section 6.
|
|
Workforce
Plan 2017-2021 – E2017/19709
|
Links
to Renewal, New and Upgrade Plan, Section 10 and 11.
|
|
Long
Term Financial Plan 2016-2026 – E2017/8695
|
Links
to the Financial Statement Projections and Funding Strategy, Section 13.
|
|
Community
Infrastructure Advisory Committee Level of Service – Sealed Road
Network - I2016/108
|
Defines
the adopted sealed roads levels of service
|
|
Community
Consultation and Engagement Report – Funding our Future - E2017/80803
|
Document
that relays the key findings of the communities’ expectations of
council, it was created for the community engagement and awareness strategy
for the Special Rate Variation.
|
|
Community
Infrastructure Asset Assessment Manual Condition, Functionality and Capacity
– DM1101346
|
Document
that guidelines how each asset class is to be assessed for Condition,
Functionality and Capacity
|
3.
Current Position
Transport Asset Stock
Byron
Council manages the community’s Transport assets in integrated service
areas that interact to make Byron a great place to work, visit, live and
invest.
This
Asset Management Plan is designed to take into consideration all Council
Transport Assets as follows:
Roads 508km Sealed & 96km Unsealed
Bridges 33 & Footbridges 12
Kerb and gutter 257km
Footpaths/Shared Paths 89km (cyclists
& pedestrians)
Road barriers 31km
Bus shelters 40
Causeways 88 & major culverts 90 (Rural Drainage)
Retaining walls 75
Traffic control devices 727 (roundabouts,
islands etc.)
Car Parks 24 (off road)
Figure 4 Transport Asset
Stock
Note: Major culverts are defined as barrel(s) entry area >1.767m2.
Shared paths include cyclists and pedestrians.
Replacement Cost of Council’s Transport assets
The
replacement value of Council’s Transport asset portfolio is $334.84
million with a depreciated replacement cost of $182.27 million. The annual
depreciation is $5.44 million as at 30 June 2017.The break-up of
Council’s Transport asset portfolio by replacement value is illustrated
in the following diagram. This does not include the 4 new bridges and
footbridges on Brunswick Valley Way handed to council in 2016.
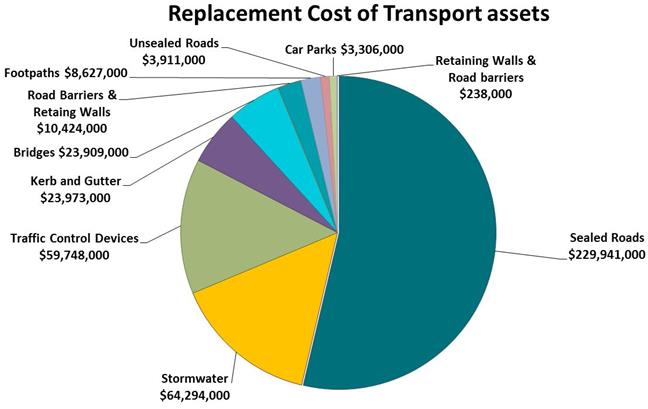
Figure 5 Overall breakdown of replacement cost for Transport assets
Present Condition of Council’s Transport assets
By
understanding the condition of Council’s assets and the various types of
distresses that affect them, Council can utilise this data (to endeavour) to
maintain the level of service the community desires. In the context of
affordability council can provide intergenerational benefits and also minimise
the risk of asset failure. The consequences of asset failures can lead to legal
liability if Council is found to have acted unreasonably in the management of
its assets.
There
are many reasons why assets fail/deteriorate and therefore do not meet current
performance standards and community expectations. Among the most common reasons
for failures at BSC are the following:
· Lack of timely road and stormwater maintenance
· Delay of timely capital renewals
· Damage by service authorities when installing / constructing
their infrastructure within Council’s road reservation
· Movement of the underlying soils
· Inability to control roadside vegetation and manage
water saturation / run off (no chemical weed control is permitted in BSC)
· Increases in vehicle heavy loads on Council’s
roads beyond what the road structure can cater
· Sever weather events and or natural disasters
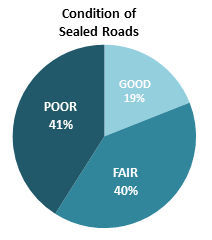
Sealed
roads are the largest part of the Road network replacement cost at $230 million
(Figure 5). It has 41 % in poor to very poor condition (Figure 6). This
presents as a ‘Bring to Satisfactory’ backlog of $24 million
(Special Schedule 7). This alone is council’s greatest concern with the
condition reaching the end of use life and providing poor level of service.
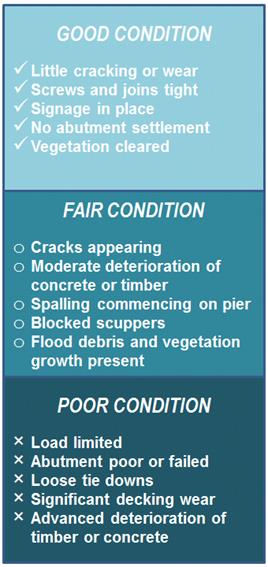
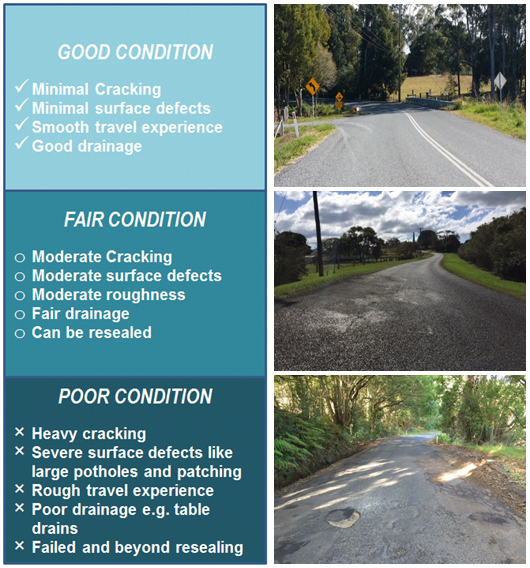
Table 2 Condition Grading Model
|
Condition Grading
|
Description
of Condition
|
|
1
|
Excellent: Asset in excellent condition. No maintenance required.
|
|
2
|
Good: Asset is in good
condition with limited signs of wear. Only requires cyclic maintenance
and is not requiring special attention.
|
|
3
|
Fair: Asset is in useable
condition with extensive signs of wear. Asset requires some attention
to prevent further deterioration and to return it to a condition so that it
requires only cyclic maintenance.
|
|
4
|
Poor: Asset is in poor
condition or is faulty. It needs urgent attention to return it to a useable
condition and or significant renewal/rehabilitation is required to reduce
risk.
|
|
5
|
Very
Poor: Asset
has failed or is at the end of its life or is physically unsound or poses
significant risk. It requires replacement and is beyond rehabilitation.
|
Road ‘Bring to Satisfactory’ backlog is $24M.
Sealed roads have 41% in poor condition.
The
condition of the footpath network has 28.6% in a fair condition which is likely
to move into a poor condition if the future maintenance and renewal budgets are
not increased.
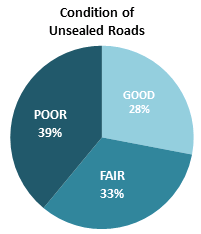
The
unsealed roads have 31% in poor condition and 33% in fair. Council’s unsealed
roads do not receive the required re-sheeting maintenance; as such they are
affected greatly by wet wether events. Council has consistently relied on
natural disaster funding to maintain unsealed roads.
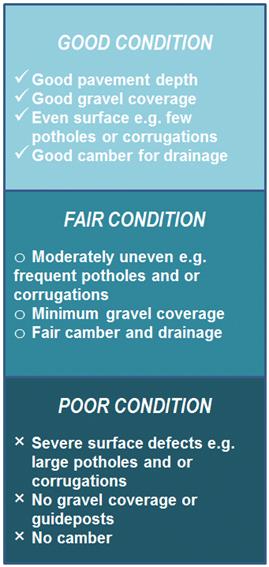
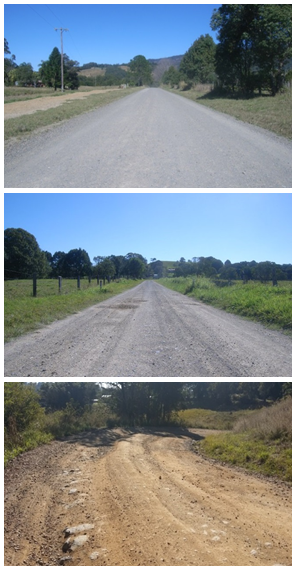
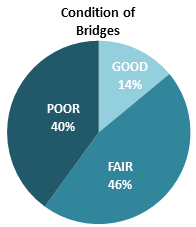
The
following, Figure 6 and subsequent pages depict the overall condition for each
asset sub group. To simplify the condition from the Figure 6 above, Excellent
(1) and Good (2) have been combined into GOOD, and Poor (4) and Very Poor (5)
into POOR.
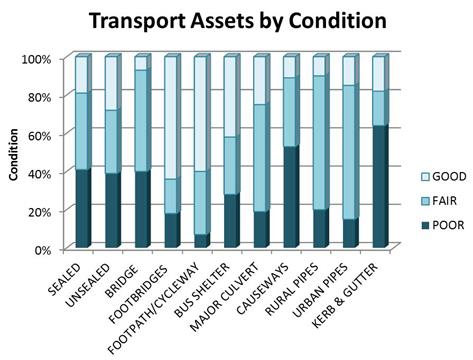
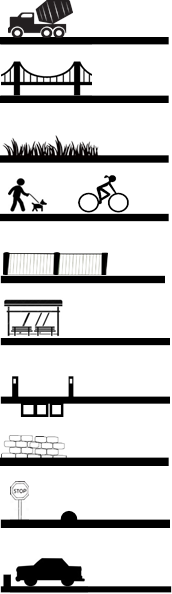
Figure 6 Transport assets by
condition
Sealed Roads
|
Council is responsible for 508km of sealed roads which we
are currently spending $5.1 million per year to maintain and renew the sealed
road pavement. Generally our roads are in fair to poor condition which
manifest as a high level of potholes and other surface defects. To address
this, additional and significant long term capital work such as reseals and
reconstruction is required to improve the overall network.
|
|
Unsealed Roads
|
Council currently spends $390,000
each year to maintain 96km of unsealed roads in the Shire. A large proportion
of unsealed roads are in fair condition overall with only 28% to be
considered in a good condition. Many unsealed roads have little gravel
coverage and are affected by poor weather conditions. Additional maintenance
and gravel replenishment to this network is required to keep these roads
trafficable.
|
|
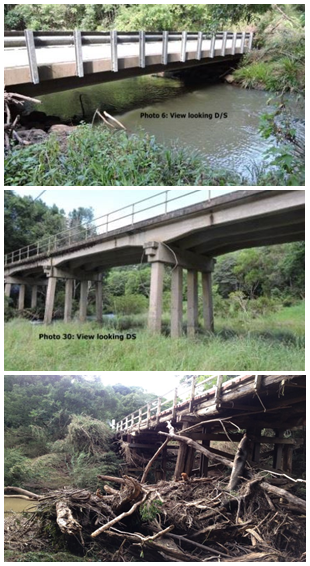
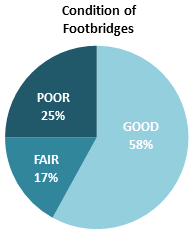
Bridges
|
Council owns and maintains 33 bridges and 12 footbridges. The
majority of these road bridges are rated as being in a good to fair
condition; however, 40% are rated as poor and load limited. Council spent
$74,000 for maintenance and $933,000 capital renewal in 2016/17 on bridges
and footbridges.
Council was gifted 3 bridges and 1 footbridge on Brunswick
Valley Way in 2017 from the Roads and Maritime Services as a part of the
highway bypass coming off a 10 year maintenance period. Councils maintenance
and capital budgets have not increased accordingly to manage these assets.
|
|
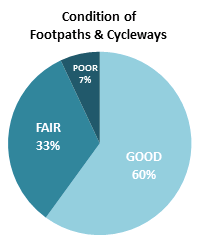
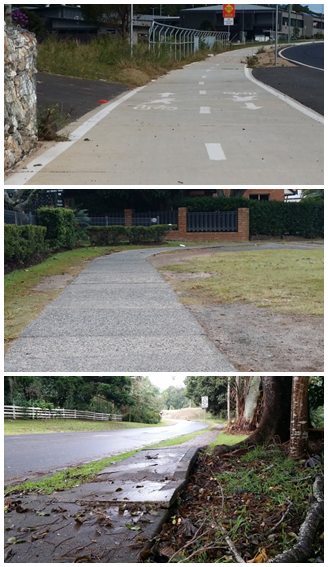
Footpaths and shared paths
|
Council
currently owns and maintains 89km of footpaths and cycleways (shared paths),
stairs and kerb ramps across the Shire. We spend approximately $116,000 per
year on footpaths and cycleways (maintenance and renewal). The majority of
the footpaths are in a fair to good condition with only 7% in poor condition
and need complete replacement. A third of the footpaths currently in fair
condition need additional replacement in sections to ensure they do not
deteriorate into a poor and unsafe condition.
|
|

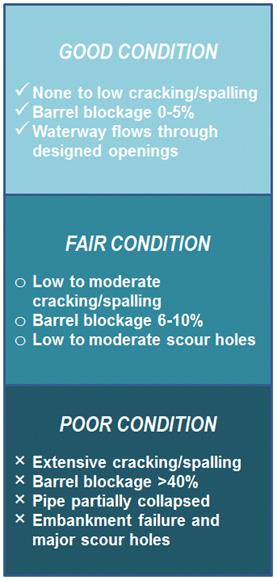
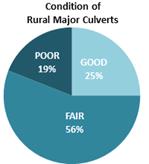
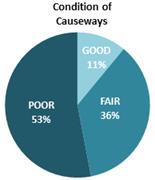
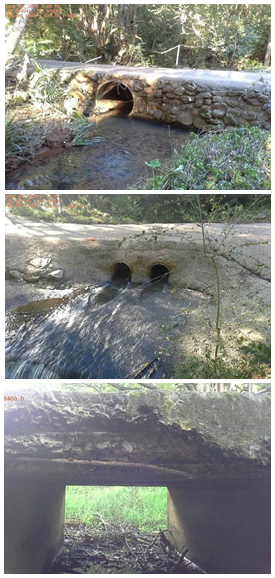
Rural Drainage – Causeways and
Culverts
|
Council owns 88 causeways and 90 culverts, and 1,311 rural
pipes. The majority of the causeways and culverts are in good and fair
condition however, 19% of the culverts and 53% of the causeways are in a poor
condition. Council currently spent $248,000 on maintaining rural drainage in
2016/17. After Level 2 structural inspections council has identified 7 urgent
($2.2million) and 16 high priority ($5.5million) poor condition rural
drainage assets. The 7 urgent asset are either load limited and or have
temporary steel plates and require full replacement. If the 16 high priority
assets are not addressed in the very near future load limits will be
implemented. The 23 rural drainage assets that require replacement/renewal
that totals $7.7 million is currently unfunded.
|
|
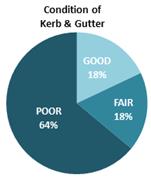
Urban Stormwater
|
Council currently owns and
maintains 257km of kerb and gutter, 139km of pipes and 4920 pits (includes
kerb inlet pits, field inlets and headwalls). Council spent $364,000 on urban
drainage in 2016/17. Most of our road drainage is rated fair. However, much
of the road drainage network in fair condition needs additional maintenance
and replacement work undertaken to prevent it from degrading to a poor
condition.
|
|
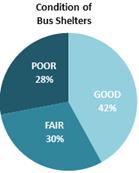 Bus Shelters
|
Council owns 40 bus shelters with 43%
good and 30% fair. However, there are 28% in a poor condition which require
replacing and bringing up to the disability access standards by 2020. We
spend approximately $1,680 per year on maintenance.
|
Remaining Life
Based
on condition audits and inspections carried out in the years from 2014 to 2017
and 2017 financial asset data, Council’s assets are estimated to be in
fair condition as shown in Error!
Reference source not found. in the
condition barometer chart. On a network basis, as shown below, on average
Council’s assets have consumed 46% of their useful life.
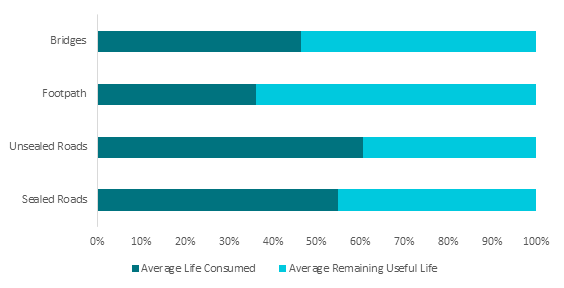
Figure 7 Asset Remaining
Life
Road assets have consumed 46% of their useful life
compared to industry average.
4. Levels
of Service
A key
objective of this Asset Management Plan is to identify the current levels of
service provided by Council’s asset portfolio. The levels of service
defined in this section will be used to:
· Clarify the level of service that our customers should
expect.
· Identify works required to meet these levels of service.
· Identify the costs and benefits of the services offered.
· Enable Council and customers to discuss and assess the
suitability, affordability and equality of the existing service level and to
determine the impact of increasing or decreasing this level in future.
This
section defines the service for Byron Shire Council’s Transport assets.
The adopted levels of service for these Transport Assets have been based on
legislative requirements, customer research and expectations, and
Council’s strategic goals. There are two tiers of levels of service;
Customer Levels of Service and Technical Levels of Service.
Technical Levels of Service
Technical
Levels of Service are long term, tactical tools developed to measure, monitor
and manage functions of service over time with regards to quality of assets
managed, quantities of assets contributed or constructed, operational and
capital expenditure (Table 4).These technical measures relate to the allocation
of resources to service activities that the organisation undertakes to best
achieve the desired community outcomes and demonstrate effective organisational
performance. Legislative requirements, infrastructure standards and industry
guides combine to strongly influence technical levels of service. For example,
the number of crashes per year caused by loose gravel. The following are also
defined:
· New Assets, upgraded or reconstructed asset – the
design and maintenance standards applicable
· Maintenance – intervention points and responsiveness
Community Levels of Service
Community
Levels of Service are a reflection of Technical Levels of Service being
delivered to the community. They are derived through community engagement,
which gauge the publics’ level of satisfaction with service, their
utilisation of a service, and their desired levels of service and may also be
derived from informal community feedback and complaints. For example potholes on
roads repaired within an agreed timeframe.
Community
levels of service measures used in asset management planning are:
Quality How
good is the service?
Function Does
it meet users’ needs?
Capacity/Utilisation Is
the service usage appropriate to capacity?
During
Councils community engagement and awareness strategy for the 2016 Special Rate
Variation council used a variety of methods to engage with the community around
levels of service. Council consistently provided information about the need for
a rate increase and ensured ratepayers were aware of the proposed special rate
variation. The council implemented its community engagement and awareness
strategy in four phases:
· Phase 1 - community satisfaction surveys conducted from
July to August 2016, to determine levels of community satisfaction and changes
from the 2013 survey results.
· Phase 2 – an asset survey conducted from August to
September 2016, to determine community attitudes regarding priority assets and
council investment.
· Phase 3 – the special rate variation awareness
campaign Funding our Future conducted from September to November 2016, to
determine ratepayers’ preferred special rate variation option and
community support for a special variation.
· Phase 4 – exhibiting updated Integrated Planning and
Reporting documentation, to provide additional special rate variation
information to the community and to improve awareness and seek submissions
regarding the special rate variation process.
In
addition to the surveys and public exhibition of the documents outlined above,
community awareness and associated feedback came from a variety of engagement
methods, including:
ü advertising and media release,
ü community forums,
ü council kiosks at community events, and
ü social media engagement.
The
community has consistently told Council that fixing Byron’s roads is a
priority. For example, since 2007 Council has regularly undertaken community
satisfaction surveys which have consistently demonstrated that Council is not
meeting the community’s expectation for the condition of assets such as
roads. The community view aligns with Council’s Strategic Asset
Management Plan with respect to prioritising the fixing of Byron’s roads.
The
Strategic Asset Management Plan highlights that unless increased and sustained
investment occurs, the progressive deterioration and failure of the road
network will accelerate.
The
most recent Community Survey was conducted in 2016. Significantly, of all the
services provided by Council, local roads had the lowest satisfaction score of
1.75, where a score of 1.0 is ‘Not at all Satisfied’ and a score of
5.0 is ‘Very Satisfied’. Local Roads were given the highest
importance ranking by the community in both the 2013 and 2016 surveys (Figure 8
Customer Satisfaction Transport Assets Performance Gap). In combination with
the lowest satisfaction score, Table 3 shows that the poor condition of roads
in Byron Shire has resulted in the largest performance gap score of 2.99 (IPART
Application, 2017-18). This information has been utilised when constructing the
customer levels of service Table 4 to Table 7.
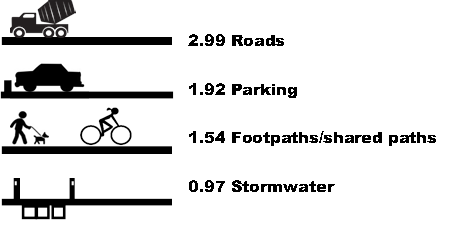
Figure 8 Customer Satisfaction Transport Assets Performance Gap
Table 3 Customer Satisfaction Performance Gap Ranking (Summarised version)
|
Ranking
2013
|
Ranking
2016
|
Service/Facility
|
Importance
Mean
|
Satisfaction
|
Performance
Gap
|
|
1
|
1
|
Local
Roads overall
|
4.74
|
1.75
|
2.99
|
|
5
|
2
|
Affordable
Housing
|
4.20
|
1.96
|
2.24
|
|
2
|
3
|
Public
Road
|
4.08
|
1.98
|
2.10
|
|
5
|
4
|
Long
term planning
|
4.68
|
2.68
|
2.00
|
|
7
|
5
|
Parking
|
4.42
|
2.5
|
1.92
|
|
3
|
6
|
Public
toilets
|
4.29
|
2.39
|
1.90
|
|
…
|
…
|
…
|
…
|
…
|
…
|
|
11
|
12
|
Bikeways
(Shared Paths)
|
3.99
|
2.45
|
1.54
|
|
10
|
13
|
Footpaths
|
4.20
|
2.77
|
1.43
|
|
…
|
…
|
…
|
…
|
…
|
…
|
|
21
|
23
|
Stormwater
|
4.05
|
3.08
|
0.97
|
Scale:
1 = not at all important/not at all satisfied, 5 = very important/very
satisfied
(IPART
Application, 2017-18)
In
addition to the very high performance gap ranking, when satisfaction is
compared with other local government benchmarks, the community were
significantly less satisfied with the condition of their roads. None of the 27
comparable measures were rated above the benchmark threshold of 0.15. The Byron
satisfaction score for Roads was 1.75 and the benchmark variance was -1.05.
The
2016 Community Satisfaction Survey concludes that when satisfaction versus
priority and investment across 12 asset classes which were analysed, it was
clear that “residents want to see an increased investment to address
the Road Infrastructure backlog” (IPART Application, 2017-18).
The
community have expressed concerns with paid parking. However, the return on
this is being invested into the Bring to Satisfactory backlog of $31 million
for road renewal. This funding strategy was addressed in the 2016 Fit for
Future Council Improvement Proposal.
Together
the community and technical levels of service
provide detail on service performance, cost and whether service levels are
likely to stay the same, get better or worse. Our current and projected levels
of service are documented below. These Key Performance Indicators
(KPI’s)for levels of service have been developed using the following
tools:
· Councils Customer Request Management System
· Surveys – community satisfaction survey
· Focus Groups – Road and Traffic Advisory Committee
· Facebook feedback
· Reflect™ inspections and defects
· Traffic studies
· Condition assessment e.g. laser Profilometer
· Roads and Maritime Services crash data
Residents want to see an increased investment to address
the Road Infrastructure backlog.
Staff Reports - Infrastructure Services 4.1 - Attachment 1
Table 4 Sealed Roads Levels of Service
|
SEALED ROADS -COMMUNITY LEVELS OF SERVICE
|
|
Key Performance Measure
|
Level of Service
|
Performance Measure Process
|
Performance Target
|
Current Performance
|
|
Quality[1]
|
Satisfactory and suitable
road network
|
Customer Requests for road
surface performance
|
<500 per year for sealed
roads potholes/edge break only)
Location in travel lane, Road
Hierarchy, and size of hole.
Hold Pothole repairs to $1.3M
and increase Heavy Patching. Previously nil Heavy Patching budgets. Increase
pavement renewals to increase quality.
|
Customer Request
Module (CRM) recording process to be reviewed. Low to moderate confidence
level with current processes.
Pothole Requests(CRM =
POTHOLE)
2017 = 526
Pothole/Edge Break
$ 1,279,290 maintenance exp.
2016/17
Heavy Patching AC
$ 6,184 maintenance exp.
2016/17
|
|
Customer Satisfaction
|
Road network meets community
expectations
|
Customer Survey
In 2016, 80% of our community
said that rural and urban roads should be a priority and more funding needed
to be invested.
|
LGA Benchmark value of 2.7
satisfaction (‘Moderately low’ level of satisfaction)
Rural Roads Unsealed = 2.61
|
No Met.
2016 Community Research
Satisfaction E2016/77989) Scale = 1 Not satisfied, 5=very satisfied
Local Roads = 2.23
Urban Roads = 2.13
|
|
Function –
Impact of works
|
Good construction practices
during and planning for construction
|
Business and personal
disruptions during construction
|
<30 complaints per year as
a result of recent construction
|
CRM process to be
reviewed to record ROAD CONSTRUCTION COMPLAINTS
|
|
|
Function / Safety1
|
Provide a safe network
|
Line marking – Customer
Requests
Street Signs – Customer
Requests
Guideposts
Roadside Barrier
|
· Prioritise
line-marking in accordance with the Road Hierarchy and a Risk Based Approach
of Heavy Rural Traffic/High Speed
· Target Road signs with a risk
based approach within the available budget and the Signs
· Guidepost standards APPENDIX
A - Table 1 are achieved within the available budget
· Roadside
Barriers (Prioritise Hierarchy TBC)
|
Customer Request
Module (CRM) recording process to be reviewed to include ROAD
SIGNS, LINEMARKING, GUIDEPOSTS, ROAD BARRIERS.
Line marking
$32,245 – Maintenance 2016/17
$58,030 – Capital2
Road Signs
$170,214 – Maintenance 2016/17
$57,734 – Capital2
Guidepost
$12,795 – Maintenance 2016/17
$49,044 - Capital2
Roadside Barriers
$5,553 – Maintenance 2016/17
|
|
Function/
Accessibility
|
Roads will be accessible 24
hours a day, seven days a week
|
Road Closures –
Customer Requests/TRIM
|
<10 complaints per year, except
were appropriate notifications were published in advance for special events,
maintenance or capital works.
Note: This
does not include natural disaster events, causeways/culverts that flood and
roads such as Possum Shoot (4.5t) that have permanent Heavy Vehicle load
limits from previous slip events.
|
CRM process to be
reviewed to record Road Accessibility in the classifications.
CRM = ROAD CLOSURE
|
|
Function/ Aesthetic
|
Provide roads and street that
are clean and free from dust and refuse
|
Street sweeping
|
<10 complaints per year.
Programmed street maintenance
of 2,159km/year with current budget of $289,016. Byron Streets CBD Daily
& Twice Weekly areas (16.516km/wk) Brunswick Heads CBD Daily (6.44km/wk)
Mullumbimby CBD Daily (12.07km/wk) Bangalow CBD Mon, Wed, Fri (6.492km/wk)
|
CRM process to be
reviewed to record Street sweeper
CRM = STREET SWEEPER
Street sweeper
$289,016.83
Performance under review.
|
|
Responsiveness
|
Response Times
|
Response times of Defects in
accordance with Infrastructure Services Risk Management Procedure
(E2015/23531) Road Risk Rating Section 1.6
|
< TBC% overdue outstanding
defects
Surface Pavement Damage =
Potholes, shoving, rutting, & joints
|
Reflect™
Reporting Current Surface Response Performance in 2016/17Avg Target Response
vs. Ave. Actual Response days
Regional
37 97
Distributor 37 99
Rural Major 70 161
Collector 104 88
Local 140 95
Rural Minor 140 194
Rural Access 153 245
Access 156 138
|
|
Travel
|
Travel delays
|
Peak Traffic congestions
|
Based on intermittent audits.
<8 minutes on Tennyson
Street/Browning Street Roundabout and McGettigans Lane
|
R545 Study DM844180 –
Travel time between the Tennyson Street/Browning Street Roundabout and
McGettigans Lane increases from 7 minutes in 2008 to 9 minutes in 2028 is the
PM peak (this represents a 30% increase in travel time, which is considered
unacceptable)
|
|
SEALED
ROADS-TECHNICAL LEVELS OF SERVICE
|
|
Key Performance Measure
|
Level of Service
|
Performance Measure Process
|
Performance Target
|
Current Target
|
|
Road Condition
Parameter1
|
Roughness
|
NAASRA roughness counts/km
Condition 1 = <60
Condition 2 = 60 to 90
Condition 3 = 90 to 120
Condition 4 = 120 to 170
Condition 5 = >170
|
NAASRA average counts/km
URBAN 130
RURAL 120
|
NAARSA average counts/km
URBAN 172
RURAL 149
|
|
Condition – Road
Renewal
|
Reseals
|
Kilometres resealed
|
TBC
Sealed Design Life
Bitumen average 12years (335km[TB2] ) =28km/year
Asphalt–
average15 years (165km) = 11km
Concrete – 40 years
(1.959km)
(Austroads AGPT05-11)
|
Reseals[2]
30km bitumen /year
11km Asphalt / year
2016/17 = 11.4km $631,537
2015/16 – 32.9kms $2,022,669
Reseals 2014/15 – 9.473 kms
$481,369
|
|
Condition Road Renewal
|
Reconstruction
|
Kilometres reconstructed
|
TBC
Road Design Life 20 years [TB3]
|
Reconstruction ** Target6km /year
2016/17 = 5.97km$5,051,321
2015/16 – 3.4km $3,106,518
2014/15 – 1.45km
Maintenance $2,337
|
|
Condition – kerb
and gutter
|
Technical Condition
Assessment
|
As per the Asset Condition
Assessment document DM1101346
|
Critical High Risk failed
kerb and gutter to be repaired in accordance with the available budget
|
TBC
Maintenance
& Capital Expenditure 16/17
$704,378
|
|
Safety1
|
Provide a safe network
|
Crash/Accident Data –
Roads & Maritime Query: CRASURF = 1 (sealed)
CRAHAZ = ANY
CRAROAD = 3 (other classified
road) and 4 (unclassified road)
|
<20 crashes / year caused
by loose gravel on rural high speed e.g. gravel on shoulder, potholes,
corrugations/ roughness, slippery surface, flooded/submerged or other
hazardous feature
|
MetCrashes
Year (Jan-Dec)
2016 -
2
2015 -
2
2014- 12
2013-
7
2012-
8
|
|
Safety / Risk
|
High Speed > 80km/hr rural
areas are given priority for reseals and reconstructions
|
Crash data analysis
|
Priority on rural roads high
speed (>80km/hr)
Injuries = 40
Fatalities = 0
|
2016
Rural Roads High speed
Crashes
= 64
Injuries
= 47
Fatalities
= 0 (25% Wet conditions, 40% Exceeding Speed limit)
|
|
Capacity
|
Load
|
Load limits
|
10km with load limited roads,
except those affected by slip sites/ natural disasters
|
Possum Shoot Roads has a 4.5
tonne limit
|
|
Travel
|
Heavy vehicles
|
AADT Heavy Vehicle %
|
Roads do not exceed the Heavy
Vehicle Design Loads
|
TBC
|
Table 5 Unsealed Roads
Levels of Service
|
UNSEALED
ROADS –CUSTOMERLEVELS OF SERVICES
|
|
Key Performance Measure
|
Level of Service
|
Performance Measure Process
|
Performance Target
|
Current Performance
|
|
Quality
|
Provides safe passage
commuters
|
Number of investigations by
staff from customer requests management (CRM)
|
Fewer than 100 requests for
maintenance of existing unsealed roads annually
|
Customer Requests for
Grading (CRM=GRADING)
2017=89
2016=49
2015=64
Actual Expenditure of
Unsealed roads
$ 390,083.93 maintenance
2016/17
(Including drainage, signs,
guideposts etc.)
|
|
Function
|
Road network is appropriate
to users needs
|
Roads meet service hierarchy
requirements for traffic volumes, design speeds, width, alignment, access
etc.
|
Rip, add 20-50mm of gravel,
profile and maintain drainage every road once every 2nd year
|
When segments reach a
condition 4 or 5 they are possibly graded pending available budgets.
|
|
Capacity
|
Sealed road capacity is
appropriate to service hierarchy
|
Road width and usage is
appropriate to service hierarchy.
|
No reduced speed limits.
|
Met
|
|
UNSEALED
ROADS – TECHNICAL LEVELS OF SERVICES
|
|
Safety
|
Provide a safe network
|
Crash/Accident Data –
Roads & Maritime Services
Query: CRASURF = 1 (unsealed)
CRAHAZ = ANY
CRAROAD = 3 (other classified
road) and 4 (unclassified road)
|
<20 crashes / year caused
by loose grave on rural high speed e.g., gravel on shoulder, potholes,
corrugations/roughness, slippery surface, flooded/submerged or other
hazardous feature
|
Met
2016 = 0
2015 = 0
2014 = 1
2013 = 2
|
|
Safety / Risk
|
High Speed >80km/Rural
Areas are given a priority for re-sheeting
|
Crash Data Analysis
|
Priority on Rural High speed (>80km/hr)
Injuries= TBD
Fatalities = TBD
|
2016 High Speed
Crashes = 2
Injuries = 0
50% Wet Conditions
50% Exceeding Speed Limit
|
Table 4 Traffic Control
Devices Levels of Service
|
TRAFFIC
CONTROL DEVICES – CUSTOMER LEVELS OF SERVICES
|
|
Key Performance Measure
|
Level of Service
|
Performance Measure Process
|
Performance Target
|
Current Performance
|
|
Quality
|
Maintained roundabouts,
islands and median strips
|
Frequency of complaints
regarding appearance of landscape
|
<10 requests for maintenance
of existing landscape relating to traffic control devices per year (excluding
request for capital upgrades)
|
TBD
CRM process to be
reviewed to record Roundabout/Islands in the classifications.
|
|
Capability
|
Capable of use by all
vehicles
|
Designed and constructed to
function correctly
|
Compliance with the emergency
services requirements
|
Met
|
|
Function
|
Achieves desired traffic
calming results
|
Post installation
investigations
|
< 5 complaints per year
regarding installation after the first year.
|
TBD
CRM process to be
reviewed to record Roundabout/Islands in the classifications.
|
|
Safety
|
Existing installation fit for
purpose
|
Compliance with relevant
standards at time of the installation. Unacceptable hazards identified and
dealt with promptly
|
Hazards found during
condition inspection audits. Defects addressed by the end of the financial
year.
|
TBD – in
progress
Reflect™ to
include Traffic Control Devices
|
|
Safety
|
New installations are safe
and do not present dangers to the public
|
Designed and installed
according to current legislation
|
All new installations
designed and installed as per current legislation
|
Met
|
Table 6 Footpath and
Shared Path Levels of Service
|
FOOTPATHS/SHARED
PATHS – CUSTOMER LEVELS OF SERVICES
|
|
Key Performance Measure
|
Level of Service
|
Performance Measure Process
|
Performance Target
|
Current Performance
|
|
Quality
|
Provides safe pedestrian and
or cycle travel for commuters
|
Number of investigations by
staff from customer requests management (CRM) regarding insurance claims
|
Fewer than 5 insurance claims
annually
|
Customer Request
Module (CRM) recording process to be reviewed. Add an insurance claim
category separate from footpaths REPAIR, TRIPHAZ, MISC, OBSTRUCT. Address
categorisation process for reporting.
2016/17 CRM’s
New footpath requests = 2
Clean request = 1
Debris removal = 2
Hazard requests = 28
Customer’s hazards
expectations are higher than what can be achieved with available funds (Refer
to the Asset Risk Management Procedures).
|
|
Capability
|
Surface
|
Defect Inspections annually
as per Asset Risk Management Procedures
|
Critical High Risk
footpath/Shared Paths to be repaired in accordance with the available budget
and condition inspections priority repair program
|
Highest risk defects
addressed with the available budget of $100,000 annually.
|
|
Function
|
Compliance with DDA
|
Compliance requirements
|
New installations meet
Legislative Requirements. Existing facilities to meet DDA requirements when
further maintenance work conducted.
|
Met
|
|
Function
|
Legislative
|
Hard surface, minimum
footpath 1200mm wide Shared Path 2000mm wide (AS1428 Parts 1 & 2 &
Austroads 2009 GUIDE TO PEDESTRIAN AND CYCLIST PATHS)
|
Meets Standards (BSC Shared
Paths, Footpaths and Shared Paths Technical Specifications E2018/2497)
|
Met
|
Table 7 Kerb and Gutter Levels of Service
|
KERB
AND GUTTER – CUSTOMER LEVELS OF SERVICES
|
|
Key Performance Measure
|
Level of Service
|
Performance Measure Process
|
Performance Target
|
Current Performance
|
|
Quality
|
Kerb and Gutter is in a
condition appropriate for its use.
|
Free draining with no ponding
of water.
|
TBC (Fewer than 20 requests
for maintenance of existing unsealed roads annually)
|
CRM process to be
reviewed to record kerb and gutter requests.
Actual Capital Expenditure of
Kerb and Gutter
$ 704,378 (majority Renewal)
|
|
Function
|
Kerb and gutter conveys
stormwater from roads in a safe, harm free and efficient manner.
|
Meets road hierarchy
requirements for type, location and capacity.
|
Very Poor – kerb is
discontinuous, uneven in grade and ponds water
|
Overall Condition Fair to
Poor
|
|
Capacity
|
Stormwater flow is contained
within kerb and gutter.
|
Over-kerb overflows are
minimal.
|
Poor / Very Poor –
Stormwater overflows kerb and gutter over sections or length
|
Overall Condition Fair to
Poor
|
Table 8 Stormwater
Levels of Service
|
STORMWATER
– CUSTOMER LEVELS OF SERVICES
|
|
Key Performance Measure
|
Level of Service
|
Performance Measure Process
|
Performance Target
|
Current Performance
|
|
Quality – Minor
Flooding in street
|
Minimal disruptions
associated with minor flooding
|
Complaints from residents
regarding repeat minor flooding
|
<10 complaints per year
|
CRM process to be reviewed to
record FLOODING STREET
|
|
Quality – Flooding to
properties
|
Private properties not being
damaged by Council drainage
|
Adequate drainage in place
|
<3 complaints per year
|
CRM process to be
reviewed to record FLOODING PRIVATE LAND
|
|
Quality – Major
Flooding
|
Adequate mitigation of
flooding events – warning, reduction of damage, etc.
|
Adequate systems in place and
appropriate knowledge of risk
|
Complete regional study(ies)
and implement recommendations as per the program and funding
|
Met
|
|
Quality
|
Provide efficient method of
collection and disposal of stormwater
|
Customer Satisfaction survey
2016
|
LGA Benchmark value of 2.7
satisfaction
Scale: 1 = not at all
important/not at all satisfied, 5 = very important/very satisfied
|
Met (3.08)
|
|
Quality
|
Capital renewal of
infrastructure
|
Replacement of aging asset
|
Replace one causeway each
financial year
|
Not Met
|
|
Function –
Impact of works
|
Good construction practices
during and planning for construction
|
Business and personal
disruptions during construction
|
<3 complaints per year as
a result of recent construction
|
CRM process to be
reviewed to record ROAD CONSTRUCTION COMPLAINTS
|
|
Function – maintenance
|
Maintenance levels keep the
drainage system functioning
|
Function of the drainage
system
|
<40 complaints per year
regarding flooding and <5 insurance claims per year
|
CRM process to be
reviewed to record appropriate classifications for reporting.
CRM = FLOODING
INSURANCE, and combined FLOODING STREET / FLOODING PRIVATE LAND
|
|
Capacity
|
Designs meet or exceed
industry best practice regarding capacity and Environmental Design
|
Current Australian Standards
and guidelines met
|
Guidelines met or exceeded
|
Met
|
Staff Reports - Infrastructure Services 4.1 - Attachment 1
Maintenance
Levels of Service refer to those service
levels delivered on a day to day nature. Refer to the Draft Infrastructure
Services Risk Management Procedures for further details.
The
Risk Management Procedure (E2015/23531) outlines:
1. The
required response to defects and hazards
2. The
expected inspection interval and frequency
3. Risk
rating procedures and priority rankings
4. Response
times to inspect and/or repair defect and hazards
5. Resources
required to deliver specified services.
The
service levels do not apply during a weather event within the local region.
During such an event all available resources will be allocated to attending to
emergency works.
This
Transport Asset Management Plan acknowledges the link between workload indicators
and intervention actions. For example, a substantial increase in road works
(through development or upgrades) can materially impact on the ability to
maintain and respond to defects and hazards, if not also accompanied by a
comparable increase in maintenance budget allocation or resources.
The
standards of maintenance are considered reasonable, however, it’s noted
that community satisfaction is below the acceptable standard of 3 in most
cases.
Further
detail regarding Maintenance levels of service are discussed in the Maintenance
Plan Section 8.
Condition Assessment
The Community
Infrastructure Asset Assessment Manual (DM1101346), outlines the strategic
inspection plans and the condition, functionality and capacity assessment
guidelines for Transport Assets, excluding road surface and pavement. This is a
live document which is modified as required to account for changes in
technology, requirements and processes. Condition information must be accurate
and repeatable to support this Plan, the capital works programs and the asset
management predictive modelling.
The Community
Infrastructure Asset Assessment Manual has implemented mobile android
devices for inspections, defects, accomplishments and electronic forms. The use
of mobile devices has removed a lot of paper based inspections and
accomplishment form completion.
Mobile
solutions have provided the following benefits:
· Reduced paperwork
· Reduced error
· Provided accurate and repeatable data gathering
· Enabled Byron to outsource repeatable tasks
· Enabled BSC to generate reports and create KPI’s etc.
5. Future
Demand
This
section evaluates potential factors affecting demand such as:
· Population growth
· Changing community expectations
· Development
· Changes in demographic
· Strategic network extensions and upgrades
These
factors will affect the renewal and upgrade of the existing network and
addition of assets, which in turn affects the maintenance and operational
resourcing and budgeting.
Demand Forecast
Population
trends can be used as a guide in determining future demand. Information from
NSW Planning & Environment below indicates that Byron Shire is currently
experiencing growth, which is expected to continue (Table 9).
Table 9 NSW population projections regional LG data
|
Forecast
Year
|
Change
between 2011 and 2036
|
|
2011
|
2016
|
2021
|
2026
|
2031
|
2036
|
Total
Change
|
Total
Increase Rate
|
|
30,700
|
32,400
|
33,850
|
35,250
|
36,650
|
37,950
|
7,250
|
1.24
|
This
population growth may see an increase in maintenance requirements across the
Transport asset network along with capital renewals and upgrades.
There
is also potential for increased developer contributed assets that will
alleviate some of the strains placed by an increase in population and the
corresponding expectations and requirements. However, this will also see a need
for increasing maintenance expenditure and resourcing as the assets begin to
age.
Demand Management Plan
The
demand for Transport Assets is expected to increase proportional to the
population growth projected for the region. This also aligns with the
expectations from the community where sealed local roads in both urban and
rural areas scored in the top 3 priorities (Figure 9).
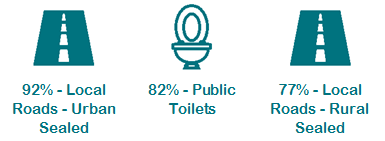
Figure 9 Top 3 Community Priorities (BSC Survey, 2016)
Managing
the demand for services will involve both asset and non-asset solutions.
Non-asset
solutions put emphasis on providing the required level of service without
making changes to the current asset stock. This includes reducing the level of
service, reducing demand for the service and providing education to the
community to accept appropriate asset failures.
Asset
solutions include the renewal, upgrade and creation of assets and often places
increased strain on current resourcing.
Key
drivers for demand that have been identified are shown below (Table 10).
Table 10 Demand management plan summary
|
Demand
Driver
|
Impact
on Services
|
Demand
Management Plan
|
|
Capacity
· Population growth
· Tourism
|
Requirement
to upgrade or expand the Road infrastructure network
|
· Fund priority works by seeking grant funding and
implementing the Section 94 plan
· Educate the community on the costs associated with
maintaining current service levels and increased costs required with
increased network
|
|
Capital
/ Maintenance Works
· Asset growth
· Aging asset stock
· Expectation from community for quality road network (as
identified in consultation)
· Increased bike and foot paths
· Early failure of developer contributed assets
· Increase costs associated with works due to increase in
traffic management
|
Requirement
to upgrade the Road infrastructure network
|
· Consult with community on options and funding
requirements
· Inform community and manage expectations. Communicate
levels of service and financial capacity to balance infrastructure priorities
with what the community is prepared to fund.
|
|
Development
· Increased development to accommodate increased population
and demand
|
Additional
infrastructure required to cope with demand
|
· Monitor and manage development controls
· Undertake infrastructure planning taking into account
land use changes
|
New Assets from Growth
The
purpose of the Section 94 Development Contributions Plan 2012 (Amendment 3)
(the Plan) is to enable Byron Shire Council to request contributions from
developers. These contributions are expected to provide services that are
likely to be required as a result of development throughout Byron Shire. The
Plan also outlines the programmed work to be completed as part of the Section
94 contributions, a copy of the Plan is available on Council’s website (http://www.byron.nsw.gov.au/developer-contributions-plans).
The
Section 94 plan requires the carrying out of works or the payment of
contributions to go towards the provision, extension or augmentation of
services and facilities that will, or are likely to be, required as a
consequence of development in Byron Shire.
The
Byron Shire Bike Plan was developed in order to endorse the expansion of the
existing network of bicycle facilities in Byron Shire. The Plan is based on
extensive research, review of existing infrastructure and future requirements,
and community consultation. The Section 94 Plan considers the Bike Plan in the
provision of developer contributions and identification of suitable projects.
Changes in Technology
Byron
Shire Council uses mobile android devices for inspections, defects and
electronic forms. It utilises Asset Edge Reflect™ which
synchronises data to a cloud solution and information can be available
simultaneously in the office. As such council does not use any paper systems to
manage the Transport Assets. Additionally, Council uses ArcGIS Collector apps
for field inspections, data capture and cleansing spatial data. Council has
used GPS technology for footpath inspections since 2006.
Council
has all assets mapped in the Geographical Information System and available to
office staff one-to-one with the Authority Asset Register.
Council
has recently purchased a Drone for asset inspections, aerial photography and
video. This solution provides the ability to gain access to difficult sites
that would not previously have been inspected or have required expensive
traffic control. Examples include under bridges or very high retaining walls on
Brunswick Valley Way. It is also providing the ability to engage with the
community via Facebook.
Council
has employed SPOT Satellite Personal Tracker technology for staff working alone
doing inspections in remote locations where there is no phone reception. SPOT
GEN3 uses Global Satellite with GPS messenger to send messages to supervisors
that they are ok, or if the worst should happen it sends emergency responders
the GPS location with a push of a button (SPOT, 2017).
Byron leads asset management
with the latest technology and innovation.
6. Asset
Management Practices
This
section outlines the decision-making tools currently used to determine long
term maintenance, renewal and upgrade expenditure for Transport Assets. As a
result of Council restructuring an asset team was formed in 2015. This now
consists of 4 full time staff dedicated to strategically managing assets. This
has provided the opportunity to increase capacity and scale to improve asset
management systems and technologies detailed in Figure 10 Asset Management
Systems and Elements.
Financial Systems
Council
currently uses Authority as the financial management and accounting system.
Asset Management Systems
Council
utilises Authority software as the asset management system. Authority contains
details of all Council assets, their attribute and condition information. At
present 35,300 (Jan 18) assets are linked to Council’s corporate GIS
system which is used to show asset locations in a spatial manner in conjunction
with cadastral, topographic and aerial information.
Assetic
Predictor© was used to perform the strategic modelling prediction analysis
to determine the future strategies and capital expenditure plans detailed in
the Financial Summary section (Figure 10).
Asset management systems are well established and
integrated.
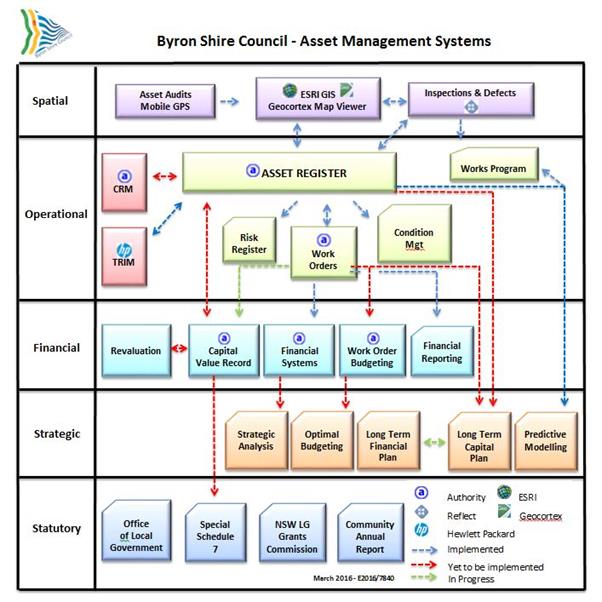
Figure 10 Asset Management Systems
and Elements
Accounting Framework
The
following Accounting Framework applies to local government in New South Wales:
· Local Government Code of Accounting Practice and Financial
Reporting
· AASB 13 Fair Value Measurement – prescribes fair
value measurement of assets
· AASB 116 Property, Plant & Equipment – prescribes
requirements for recognition and depreciation of property, plant and equipment
assets
· AASB 136 Impairment of Assets – aims to ensure that
assets are carried at amounts that are not in excess of their recoverable
amounts
· AASB 108 Accounting Policies – specifies the policies
that Council is to have for recognition of assets and depreciation
Standards and Guidelines
Asset
Management practices and processes are driven by a number of legislative
requirements and assisted various asset management guidelines.
· NSW Local Government Act 1993 and Roads Act 1993, defines
that Council is responsible for the regulation of the Transport Assets within
its boundary areas.
· Australian Accounting Standards set out the financial asset
accounting reporting requirements on Local Governments.
· International Standard ISO55000
· International Infrastructure Management Manual developed by
IPWEA (Provides guidance and direction on asset management policy and plan
development).
· Australian Infrastructure Financial Management Guidelines
developed by IPWEA (Provides guidance and direction on asset accounting).
Risk Management
Byron
Shire acknowledges that risk management is an essential part of best practice
asset management. The risk assessment process identifies credible risks, the
likelihood of the risk event occurring, the consequences should the event
occur, develops a risk rating, evaluates the risk and develops a risk treatment
plan for non-acceptable risks.
The Draft
Infrastructure Services Risk Management Procedure (E2015/23531), available
at Council offices, outlines the process of identifying and managing risks for council’s
infrastructure assets.
7. Lifecycle
Management Plan
Life
cycle management is an integrated approach to optimising the asset life cycle
from the initial idea through to disposal (Figure 11). This section discusses
the identification of renewal, new, upgrade and maintenance works that are
required at each stage of the asset life.
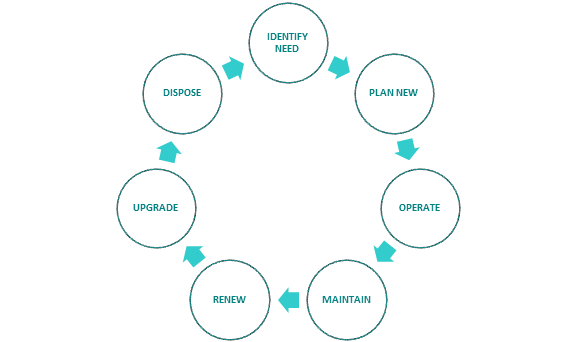
Figure 11 Asset life cycle stages
Asset Capacity and Performance
In
general, the capacity of the transport infrastructure network is adequate
throughout most of the shire. However, there are significant capacity issues
associated with MR 545 (Ewingsdale Road to Broken Head Road at the south
boundary) and the Byron Bay town centre. There may be intersection capacity
issues on Mullumbimby Road in the 10 to 20 year time frame.
The
community was extensively consulted throughout the special rate variation
process, with the IP&R documentation clearly discussing the full extent of
the rate rise. While some earlier consultation material did not clearly outline
the base case (no Special Rate Variation) scenario, this was corrected in later
consultation by the council.
The
council used a range of engagement methods to make the community aware of the
need for, extent of and impact of the rate rise and to seek community feedback.
It gave detailed explanations about the purpose and impact of the Special Rate
Variation (SRV), and provided opportunities for community feedback.
While
the community feedback for the SRV was broadly negative, the council adequately
demonstrated the community was aware of the size and need for the SRV.
Through
community consultation, the council found that large proportions of respondents
supported increased investment in:
• buildings
and public amenities (88% supported)
• transport
assets, including roads, bridges, and road drainage (83% supported)
• drainage,
including urban and rural stormwater (73% supported), and
• park
facilities (71% supported).
The
council’s IP&R documents clearly indicate the community is
dissatisfied with the current condition of these assets, and supports more
expenditure to improve service levels (IPART, 2017-18).
Asset Condition
Council
has a condition assessment manual that outlines the strategic inspection plan
for Transport assets. In addition to this Council also undertakes recurring
road and bridge inspections. Each asset, or component, is condition scored from
1 to 5, as defined in Levels of Service Table 2. The condition scoring
scale follows internationally accepted good practice.
Bridge
inspections are carried out as per NSW Roads and Maritime Services inspections
procedure manual. The results of these condition assessments are then used in
our predictive modelling software, Asset Register and Geographical Information
System.
Useful Lives and Unit Rates
The
Byron Shire average actual life of Transport assets is typically longer than
industry average. Council tends to run assets to the point of failure due to
the nature of aging infrastructure and lack of capital funding. At present
council does not have financial capacity to replace or renew assets at optimal
points during the life of the asset. This data is represented in Table 11 Transport
assets useful lives and Figure 12.
Table 11 Transport assets useful lives
|
Asset Type Component
|
Material
|
Byron Shire
|
Industry Average
|
|
Sealed
Road Surface
|
Asphaltic
Concrete
|
35
|
24
|
|
Spray
Seal
|
30
|
16
|
|
Concrete
|
115
|
100
|
|
Slurry
Seal
|
30
|
16
|
|
Pavers
|
115
|
44
|
|
Sealed
Road Pavement
|
Pavement
Base and Sub-base
|
75
|
75
|
|
Unsealed
Road
|
Gravel
|
7
|
15
|
|
Footpath
|
Concrete
|
70
|
51
|
|
Asphalt
|
50
|
30
|
|
Timber
|
30
|
20
|
|
Pavers
|
45
|
40
|
|
Other(Concrete
Aggregate, Asphalt/Pavers, Plastic)
|
50
|
51
|
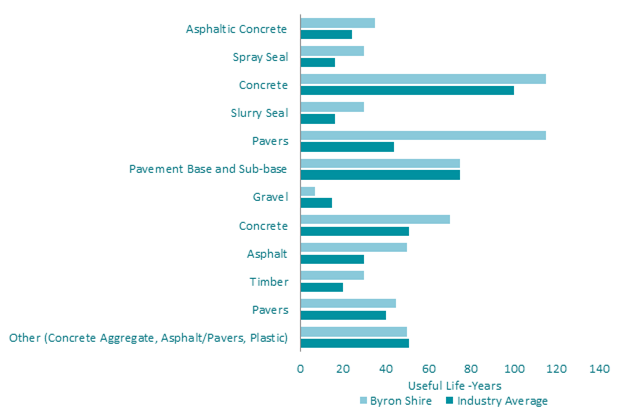
Figure 12 Actual life comparison between industry average and Byron Shire
Useful lives are longer than industry average which
requires more maintenance.
Table 12 Transport
assets treatment unit rates
|
Asset
Type
|
Material/Treatment
|
Unit
Rate ($/m2)
|
|
Unsealed
Road
|
Gravel
Re-Sheeting
|
10.50
|
|
Sealed
Road
Note: Heavy patching AC will move from AC profiling and patching
towards “granular patching 300mm deep with road base and primer seal
surface (leaving the seal to cure for 3-6months). This is expected to reduce
heavy patching costs substantially.
|
Reseal
(Single/single Spray Seal & preparation)
Note: Reseals WO 2017 ~ $10.48m2, was $8 used in
Predictor©
|
11.00
|
|
AC
Overlay (40mm)
|
23.50
|
|
Reconstruction
Rural
(300mm
pavement, bitumen seal, table drains, driveways, & pipe
culverts)
Note: WO’s 2017 $167.32,was $70 used in
Predictor ©
|
167.32
|
|
Reconstruction
Urban
(300mm
pavement, AC seal, K&G)
Note: WO’s 2017 $167.32, was $150 used in
Predictor©
|
170.30
|
|
Heavy
Patching (profiling and 100mm deep)
Note: was $50 in Predictor©
|
88.00
|
|
Footpath
|
Footpath
Renewal
|
125.00
|
|
Footpath
Renewal & Widening
|
150.00
|
|
Shared
Path Renewal
|
125.00
|
|
Shared
Path Renewal & Widening
|
175.00
|
|
Ramp
Renewal
|
150.00
|
|
Stair
Renewal
|
150.00
|
At the
time of printing the values used in Predictor© were less than those
detailed above. As council matures the unit rates are recalculated off Work
Orders (WO) expenditure to refine to reflect actual replacement costs of
current projects.
Asset Valuations
Table 13 Transport asset
valuation data (SS7 30 June 17)
|
Asset
Category
|
Replacement Value ($)
|
Accumulated Depreciation ($)
|
Written Down Value ($)
|
Annual Depreciation ($)
|
|
Sealed Roads
|
229,941,000
|
108,104,000
|
121,837,000
|
3,396,000
|
|
Unsealed Roads
|
3,911,000
|
1,232,000
|
2,679,000
|
128,000
|
|
Bridges
|
23,909,000
|
11,079,000
|
12,830,000
|
293,000
|
|
Footpaths
|
8,627,000
|
3,124,000
|
5,503,000
|
126,000
|
|
Kerb and Gutter
|
23,973,000
|
6,661,000
|
17,312,000
|
288,000
|
|
Other - Retaining Walls and
Roadside Barriers
|
238,000
|
0
|
238,000
|
0
|
|
Traffic Control Devices
|
59,748,000
|
19,624,000
|
40,124,000
|
1,193,000
|
|
Car Parks
|
3,306,000
|
594,000
|
2,712,000
|
68,000
|
|
Road Barriers & Retaining
Walls
|
10,424,000
|
2,147,000
|
8,277,000
|
145,000
|
|
Stormwater
|
64,294,000
|
16,972,000
|
47,322,000
|
581,000
|
8. Maintenance
Plan
Standards and Specifications
Council
uses Reflect™ for inspections, defects and accomplishments, and
makes use of Asset Edge Reflect™ on mobile devices with built in
response times. A rolling inspection program of the whole Road network is
completed by a full time inspector who records defects against each asset. When
a defect is recorded, it is synchronised to the cloud and forms part of the
prioritised maintenance program. Signs, guideposts, roadside barriers, street
sweeping, and vegetation maintenance are managed through defects identified via
Reflect™ and customer requests. These too are prioritised and
managed based on risk, road hierarchy and available budget.
Footpaths
and Shared Paths are inspected annually and a prioritised works program is
generated in Reflect™. This process allows council to
strategically address the repairs with the allocated funds of $100,000
annually. Since implementation the overall condition of the footpath network
has improved and council has a reliable and repeatable process to manage the
assets.
On a
rolling annual basis a specialised bridge contractor completes the required
bridge inspection (Level 1, Level 2 and Level 3 as required by RMS bride
inspection policy, Policy Number PN158). A programmed maintenance plan is
created from the inspections for operational staff to complete pending
available funds.
The
major culverts and causeways are inspected by internal staff and a programmed
maintenance plan is created for operational staff. A specialised contractor is
brought in to complete the structural Risk Rating calculation when and where
required. Council has identified that there is an increasing risk to the major
culverts and causeways infrastructure due to not being able to fund and
complete the necessary maintenance and renewal tasks required to keep the
assets in safe and functioning order.
Future Maintenance Expenses
The
future maintenance expenses are detailed in Section 12, Table 19. A key point
to note in this table is the lack of funding allocated to Rural and Urban
Drainage and Kerb and Guttering. As discussed above there is an increased risk
to major culverts and causeways due to a lack of funding, this is evident in
the maintenance funding allocation.
Without
adequate maintenance, the major culverts and causeways have a reduced chance of
reaching their expected useful life in a reliable and safe condition. Through
increased data collection and strategic asset management, a valid figure for
required maintenance can be determined to help mitigate future risks.
There is insufficient maintenance for urban and rural
drainage.
The challenge is the competing pothole maintenance budget
of $1.3M.
Maintenance Challenges
· Council has a ‘planned reactive’
response to maintenance. This is an on going challenge to move into a
programmed and planned maintenance space for council with limited resources for
the Transport assets.
· Maintenance expenditure is 100 % reactive which is possibly
more costly than if forward planning occurs.
· Of that 100% maintenance cost 31% ($1.3 million in
2016/17) was spent on pothole patching. Only long term investment into
preventative capital reseal program improve the overall road condition (Figure 13).
· There are no budget items allocated for roadside barriers,
traffic control devices, kerb and gutter, retaining walls, Bus shelters,
roadside furniture, rural stormwater, footpaths and cycleways. This is an
ongoing hindrance to effective asset management as forward planning cannot be
fully undertaken in the current environment without a known funding allocation.
· The number of identified defects from programmed
inspections is far greater than available funds. The use of mobile inspections
does provide a built in risk based approach to prioritising repairs if funds
are available.
· A complete audit of the roadside barriers is required to
determine compliance with current Australian standards and to prioritise
maintenance.
· Council intends to commence a crack sealing program in the
2018/19 financial year. Previously this has not been a standard practice at
this council.
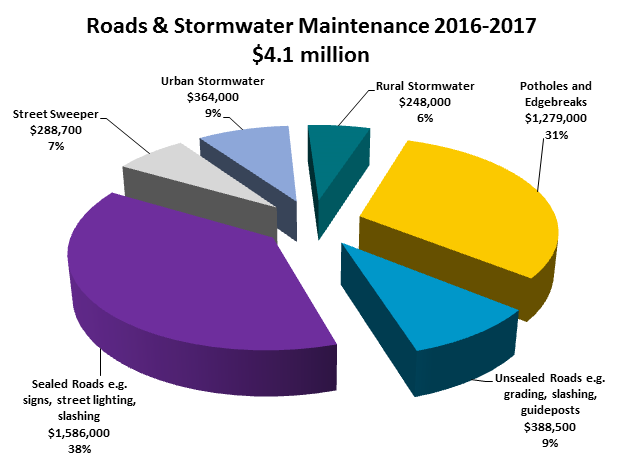
Figure 13 Road and stormwater Maintenance 2016-17
9. Renewal
Plan
Renewal Prioritisation
Council
uses Assetic Predictor©, prediction modelling software, to prioritise
capital works. The objective of this analysis is to model the performance of
the unsealed roads, footpaths, sealed roads and bridges.
The
process includes setting up:
· degradation profiles based on condition and remaining life,
· identifying current treatments and unit rates to deliver
these treatments, and
· setting up treatment decision matrices defined for optimal
interventions for each treatment.
By
utilising the above process and setting up the criteria and logic within Asset
Predictor©, it is possible to model the future costs of road, footpath and
bridge renewal requirements and predict the future condition based on different
budget options.
For
those assets that are not included in the modelling process at this stage, a
renewal program is developed based on a ‘Risk Management’ approach
using comprehensive individual Risk Matrixes containing condition data as well
as including social and environmental components for those particular asset
classes that have the required information to have these matrixes constructed
(in the future all asset classes will either have a modelling process or Risk
Matrix process applied). For those assets with no current modelling or Risk
Matrixes, a “worst first” approach is used are prioritised based on
the maintenance inspection details.
Predictive
modelling for the road pavement based on the special rate variation scenarios
predicted council capital renewal over the next 10 years to maintain the asset
was below (Table 14). This is a minimum requirement to hold the network from
further deterioration. This will still result in some roads reaching a point of
poor to very poor condition which are beyond reseal and require full
reconstruction.
To “maintain” the overall sealed road network
condition the average capital renewal needs to increase to10.4M by 2018.
Table 14 Asset Predictor© Modelling Sealed Roads to
“Maintain” at 10%
(Reseals and
reconstruction totals)
|
Year
|
Sealed Roads Budget Expenditure
Scenario modelling for Special Rate Variation of 10 %
|
|
1
|
$5,109,800
|
|
2
|
$5,808,629
|
|
3
|
$6,840,236
|
|
4
|
$7,974,985
|
|
5
|
$9,223,266
|
|
6
|
$9,453,847
|
|
7
|
$9,690,194
|
|
8
|
$9,932,448
|
|
9
|
$10,180,760
|
|
10
|
$10,435,279
|
Note: SRV
Predictor© Modelling of 10% (7.5% over 4 years + inflation of 2.5%/annum
rate peg) 28/11/16 using old reseals, reconstruction and heavy patching unit
rates.
Road Renewal Targets
The
following has been set as a renewal targets for sealed roads (Table 15) this
was previous detailed in Table 4 Sealed Roads Levels of Service.
Table 15 Road Capital Renewal
Annual Targets
|
Sealed Roads
Treatment
|
Network measure (km)
|
Target
Km/year
|
Estimated
Cost
|
Status
|
|
Bitumen
- Design Life Bitumen average 12years
(Austroads AGPT05-11)
|
335
|
28
|
$2M
|
Not met 2016/17
|
|
Asphalt
average 15 years (Austroads
AGPT05-11)
|
165
|
11
|
$1.8M
|
Not met 2016/17
|
|
Concrete
(Austroads AGPT05-11)
|
1.959
|
0
|
|
NA
|
|
Reconstruction
(partial or full depth)
|
|
6
|
$7.5M
|
Met 2016/17
|
|
TOTAL
|
|
|
$11.3M
|
|
Council
needs to be consistently averaging a total of 39km of reseals each year.
In previous years the reseal program has fluctuated and been inconsistent
(Table 16 Reseals for the last 3 years). In the last decade the reseal spend
was as little as $70,000. Below is the last 3 years spent of reseals:
Table 16 Reseals for the last 3 years
|
Year
|
Completed
Reseal length (km)
|
Expenditure
|
|
2016/17
|
12.3
|
$631,537
|
|
2015/16
|
30.3
|
$1,801,130
|
|
2014/15
|
9.473
|
$481,369
|
Councils
bitumen reseals cost have increased from $54,000/km to as high as $102,000 /km.
This is due to the road network being in poor condition and requires heavy
patching, and shoulder grading. To improve the safety level of service, line
marking is now standard with new reseals. Asphalt reseals are $23.50 m2
compared to $11 m2 for bitumen. Based on the reseals targets in
Table 15 the estimated bitumen reseal budget for bitumen should be $2 million
and $1.8 million for asphalt.
The reseals target is 39km per year averaging at $ 3.8M.
The reconstruction target is 6km per year averaging at
$7.5M.
Bridge Renewals
Progressive
inspections of Council’s bridges resulted in further load limits to
protect aging and deteriorated structures. The most seriously deteriorated
bridges were Parkers, Booyong, James, O’Meara’s and Scarrabelottis.
Replacement of these five bridges with conventional concrete structures would
have cost in the order of $16M. This cost was not affordable for Council and
not achievable via grant funding because these bridges are not on major freight
routes.
Council
has investigated and is now deploying an innovative renewal solution that
involves the recycling of surplus steel Australian Defence Force bridges which
is a viable option in these freshwater locations. The total program cost is in the
order of $7.5M.The lower overall cost and associated innovation has resulted in
the program being more attractive for grant funding and Council has been
successful in gaining $5.2M in grant funding. Prior to the success with grant
funding Council was considering a loan to fund the program. It is now possible
to redirect this loan capacity to the renewal of other critical assets that are
in a very poor condition which is a great outcome for the community.
Five Poor condition bridges will be replaced with steel
Australian Defence Force bridges for $7.5M in early 2019.
Impact of Deferring Renewal Works
Deferring
renewal works usually only occurs when the renewal requirements exceed the
available budget. The impact of deferring renewal projects impacts on the level
of service they’re able to provide. In the short term the impact may be
acceptable, however continued deferral can lead to an increase in backlog and
therefore risk (Figure 14).
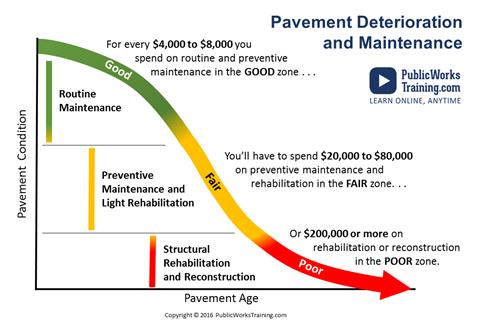
Figure 14 Pavement Deterioration and Maintenance Curve (Public Works
Training, 2016)
Managing the Risks and Renewal Challenges
As
discussed in the Strategic Asset Management Plan, there are increasing risks to
infrastructure associated with providing the service and not being able to fund
and complete the necessary maintenance and renewal. These risks must be
managed. The major risks are:
· Road reseals not completed when needed resulting in water
damage to the underlying pavement
· Significant sections of roads that are so damaged they
cannot be resealed and need costly reconstruction. Typically costs for capital
renewal ranges from $88m2 for heavy patching, to $170/m2
for full depth reconstruction compared with reseal costs of approximately $11/m2.
This alone represents a significant financial risk to the council.
· Limited stormwater and road side maintenance in rural areas
to reduce the risk of road failure and landslides in our high rainfall
environment.
· Potential bridge or bridge component failure, most notably
the timber bridges and footbridges.
· Damaged footpaths with the potential to cause trips and
falls in high pedestrian areas.
· Pavement damage due to water penetration caused by failed
kerb and gutter.
· Aging box culverts and causeways requiring major
replacement or repair.
· Load limiting or bridges, causeways and box culverts.
· Replacing or installing guardrail to comply with Austroads
standards.
Council
will endeavour to manage these risks within available funding by implementation
of asset management systems and inspection regimes, to provide a sound platform
for understanding the condition, maintenance and replacement schedule for all
assets.
10.
New and Upgrade Plan
Selection Criteria
New
and upgrade works can be identified from a number of sources including
community suggestions, internal knowledge, Councillors and strategies and
plans, such as the Section 94 plan and Bike Plan as well as Predictive
Modelling Software.
These
suggestions and strategies are assessed for validity, priority, benefit and
cost and can then be programmed into future capital works schedules.
At
this stage the main driver for new and upgrade work is through the Section 94
Plan. The Plan discusses population, demographic characteristics, contributions
and the identification of projects.
Developer Contributions
New
capital assets provided to council through Developer Contributions are handed
to council at agreed Levels of Service which comply with the Northern Rivers
Local Government Design and Construction Manuals. These service standards
have been developed as a resource sharing initiative involving the Byron Shire
Council, Ballina Shire Council, Clarence Valley Council, Lismore City Council,
Kyogle Council and Richmond Valley Council. The initiative has provided uniform
development standards for the region via a clear and comprehensive set of
requirements for development infrastructure design and construction.
Forecast Upgrade/New Expenditure
The current
forecast upgrade and new expenditure is presented in the Section 94 Plan in
detail.
New and upgrade work is mostly funded through the Section
94 Plan.
11. Disposal
of Assets
While
there are no current plans to dispose of Road infrastructure assets, Council
has previously downgraded assets in order to better reflect requirements and
save on maintenance costs.
After
assessing the functionality of a road segment it was deemed that the segment no
longer required a seal and was placing a strain on the already strained
maintenance and renewal budgets. This road then had the seal removed and was
reverted back to an unsealed road, which will require less maintenance and
capital funding.
12.
Financial Summary
This
section presents the financial requirements for Transport assets over the next
10 years as determined through Predictive and financial modelling. Note that
all figures shown incorporate a 2.5% inflation accounting for future dollars.
Financial Statements and Projections
The
following graphs show the financial projections for operational and capital
expenditure. The capital funding is taken from the Renewal Long Term Financial
Plan (LTFP) while the maintenance funding is determined from the actual funding
spent in 2016/17 and projected over 10 years with 2.5% inflation (Figure 15).
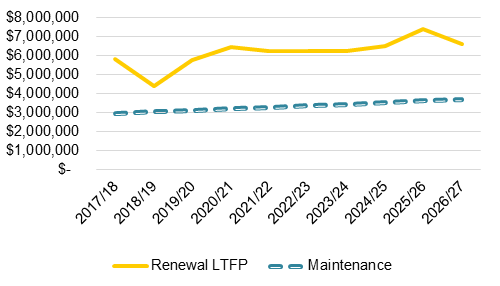
Figure 15 Long Term Financial Plan - Transport
Funding Strategy
The
projected expenditure discussed will be funded from Council’s
maintenance, operating and capital budgets. The funding strategy is detailed in
the LTFP. This plan also details the Special Rate Variation that Council
applied for, and received, in 2017. Figure 16Error! Reference source not found. displays the annual required renewal expenditure as
determined primarily through Predictor© modelling. Note that the Drainage
and Kerb and Gutter assets have not been included in the modelling process,
along with other assets, as asset details required for modelling are not
currently available. The funding level applied has been determined by Council
staff. This graph compares these values to the proposed LTFP.

Figure 16 Long Term Financial Plan (LTFP) funding & Annual Required
Renewal Expenditure (ARRE)
The
proposed Council approved LTFP (E2017/96003), capital and maintenance budgets
are presented below.
Long
Term Financial Plan (E2017/96003)
Table 17 Long Term
Financial Plan
|
Year
|
Sealed Roads ($)
|
Unsealed Roads ($)
|
Footpath ($)
|
Bridges ($)
|
Rural Drainage ($)
|
Urban Drainage ($)
|
Kerb and Gutter ($)
|
|
2017/18
|
3,224,600
|
255,000
|
246,540
|
369,100
|
755,000
|
825,000
|
164,360
|
|
2018/19
|
1,978,508
|
267,750
|
113,460
|
360,000
|
755,000
|
825,000
|
75,640
|
|
2019/20
|
3,181,363
|
281,138
|
118,620
|
517,000
|
755,000
|
825,000
|
79,080
|
|
2020/21
|
3,717,506
|
295,194
|
123,900
|
634,000
|
755,000
|
825,000
|
82,600
|
|
2021/22
|
3,623,146
|
309,954
|
129,480
|
522,000
|
755,000
|
825,000
|
86,320
|
|
2022/23
|
3,565,248
|
325,452
|
135,300
|
525,000
|
755,000
|
825,000
|
90,200
|
|
2023/24
|
3,552,776
|
341,724
|
141,120
|
551,000
|
755,000
|
825,000
|
94,080
|
|
2024/25
|
3,747,289
|
358,811
|
145,800
|
554,000
|
755,000
|
825,000
|
97,200
|
|
2025/26
|
4,685,649
|
376,751
|
150,240
|
516,000
|
755,000
|
825,000
|
100,160
|
|
2026/27
|
4,016,611
|
395,589
|
283,800
|
156,000
|
755,000
|
825,000
|
189,200
|
|
Total
|
35,292,695
|
3,207,363
|
1,588,260
|
4,424,073
|
7,550,000
|
8,250,000
|
1,058,840
|
Capital
Funding (E2017/86999)
Table 18 Capital Funding Predictor© (IS Master Sheet for 10 Year
Plan)
|
Year
|
Sealed Road Corridor ($)
|
Unsealed Roads ($)
|
Footpath ($)
|
Bridges ($)
|
Rural Drainage ($)[3]
|
Urban Drainage ($)3
|
Kerb and Gutter ($)3
|
|
2017/18
|
3,224,252
|
254,838
|
246,380
|
368,912
|
755,000
|
825,000
|
164,360
|
|
2018/19
|
1,976,939
|
266,370
|
113,370
|
359,839
|
755,000
|
825,000
|
75,640
|
|
2019/20
|
3,181,300
|
280,113
|
118,564
|
516,853
|
755,000
|
825,000
|
79,080
|
|
2020/21
|
3,717,268
|
294,612
|
123,622
|
633,933
|
755,000
|
825,000
|
82,600
|
|
2021/22
|
3,620,389
|
309,751
|
129,409
|
521,975
|
755,000
|
825,000
|
86,320
|
|
2022/23
|
3,562,915
|
325,060
|
135,108
|
524,796
|
755,000
|
825,000
|
90,200
|
|
2023/24
|
3,550,566
|
341,548
|
140,748
|
550,890
|
755,000
|
825,000
|
94,080
|
|
2024/25
|
3,746,968
|
358,316
|
145,564
|
553,898
|
755,000
|
825,000
|
97,200
|
|
2025/26
|
4,685,301
|
376,750
|
149,942
|
390,363
|
755,000
|
825,000
|
100,160
|
|
2026/27
|
4,015,353
|
395,069
|
283,753
|
2,611
|
755,000
|
825,000
|
189,200
|
|
Total[4]
|
35,281,255
|
3,202,431
|
1,586,465
|
4,424,073
|
7,550,000
|
8,250,000
|
1,058,840
|
Maintenance
Funding Modelled from Predictor© (Year Level Comparison)
Table 19 Maintenance Funding
Predictor©
|
Year
|
Sealed Road Pavement ($)
|
Unsealed Roads ($)
|
Footpath ($)
|
Bridges ($)
|
Rural Drainage ($)3
|
Urban Drainage ($)3
|
Kerb and Gutter ($)3
|
|
2016/17
|
2,379,418
|
390,084
|
11,180
|
32,000
|
|
|
|
|
2017/18
|
945,546
|
340,017
|
49,925
|
126,513
|
|
|
|
|
2018/19
|
986,362
|
448,391
|
51,260
|
115,284
|
|
|
|
|
2019/20
|
1,030,374
|
489,416
|
52,790
|
97,523
|
|
|
|
|
2020/21
|
1,075,272
|
492,665
|
56,771
|
74,661
|
|
|
|
|
2021/22
|
1,132,055
|
481,395
|
58,801
|
62,990
|
|
|
|
|
2022/23
|
1,193,621
|
488,622
|
61,987
|
44,922
|
|
|
|
|
2023/24
|
1,249,230
|
504,470
|
64,762
|
26,248
|
|
|
|
|
2024/25
|
1,285,153
|
515,796
|
68,607
|
8,926
|
|
|
|
|
2025/26
|
1,340,469
|
525,762
|
72,562
|
0
|
|
|
|
|
2026/27
|
1,419,383
|
522,784
|
78,508
|
0
|
|
|
|
|
Total4
|
11,657,471
|
4,809,322
|
615,975
|
557,069
|
|
|
|
Maintenance
Funding
Table 20 Maintenance Funding
|
Year
|
Sealed Roads
Corridor ($)
|
Unsealed Roads ($)
|
Footpath ($)
|
Bridges ($)
|
Rural Drainage ($)3
|
Urban Drainage ($)3
|
Kerb and Gutter ($)3
|
|
2016/17
|
2,464,312
|
375,034
|
6,784
|
73,740
|
96,029
|
357,928
|
2,337
|
|
2017/18
|
3,100,200
|
352,600
|
31,800
|
104,400
|
109,800
|
357,900
|
6,500
|
|
2018/19
|
3,340,000
|
359,600
|
32,400
|
103,400
|
112,000
|
365,000
|
6,600
|
|
2019/20
|
3,634,400
|
366,800
|
33,000
|
105,400
|
114,200
|
372,300
|
6,700
|
|
2020/21
|
4,106,200
|
374,100
|
33,700
|
107,500
|
116,500
|
379,600
|
6,800
|
|
2021/22
|
4,201,500
|
381,600
|
34,400
|
109,600
|
118,800
|
387,100
|
6,900
|
|
2022/23
|
4,299,600
|
389,200
|
35,100
|
111,700
|
121,200
|
394,900
|
7,000
|
|
2023/24
|
4,417,200
|
398,900
|
36,000
|
114,500
|
124,200
|
404,800
|
7,200
|
|
2024/25
|
4,538,700
|
408,900
|
36,900
|
117,300
|
127,300
|
414,900
|
7,400
|
|
2025/26
|
4,659,100
|
419,100
|
37,800
|
120,300
|
130,500
|
425,300
|
7,600
|
|
2026/27
|
4,775,600
|
429,600
|
38,700
|
123,300
|
133,800
|
435,900
|
7,800
|
|
Total4
|
43,356,812
|
4,255,434
|
356,584
|
1,188,140
|
1,304,329
|
4,295,628
|
72,837
|
The
Maintenance Funding budget for sealed roads includes the entire corridor. This
includes: street sweeper, stormwater, grading, slashing, guideposts, signs,
street lighting and potholes/edge breaks (Table 20). Predictor© modelling
includes pavement maintenance (Table 19). This is why the two tables for Sealed
Roads are so vastly different.
The
following Table 20 presents the actual funding required in 2016/17 for
maintenance for the listed assets and to bring awareness to the minimum funding
requirement for each of the asset types. While this is the actual expenditure,
there was not originally any budget allocated to maintain these assets. This is
an ongoing hindrance to effective asset management as forward planning cannot
be fully undertaken in the current environment without a known funding
allocation. As a result the work completed is highly reactive and possibly more
costly than if planning had occurred.
Table 21 Maintenance expenditure (2016/17)
|
Asset Sub Type
|
Expenditure 2016/17
|
|
Roadside
Barriers
|
$9,132
|
|
Traffic
Control Devices
|
$528
|
|
Kerb
and Gutter
|
$5,486
|
|
Retaining
Walls
|
$1,247
|
|
Rural
Stormwater
|
$61,892
|
|
Roadside
Furniture & Bus Shelters
|
$5,512
|
|
Footpaths/Shared
Paths
|
$10,784
|
|
Unsealed
Roads (grading/re-sheeting only)
|
$
338,978
|
|
Total
|
$433,559
|
The
Rural Drainage and Urban Drainage capital funding figures presented above
(Table 18) does not include the Stormwater Levy Program. The Stormwater Levy
Program is a Stormwater Management Service Charge that is collected through
council rates notices. Properties that benefit from stormwater drainage systems
can be charged the levy fee. The funds are then used to provide additional
stormwater service to eligible properties, i.e. private properties, not council
land.
The
funds levied from this program are dependent on the number of rateable
properties. The levy currently generates $320,000 per year. Works under this
program do not form part of the renewal program shown above because it is
targeted towards resolving drainage issues that affect private land, rather
than council land.
Financial
Challenges and Gaps
After
Level 2 structural inspections of causeways and major culverts council has
identified 7 urgent ($2.2million) and 16 high priority ($5.5million) poor
condition rural drainage assets. The 7 urgent assets are either load limited
and or have temporary steel plates and require full replacement. If the 16 high
priority assets are not addressed in the very near future load limits will be
implemented. These 23 rural drainage assets totalling $7.7 million is currently
unfunded (E2016/85152 & E2016/85145).
The
stormwater and road maintenance targets have been calculated using the known
identified defects in Reflect™ and council unit repair rates (E2018/11600
& E2016/98731). These calculations establish a level of service off known
defects and are in addition to Predictor© modelling.
Table 22 Financial Gaps
additional to Predictor© modelling
|
Asset Sub-type
|
Current Spend
2016/17
|
Gap
|
Required
Budget
|
|
|
CAPITAL RENEWAL
|
|
|
|
|
|
Road Capital Reseals
Note: (Table 15)
|
$1,800,000
|
$2,000,000
|
$3,800,000
|
|
|
|
Road Capital Reconstruction
Note: (Table 15)
(Not including new
assets)
|
$5,828,701
|
$1,681,820
|
$7,510,521
|
|
|
Stormwater / Drainage Capital Causeways & Major Culverts
|
$677,020
|
$7,700,000
|
$8,377,020
|
|
|
(E2016/85152 & E2016/85145)
|
|
|
MAINTENANCE
|
|
|
|
|
|
Roads
|
$3,542,797
|
$2,290,625
|
$5,833,422
|
|
|
(Work
Orders Roads)
|
(Reflect™
outstanding defects)
|
|
|
Stormwater
|
$611,908
|
$616,139
|
$1,228,047
|
|
|
(Work
Orders SW)
|
(Reflect™
outstanding defects)
|
|
|
TOTAL RENEWAL AND MAINTENANCE
|
$12,460,426
|
$14,288,584
|
$26,749,010
|
|
The current spend on reseals and
reconstructions fluctuate from year to year and are affected by maintenance
overruns.
Roads and stormwater have big financial
challenges with a current
Capital Renewal and Maintenance gap of
$14.3M.
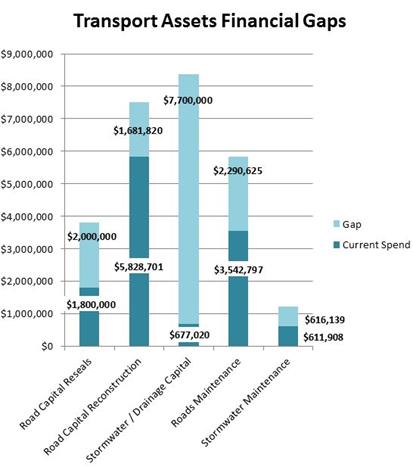
Financial Ratios
Asset
Consumption Ratio
This
ratio seeks to highlight the aged condition of a local government’s stock
of physical assets. If a local government is responsibly maintaining and
renewing/replacing its assets in accordance with a well prepared asset
management plan, then the fact that the Asset Consumption Ratio may be
relatively low and/or declining should not be cause for concern –
providing it is operating sustainably.

Purpose: This
ratio measures the extent to which depreciable assets have been consumed by
comparing their written down value to their replacement cost.
Standards: Standard
is not met if less than 50%.
Standard is met if the ratio can be measured and is 50% or
greater (0.50 or >). Standard is improving if the ratio is between 60% and
75% (0.60 and 0.75).
Table 23 Asset
Consumption Ratios
|
Asset
Financial Class
|
Current
Replacement Cost
|
Depreciated
Replacement Cost
|
Ratio
|
Standard
|
|
Sealed
Roads
|
229,941,000
|
108,104,000
|
53%
|
Met
|
|
Unsealed
Roads
|
3,911,000
|
1,232,000
|
68%
|
Improving
|
|
Sealed
Roads Kerb and Gutter
|
23,973,000
|
6,661,000
|
72%
|
Improving
|
|
Footpath
|
$8,626,000
|
3,124,000
|
64%
|
Improving
|
|
Bridge
Construction
|
$23,909,000
|
$12,830,000
|
54%
|
Met
|
|
Traffic
Devices
|
$59,748,000
|
$19,624,000
|
67%
|
Improving
|
|
Roundabouts,
Islands and Speed Humps
|
$10,424,000
|
$2,147,000
|
79%
|
Improving
|
|
Car
Parks
|
$3,306,000
|
$594,000
|
82%
|
Improving
|
Asset
Sustainability Ratio
This
ratio is an approximation of the extent to which assets managed by a local
government are being replaced as these reach the end of their useful lives. It
is calculated by measuring capital expenditure on renewal or replacement of
assets, relative to depreciation expense. Expenditure on new or additional
assets is excluded.
Depreciation
expense represents an estimate of the extent to which the assets have been
consumed during that period. Measuring assets at fair value is critical to the
calculation of a valid depreciation expense value.

Purpose: This
ratio indicates whether a local government is replacing or renewing existing
non-financial assets at the same rate that its overall asset stock is wearing
out.
Standards: Standard
is met if the ratio can be measured and is 90% (or 0.90)
Standard is improving if this ratio is between 90% and 110%
(or 0.90 and 1.10).
Table 24 Asset Sustainability Ratio Figures
|
Asset
Financial Class
|
Annual
Planned Renewal Expenditure
|
Annual
Depreciation
|
Ratio
|
Standard
|
|
Sealed
Roads
|
$3,528,126
|
$3,396,000
|
104%
|
Improving
|
|
Unsealed
Roads
|
$320,243
|
$128,000
|
250%
|
Met
|
|
Footpaths
|
$158,647
|
$126,000
|
126%
|
Improving
|
|
Bridge
Construction
|
$442,407
|
$293,000
|
151%
|
Improving
|
While
the Asset Sustainability Ratio appears to indicate the Council are over
spending, the Asset Consumption Ratio shows that there has been little
spent on renewals in the past creating a backlog of poor condition assets
(Table 23). The following Asset Renewal Funding Ratio supports this
narrative, showing that the minimum financial demand requirements are not being
met moving forward.
Asset Sustainability and Renewal Ratios appear to be
improving as we have increased spending in order to make up the backlog of
previously underfunded assts.
Asset
Renewal Funding Ratio
This
ratio indicates whether the local government has the financial capacity to fund
asset renewal as required, and can continue to provide existing levels of
services in future, without additional operating income; or reductions in
operating expenses.
The
ratio is calculated from information included in the local government’s
Long Term Financial Plan and Asset Management Plan; not the Annual Financial
Report. For the ratio to be meaningful, a consistent discount rate should
generally be applied in Net Present Value (NPV) calculations

Purpose: This
ratio is a measure of the ability of a local government to fund its projected
asset renewal / replacements in the future.
Standards: Standard
is met if the ratio is between 75% and 95% (or 0.75 and 0.95).
Standard is improving if the ratio is between 95% and 105%
(or 0.95 and 1.05), and
the ASR falls within the range 90% to 110% and 50% to 75%.
Standard not met if <75%.
Table 25 Asset Renewal
Funding Ratio Figures
|
Asset
Financial Class
|
Planned
Renewal Expenditure
|
Required
(Unlimited) Renewal Expenditure
|
Ratio
|
Standard
|
|
Sealed
Roads
|
$35,281,256
|
$47,036,145
|
75%
|
Met
|
|
Unsealed
Roads
|
$3,202,431
|
$7,101,576
|
45%
|
Not
met
|
|
Footpath
and shared paths
|
$955,000
|
unknown
|
N/A
|
N/A
|
|
Kerb
and Gutter
|
$249,000
|
unknown
|
NA
|
N/A
|
|
Bridge
Construction
|
$4,424,074
|
$4,424,074
|
100%
|
Improving
|
Note: Footpaths and Kerb and Gutter have not been modelled and
thus the required Renewal has not been calculated.
Asset
Maintenance Ratio
Disclosure
of this Ration is reported in Council’s Annual Financial Statements as
part of Special Schedule 7 (SS7) – Condition of Infrastructure. The
Ratio disclosed here relates to the Council’s General Fund and this
covers the assets subject of this Asset Management Plan with the addition of
Buildings. This ratio measures the actual or estimated asset maintenance
expenditure against required asset maintenance. The benchmark for this
ratio is 1.00 i.e. maintenance expenditure equals required maintenance
expenditure. If maintenance expenditure is below required maintenance
expenditure, this indicates Council is not maintaining its assets as required.
To
calculate this Ratio, the following formula is used:

The
following graph identifies the outcome relevant for Council for the period
2016/2017 to 2025/2026:
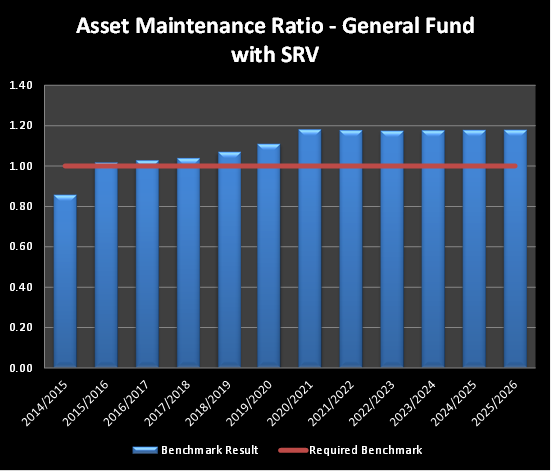
Figure 17 Asset
Maintenance Ratio General Fund SS7
Infrastructure
Backlog Ratio
Disclosure
of this Ratio is reported in Council’s Annual Financial Statements as
part of Special Schedule 7 (SS7) – Condition of Infrastructure. The
Ratio disclosed here relates to the Council’s General Fund and this
covers the assets subject of this Asset Management Plan with the addition of
Buildings. This ratio measures the estimated cost to bring assets back to a
satisfactory standard compared to the total written down value of infrastructure
assets. The benchmark for this ratio is to have a backlog on an annual
basis of 2.00% or less i.e. costs to being assets back to a satisfactory
standard is less then 2.00% of the total written down value of Infrastructure
Assets equals required maintenance expenditure. If the trend of this
ratio is above the 2.00% benchmark it demonstrates that Council is not
addressing its Infrastructure backlog. This is the case for Council.
To
calculate this Ratio, the following formula is used:

The
following graph identifies the outcome relevant for Council for the period
2016/2017 to 2025/2026:
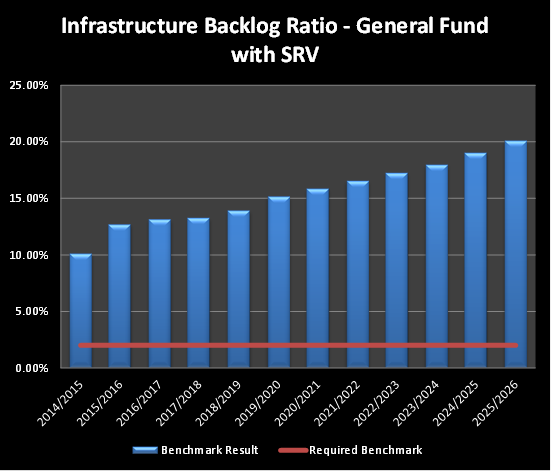
Figure 18 Infrastructure
Backlog Ratio General Fund SS7
13. Improvement
Plan
Improvement Actions
Table 26 Improvement
actions summary
|
ID
|
Task
|
Responsible
Department
|
Target
Date
|
Conceptual
Cost
|
|
1.
|
Obtain
Council approval of this Plan
|
Infrastructure
Services
|
Mar
2018
|
Internal
Resource
|
|
2.
|
Condition
Assessment – regularly review condition data and methodology
|
Infrastructure
Services
|
Ongoing
|
|
|
3.
|
Condition
Assessment – expand scope of condition assessment to include those
asset current un-assessed
|
Infrastructure
Services
|
Ongoing
|
Internal
Resource
|
|
4.
|
Condition
Assessment –develop condition assessment plan for kerbs, causeways,
traffic devices, roundabouts etc. and car parks
|
Infrastructure
Services
|
December
2019
|
Internal
Resource
|
|
5.
|
Maintenance
Plan – establish and document levels of service for maintenance
activities
|
Infrastructure
Services
|
June
2018
|
Internal
Resource
|
|
6.
|
Confirm
remaining life and useful life of assets
|
Infrastructure
Services
|
June
2018
|
Internal
Resource
|
|
7.
|
Update
and revise prediction modelling parameters and inputs when new condition
data/information is available
|
Infrastructure
Services
|
Ongoing
|
Internal
Resource
|
|
8.
|
Test
current levels of service to determine if they are achievable with current
budget allocation.
|
Infrastructure
Services
|
December
2018
|
Internal
Resource
|
|
9.
|
Formalise
asset disposal policy
|
Infrastructure
Services
|
June
2018
|
Internal
Resource
|
|
10.
|
Formalise
asset renewal policy
|
Infrastructure
Services
|
June
2018
|
Internal
Resource
|
|
11.
|
Formalise
asset new policy
|
Infrastructure
Services
|
June
2018
|
Internal
Resource
|
14. Glossary
|
Asset
condition assessment
|
The
process of continuous or periodic inspection, assessment, measurement and
interpretation of the resultant data to indicate the condition of a specific
asset so as to determine the need for some preventative or remedial action.
|
|
Asset
management
|
The
combination of management, financial, economic, engineering and other
practices applied to physical assets with the objective of providing the
required level of service in the most cost effective manner.
|
|
Assets
|
Future
economic benefits controlled by the entity as a result of past transactions
or other past events (AAS27.12).
Property,
plant and equipment including infrastructure and other assets (such as
furniture and fittings) with benefits expected to last more than 12 month.
|
|
Backlog
|
Estimated
cost to bring infrastructure, buildings and other structures and depreciable
land improvements to a satisfactory standard, measured at a particular point
in time
|
|
Capital
expenditure
|
Relatively
large (material) expenditure, which has benefits, expected to last for more
than 12 months. Capital expenditure includes renewal, expansion and upgrade.
Where capital projects involve a combination of renewal, expansion and/or
upgrade expenditures, the total project cost needs to be allocated
accordingly.
|
|
Capital
funding
|
Funding
to pay for capital expenditure.
|
|
Capital
new expenditure
|
Expenditure
which creates a new asset providing a new service to the community that did
not exist beforehand. As it increases service potential it may impact revenue
and will increase future operating and maintenance expenditure.
|
|
Capital
renewal expenditure
|
Expenditure
on an existing asset, which returns the service potential or the life of the
asset up to that which it had originally. It is periodically required
expenditure, relatively large (material) in value compared with the value of
the components or sub-components of the asset being renewed. As it reinstates
existing service potential, it has no impact on revenue, but may reduce
future operating and maintenance expenditure if completed at the optimum
time, e.g. resurfacing or resheeting a material part of a road network,
replacing a material section of a drainage network with pipes of the same
capacity, resurfacing an oval. Where capital projects involve a combination
of renewal, expansion and/or upgrade expenditures, the total project cost
needs to be allocated accordingly.
|
|
Capital
upgrade expenditure
|
Expenditure,
which enhances an existing asset to provide a higher level of service or
expenditure that will increase the life of the asset beyond that which it had
originally. Upgrade expenditure is discretional and often does not result in
additional revenue unless direct user charges apply. It will increase
operating and maintenance expenditure in the future because of the increase
in the Council’s asset base, e.g. widening the sealed area of an
existing road, replacing drainage pipes with pipes of a greater capacity,
enlarging a grandstand at a sporting facility. Where capital projects involve
a combination of renewal, expansion and/or upgrade expenditures, the total
project cost needs to be allocated accordingly.
|
|
Carrying
amount
|
The
amount at which an asset is recognised after deducting any accumulated
depreciation / amortisation and accumulated impairment losses thereon.
|
|
Component
|
An
individual part of an asset which contributes to the composition of the whole
and can be separated from or attached to an asset or a system.
|
|
Cost
of an asset
|
The
amount of cash or cash equivalents paid or the fair value of the
consideration given to acquire an asset at the time of its acquisition or
construction, plus any costs necessary to place the asset into service. This
includes one-off design and project management costs.
|
|
Current
replacement cost (CRC)
|
The cost
the entity would incur to acquire the asset on the reporting date. The cost is
measured by reference to the lowest cost at which the gross future economic
benefits could be obtained in the normal course of business or the minimum it
would cost, to replace the existing asset with a technologically modern
equivalent new asset (not a second hand one) with the same economic benefits
(gross service potential) allowing for any differences in the quantity and
quality of output and in operating costs.
|
|
Current
Replacement Cost “As New” (CRC)
|
The
current cost of replacing the original service potential of an existing
asset, with a similar modern equivalent asset, i.e. the total cost of
replacing an existing asset with an as NEW or similar asset expressed in
current dollar values.
|
|
Cyclic
Maintenance
|
Replacement
of higher value components/sub-components of assets that is undertaken on a
regular cycle including repainting, building roof replacement, cycle,
replacement of air conditioning equipment, etc. This work generally falls
below the capital/ maintenance threshold and needs to be identified in a
specific maintenance budget allocation.
|
|
Depreciable
amount
|
The cost
of an asset, or other amount substituted for its cost, less its residual
value (AASB 116.6)
|
|
Depreciated
replacement cost (DRC)
|
The
current replacement cost (CRC) of an asset less, where applicable,
accumulated depreciation calculated on the basis of such cost to reflect the
already consumed or expired future economic benefits of the asset
|
|
Depreciation
/ amortisation
|
The
systematic allocation of the depreciable amount (service potential) of an
asset over its useful life.
|
|
Economic
life
|
See
useful life definition.
|
|
Expenditure
|
The
spending of money on goods and services. Expenditure includes recurrent and
capital.
|
|
Fair
value
|
The
amount for which an asset could be exchanged, or a liability settled, between
knowledgeable, willing parties, in an arm’s length transaction.
|
|
Greenfield
asset values
|
Asset
(re)valuation values based on the cost to initially acquire the asset.
|
|
Heritage
asset
|
An asset
with historic, artistic, scientific, technological, geographical or
environmental qualities that is held and maintained principally for its
contribution to knowledge and culture and this purpose is central to the
objectives of the entity holding it.
|
|
Impairment
Loss
|
The
amount by which the carrying amount of an asset exceeds its recoverable
amount.
|
|
Infrastructure
assets
|
Physical
assets of the entity or of another entity that contribute to meeting the
public's need for access to major economic and social facilities and
services, e.g. roads, drainage, footpaths and Shared Paths. These are
typically large, interconnected networks or portfolios of composite assets.
The components of these assets may be separately maintained, renewed or
replaced individually so that the required level and standard of service from
the network of assets is continuously sustained. Generally the components and
hence the assets have long lives. They are fixed in place and are often have
no market value.
|
|
Level
of service
|
The defined
service quality for a particular service against which service performance
may be measured. Service levels usually relate to quality, quantity,
reliability, responsiveness, environmental, acceptability and cost).
|
|
Life
Cycle Cost
|
The life
cycle cost (LCC) is average cost to provide the service over the longest
asset life cycle. It comprises annual maintenance and asset consumption
expense, represented by depreciation expense. The Life Cycle Cost does not
indicate the funds required to provide the service in a particular year.
|
|
Life
Cycle Expenditure
|
The Life
Cycle Expenditure (LCE) is the actual or planned annual maintenance and
capital renewal expenditure incurred in providing the service in a particular
year. Life Cycle Expenditure may be compared to Life Cycle Expenditure to
give an initial indicator of life cycle sustainability.
|
|
Maintenance
and renewal gap
|
Difference
between estimated budgets and projected expenditures for maintenance and
renewal of assets, totalled over a defined time (e.g. 5, 10 and 15 years).
|
|
Maintenance
and renewal sustainability index
|
Ratio of
estimated budget to projected expenditure for maintenance and renewal of
assets over a defined time (e.g. 5, 10 and 15 years).
|
|
Maintenance
expenditure
|
Recurrent
expenditure, which is periodically or regularly required as part of the
anticipated schedule of works required to ensure that the asset achieves its
useful life and provides the required level of service. It is expenditure,
which was anticipated in determining the asset’s useful life.
|
|
Materiality
|
An item
is material is its omission or misstatement could influence the economic
decisions of users taken on the basis of the financial report. Materiality
depends on the size and nature of the omission or misstatement judged in the surrounding
circumstances.
|
|
Modern
equivalent asset.
|
A
structure similar to an existing structure and having the equivalent
productive capacity, which could be built using modern materials, techniques
and design. Replacement cost is the basis used to estimate the cost of
constructing a modern equivalent asset.
|
|
Non-revenue
generating investments
|
Investments
for the provision of goods and services to sustain or improve services to the
community that are not expected to generate any savings or revenue to the Council,
e.g. parks and playgrounds, footpaths, roads and bridges, libraries, etc.
|
|
Operating
expenditure
|
Recurrent
expenditure, which is continuously required excluding maintenance and
depreciation, e.g. power, fuel, staff, plant equipment, on-costs and overheads.
|
|
Planned
Maintenance
|
Repair
work that is identified and managed through a maintenance management system
(MMS). MMS activities include inspection, assessing the condition against
failure/breakdown criteria/experience, prioritising scheduling, actioning the
work and reporting what was done to develop a maintenance history and improve
maintenance and service delivery performance.
|
|
Rate
of annual asset consumption
|
A
measure of average annual consumption of assets (AAAC) expressed as a
percentage of the depreciable amount (AAAC/DA). Depreciation may be used for
AAAC.
|
|
Rate
of annual asset renewal
|
A
measure of the rate at which assets are being renewed per annum expressed as
a percentage of depreciable amount (capital renewal expenditure/DA).
|
|
Rate
of annual asset upgrade
|
A
measure of the rate at which assets are being upgraded and expanded per annum
expressed as a percentage of depreciable amount (capital upgrade/expansion
expenditure/DA).
|
|
Reactive
maintenance
|
Unplanned
repair work that carried out in response to service requests and
management/supervisory directions.
|
|
Recoverable
amount
|
The
higher of an asset's fair value, less costs to sell and its value in use.
|
|
Recurrent
expenditure
|
Relatively
small (immaterial) expenditure or that which has benefits expected to last
less than 12 months. Recurrent expenditure includes operating and maintenance
expenditure.
|
|
Recurrent
funding
|
Funding
to pay for recurrent expenditure.
|
|
Rehabilitation
|
See
capital renewal expenditure definition above.
|
|
Remaining
life
|
The time
remaining until an asset ceases to provide the required service level or
economic usefulness. Age plus remaining life is economic life.
|
|
Renewal
|
See
capital renewal expenditure definition above.
|
|
Residual
value
|
The net
amount which an entity expects to obtain for an asset at the end of its
useful life after deducting the expected costs of disposal.
|
|
Risk
management
|
The
application of a formal process to the range of possible values relating to
key factors associated with a risk in order to determine the resultant ranges
of outcomes and their probability of occurrence.
|
|
Section
or segment
|
A
self-contained part or piece of an infrastructure asset.
|
|
Service
potential
|
The
capacity to provide goods and services in accordance with the entity's objectives,
whether those objectives are the generation of net cash inflows or the
provision of goods and services of a particular volume and quantity to the
beneficiaries thereof.
|
|
Service
potential remaining
|
A
measure of the remaining life of assets expressed as a percentage of economic
life. It is also a measure of the percentage of the asset’s potential
to provide services that are still available for use in providing services
(DRC/DA).
|
|
Strategic
Management Plan
|
Documents
Council objectives for a specified period (3-5 years), the principle
activities to achieve the objectives, the means by which that will be carried
out, estimated income and expenditure, measures to assess performance and how
rating policy relates to the Council’s objectives and activities.
|
|
Sub-component
|
Smaller
individual parts that make up a component part.
|
|
Useful
life
|
Either:
(a) the period over which an asset is expected to be available for use by an
entity, or
(b) the number of production or similar units expected to be obtained from
the asset by the entity.
It is
estimated or expected time between placing the asset into service and
removing it from service, or the estimated period of time over which the
future economic benefits embodied in a depreciable asset, are expected to be
consumed by the Council. It is the same as the economic life.
|
15. APPENDIX
A Special Schedule 7 – Report on Infrastructure Assets as at 30 June 2017
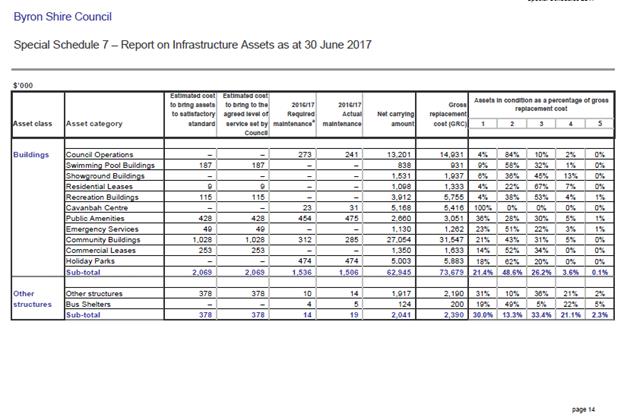
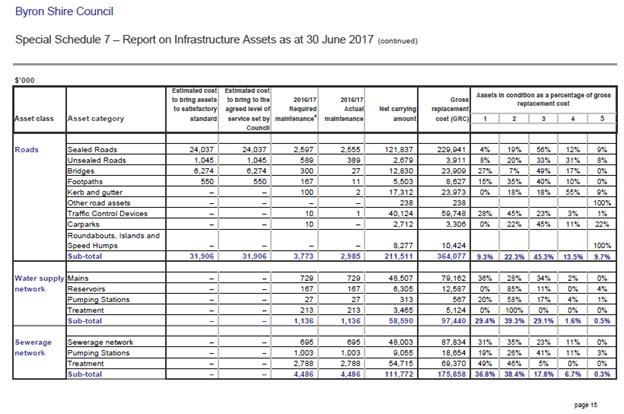
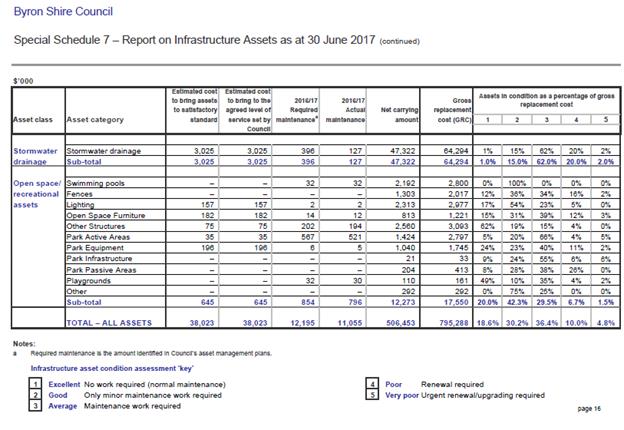
16.
APPENDIX B Visual Summary
17.
References
Australian Standards AS1428.1 2009, Design for
access and mobility Part 1: General requirements for access - New building
work. (2009).
Australian Standards AS1428.2 1992, Design for
access and mobility Part 2: Enhanced and additional requirements - Buildings
and facilities. (1992).
Austroads (2011). Guide to
Pavement Technology Part 5: Pavement Evaluation and Treatment Design (AGPT
05-11), (Austroads, Sydney)
Byron Shire Council. (2008). Byron Shire
Bike Strategy and Action Plan. Mullumbimby: Byron Shire Council.
Byron Shire Council. (2012). Byron Shire
Developer Contribution Plan 2012. Mullumbimby: Byron Shire Council.
Byron Shire Council. (2016). Long Term
Financial Plan 2016-2026. Mullumbimby: Byron Shire Council.
Byron Shire Council. (2016). Strategic Asset
Management Plan. Mullumbimby: Byron Shire Council.
Byron Shire Council. (2017). Draft
Infrastructure Services Risk Management Procedures. Mullumbimby: Byron
Shire Council.
Byron Shire Council. (2017). Workforce Plan
2017-2021. Mullumbimby: Byron Shire Council.
Byron Shire Council. (n.d.). Asset
Assessment Manual Condition, Functionality and Capacity. Mullumbimby: Byron
Shire Council.
Micromex Research. (2016). Byron Shire
Council Asset Management Survey. Mullumbimby: Byron Shire Council.
PublicWorksTraining.com. (2017, August 29). Roadway
Asset Management for Counties, Cities, Towns and Villages. Retrieved from
PublicWorksTraining.com:
https://www.publicworkstraining.com/tam-bundle?lightbox=dataItem-ipqvpzk5
Short, B. (2016). Level of Service - Sealed
Road Network #I2016/108. Mullumbimby: Byron Shire Council.
SPOT Satellite Personal Tracker. (2017,
September 19). SPOT. Retrieved from SPOT: https://www.findmespot.com/en/
Staff Reports - Infrastructure Services 4.2
Report No. 4.2 Byron
Bay (Browning St) to Suffolk Park (Clifford St) Cycleway Investigation
Directorate: Infrastructure
Services
Report
Author: Daniel
Strzina, Project Engineer
File No: I2018/347
Theme: Community Infrastructure
Local Roads and Drainage
Summary:
The purpose of this report is to provide to TIAC the final
report on the findings of investigation works by Council’s consultant,
PSA Consulting, in relation to resolution 17-403 (Broken Head Road Cycleway -
Browning Street to Clifford Street). This report also outlines potential
internal and external funding sources for the recommended cycleway.
|
RECOMMENDATION:
That the
Committee recommend to Council:
That
Council:
1. Endorse
the Byron Bay (Browning St) to Suffolk Park (Clifford St) Cycleway
Investigation Report and Preferred Option Concept Design completed by PSA
Consulting (Attachments 1-8).
2. Consider
during the 2018/19 budget process allocation of funding to support application
for the 2018/19 round of Active Transport and Stronger Communities Fund
grants for works in 2019/20.
3. Place
the Byron Bay (Browning St) to Suffolk Park (Clifford St) Cycleway
Investigation Report and Preferred Option Concept Design (Attachments 1-8) on
public exhibition, including the staged implementation and proposed 2018/19
funding, comprised of Council funds and grant funds.
|
Attachments:
1 24.2017.86.1
0734_PSA_BSC_Byron Bay to Suffolk Park Cycleway Investigation_FINAL 180302 V1 -
Report, E2018/17376 , page 82⇩ 
2 24.2017.86.1
0734_PSA_BSC_Byron Bay to Suffolk Park Cycleway Investigation_FINAL 180302 V1 -
Appendix 1, E2018/17378 , page 125⇩
3 24.2017.86.1
0734_PSA_BSC_Byron Bay to Suffolk Park Cycleway Investigation_FINAL 180302 V1 -
Appendix 2, E2018/17379 , page 126⇩
4 24.2017.86.1
0734_PSA_BSC_Byron Bay to Suffolk Park Cycleway Investigation_FINAL 180302 V1 -
Appendix 3, E2018/17380 , page 127⇩
5 24.2017.86.1
0734_PSA_BSC_Byron Bay to Suffolk Park Cycleway Investigation_FINAL 180302 V1 -
Appendix 4, E2018/17381 , page 128⇩
6 24.2017.86.1
0734_PSA_BSC_Byron Bay to Suffolk Park Cycleway Investigation_FINAL 180302 V1 -
Appendix 5, E2018/17382 , page 129⇩ 
7 24.2017.86.1
0734_PSA_BSC_Byron Bay to Suffolk Park Cycleway Investigation_FINAL 180302 V1 -
Appendix 6, E2018/17383 , page 132⇩
8 24.2017.86.1
0734_PSA_BSC_Byron Bay to Suffolk Park Cycleway Investigation_FINAL 180302 V1 -
Appendix 7, E2018/17384 , page 155⇩
Background
Council at its meeting on 25 May 2017 considered NOM 9.2 -
Byron Bay Cycleway Design and Implementation and resolved as follows:
Res 17-201
1. Contract
the services of a cycleway expert in order to review the current design for on
road cycleways along Bangalow road, from Clifford Street, Suffolk Park to
Browning Street, Byron Bay; with a recommendation on the best and most cost
effective option to come from the consideration of, but not limited to, a
continuous single, on road cycleway on both sides of the road, a continuous
dual lane on the Eastern side of the road or a continuous dual lane on the
Western side of the road.
2. Provide
costing and identify a funding source for this work and for its construction.
3. That
a report on points 1 and 2 be provided to the Transport and Infrastructure
Advisory Committee prior to being reported to Council for adoption at the 3
August 2017 Ordinary Meeting.
4. That
Council allocate the proposal in the Capital Works program
for 2017/18 for the Broken Head
Road – Off Road Shared path with a budget of
$292,600 to an On Road cycleway along Bangalow Street, Byron Bay to Suffolk
Park.
Council at its meeting on 21 September 2017 considered the
recommendations from the TIAC meeting on 17 August 2017 and resolved as
follows:
Res 17-403
1. That
Council:
a) note
the report on the Broken Head Road Cycleway – Browning Street to Clifford
Street;
b) allocate
the carried over 2016/17 budget for Broken Head Road Shared Cycleway to procure
a report from a suitably qualified person to:
i) preview
existing shared path and cycleways on Broken Head Road and Bangalow Road,
between Clifford Street and Browning Street, Byron Bay;
ii) preview
existing infrastructure against current standards and advise where upgrades may
be required as part of the project;
iii) provide
options including indicative costings which meet the Roads and Maritime
Services (RMS) warrants and would likely receive RMS approval for filling the
missing links along the shared path between Clifford Street and Browning
Street, Byron Bay;
iv) identify
which sections may be eligible for grant funding under the RMS Active Transport
Grants Program; and
v) undertake
critical analysis for any proposed works including swept path analysis and
considerations for emergency services
2. That the Consultants report be
reported to an Extraordinary Meeting of the Transport and Infrastructure
Advisory Committee.
PSA Consulting was chosen as the favoured respondent to a
Vendorpanel RFQ and engaged on 15 September 2017 to undertake an investigation
and report on findings and recommendations in a presentation to an extraordinary
meeting of the TIAC on 02 November 2017.
Council at its meeting on 23 November 2017 considered
the recommendations from the TIAC extraordinary meeting on 02 November 2017 and
resolved as follows:
Res 17-581
That Council adopt the following Committee
Recommendation(s):
Committee Recommendation 4.1.1
1. That
the Committee:
a) thanks
PSA Consulting for the presentation on the draft Byron Bay (Browning St) to
Suffolk Park (Clifford St) Cycleway Investigation Report.
b) receive
further details and information regarding possible cost of infrastructure
relocation and parking implication within the Northern Section.
c) meets
for on-site inspection of Northern Section and considers issues arising on
extraordinary meeting.
2. That Council consider an active
transport wayfinding strategy for the Shire with the particular attention to
signage.
TIAC at its extraordinary meeting on 6
December 2017 undertook a site walkover of the Northern Section with PSA Consulting
and agreed that upon further investigation, that the most suitable option for
the Northern Section was one that incorporated unidirectional on-road cycle
lanes on either side of the road, requiring removal of parking from the western
side of the road and realignment of the road centerline. PSA Consulting
then produced a Preferred Option Concept Design for the entire corridor and
presented this to an extraordinary meeting of TIAC on 13 February 2018 for
final feedback, conclusion of the investigation and finalisation of the report.
TIAC at its extraordinary
meeting on 13 February 2018 was presented an updated version of the Preferred
Option Concept Design by PSA Consulting and made the following recommendations
that will be considered by Council at its meeting on 22 March 2018:
Committee Recommendation
1. That
the Committee review the details within Byron Bay (Browning St) to Suffolk Park
(Clifford St) Cycleway Investigation presentation (Attachment 1; E2018/9404) by
PSA Consulting and provide final feedback to the consultant at the meeting to
assist report finalisation.
2. That
the draft final preferred concept design drawings (Attachments 2-5: E2018/9393,
E2018/9399, E2018/9400, E2018/9402) and draft final report be finalised by PSA
Consulting for reporting to the 15 March 2018 ordinary TIAC meeting, with the
intention of further recommending to Council to adopt the recommendations
within the final report and place the final report and proposed concept design
drawings on public exhibition.
3. That
funding report will be brought to 15 March 2018 meeting outlining internal and
external grants funding sources for the cycleway.
Report
PSA Consulting have concluded the Byron Bay (Browning St) to
Suffolk Park (Clifford St) Cycleway Investigation and produced a report that documents
the study and details recommendations based on their findings and feedback from
previous extraordinary TIAC meetings.
The recommendations include an updated version of the
Preferred Option Concept Design; a system of cycleways, both on-road and shared
path, that effectively complete the missing links in cycling infrastructure
along Bangalow Rd and Broken Head Rd between Clifford St, Suffolk Park and
Browning St, Byron Bay.
The Preferred Option Concept Design was developed by PSA
Consulting in conjunction with TIAC over a five (5) month period, starting
initially with four (4) options proposed by the consultant and finishing with a
preferred option that was deemed by all parties to best meet the option
assessment criteria, which were:
· Access & connectivity:
This criterion considers the ease of access to/from the proposed corridor
and the level of connectivity to population areas, attractors and the
surrounding path network
· Safety: This
criterion considers user safety in accessing and using the proposed corridor.
This could include the number and type of road crossings required, the type of
intersection crossings, the quality and type of infrastructure proposed and Crime
Prevention Through Environmental Design (CPTED) concerns (lighting, passive
surveillance, etc.)
· Infrastructure
impacts: This criterion considers the impact on existing and required
infrastructure. This could include parking removal, impact on known services
(power poles, etc.), road work requirements (alignment, widening, etc.), signs
and lines
· Environmental
impacts: This criterion considers the impact on the existing environment.
This could include the need for tree removal, water runoff/drainage, coastal
impacts and environmental impacts during construction
· Alignment with
user profiles: This criterion considers how well the option aligns with the
needs of the identified key user groups (i.e. school students, families,
recreational users, tourists)
· Funding
application potential: This criterion considers how well the option aligns
with the Walking and Cycling Program and, therefore, how likely the project would
be to receive State funding
· Value: This
criterion considers how effectively the above criteria are met with respect to
high-level cost estimates for each option.
The final Preferred Option Concept Design is detailed in
drawings that present the proposed system of cycleways and associated changes
to existing infrastructure that would be required to implement the design,
including modification of existing infrastructure and construction of new
assets.
Implementation, staging and potential funding sources for
the proposed design are included within the recommendations in the report, and
have been discussed in previous meetings of TIAC.
Staging
The recommended staging is based upon delivering
connectivity by prioritising the sections of roadway with the lowest level of
service in terms of cycling infrastructure, so as to fill in the most critical
missing links in the cycleway first.
|
Stage
|
Description
|
Cost Estimate
|
|
Stage 1
|
The Byron at Byron resort to Beech Drive (north)
|
$0.20M - $0.25M
|
|
Stage 2
|
Beech Drive (north) to Beech Drive (south)
|
$0.24M - $0.32M
|
|
Stage 3
|
Browning Street to the existing pedestrian crossing near
St Finbarr’s Catholic Primary School
|
$1.00M - $1.20M
|
|
Stage 4
|
Existing pedestrian crossing near St Finbarr’s
Catholic Primary School to The Byron at Byron resort
|
$0.40M - $0.50M
|
|
Stage 5
|
Beech Drive (south) to Clifford Street
|
$0.06M - $0.08M
|
Stages 1 and 2 are seen as the highest priority as there is
currently no amenity for cycling along this section of Broken Head Rd.
Funding
A recommendation from the extraordinary TIAC meeting on the
13 February 2018 TIAC was that a funding report be brought to 15 March 2018
meeting outlining internal and external grants funding sources for the
cycleway.
Available funding for this project is approximately $150,000
in Section 94 funds, collected for and currently allocated to the section of
roadway from The Byron at Byron Resort to Beech Drive (south). A 2017/18 NSW
RMS Active Transport Grant has been applied for that, if awarded, would
supplement the currently available Section 94 funds to a total of
$292,625. These funds could be used to undertake Stage 1 (and possibly
Stage 5) or Stage 2.
All other recommended works are unfunded at this point in
time and would need to be considered by Council in the 2018/19 budget process. Allocation
of any further Section 94 funds to this project would require amendment of the
Section 94 plan.
Additional funding opportunities arise latter this year from
the 2018/19 round of grants, however an application will not be possible without
Council allocating its matching share of funds in the 2018/2019 budget.
2018/19 NSW RMS Active Transport Grant
RMS will open this scheme mid-year to fund projects in the
2019-20 financial year. This fund requires 1:1 funding contribution.
Relevant stages of the Broken Head Road Cycleway can be used
as the basis of the funding application to RMS.
NSW, Regional Growth Fund, Stronger Country Communities
Fund Round 2
This fund delivers crucial local infrastructure to improve
the quality of life of people living in regional NSW. Funding is provided to
local projects such as parks, community halls, playgrounds and amenity blocks.
This year there is a focus on sporting infrastructure and general community
amenity projects and they have changed the scope of eligible projects to
include street beautification and 'place making' activities. Council can
request up to $500K in funds, and does not need to match this amount, but a
high allocation (1:1 preferable) will strengthen the application.
The Stronger Country Communities Fund application is the
subject of Ordinary Council Report for 22 March meeting.
Financial Implications
Financial implications are dependent on further reporting to
Council and adoption of recommendations. There are no negative financial
implications associated with this report.
Statutory and Policy Compliance Implications
There are no negative statutory and policy compliance
implications associated with this report.
Staff Reports - Infrastructure Services 4.2 - Attachment 1
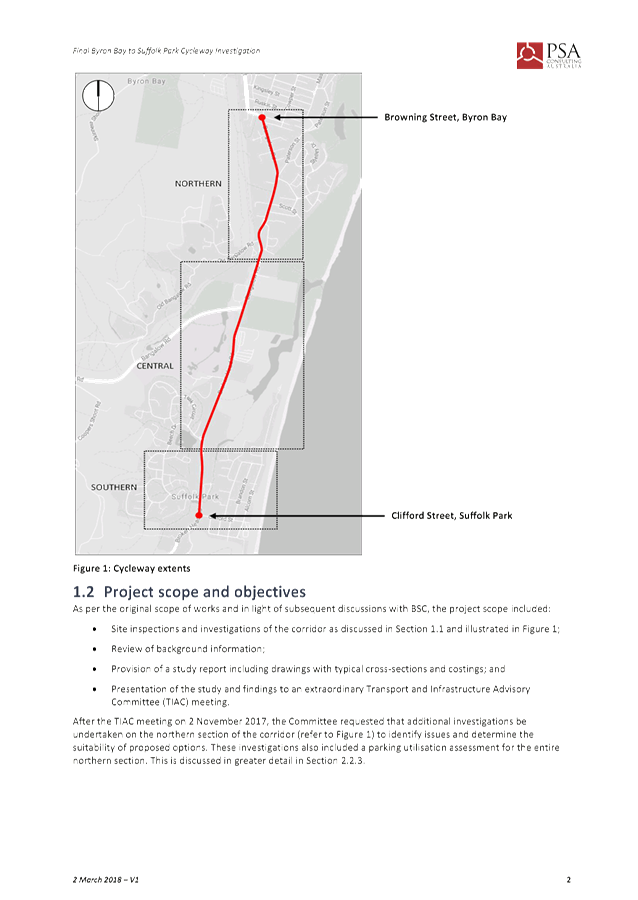
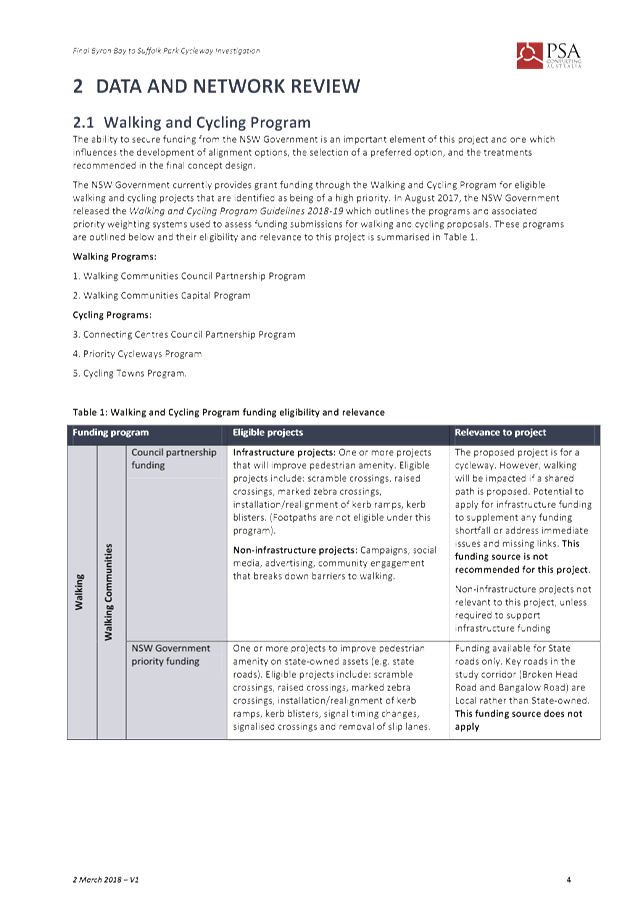
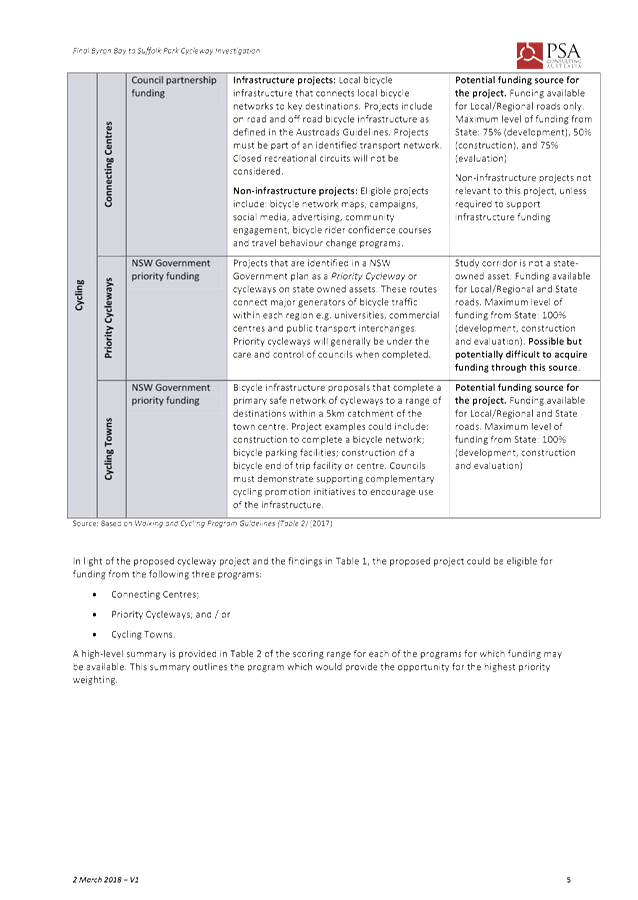
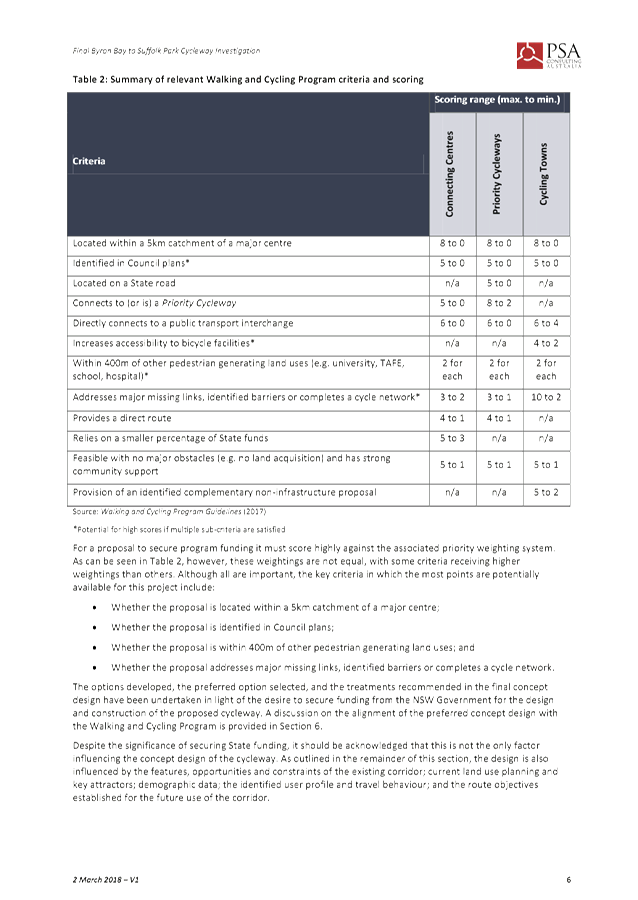
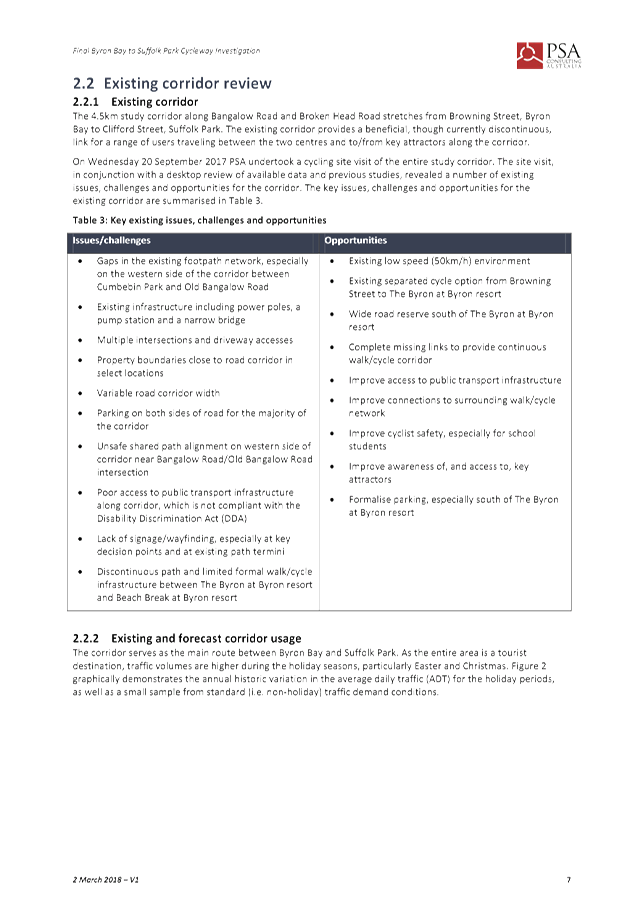
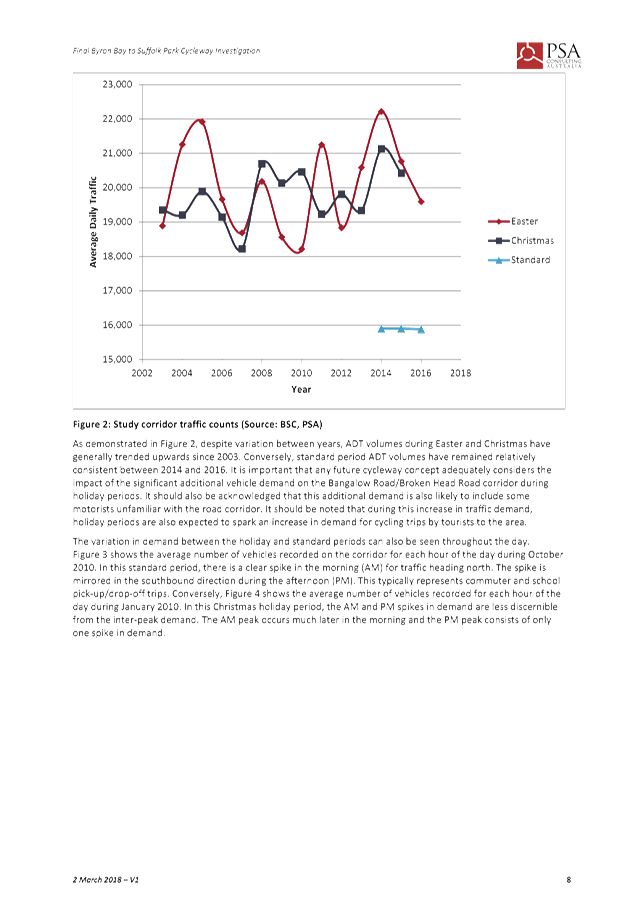
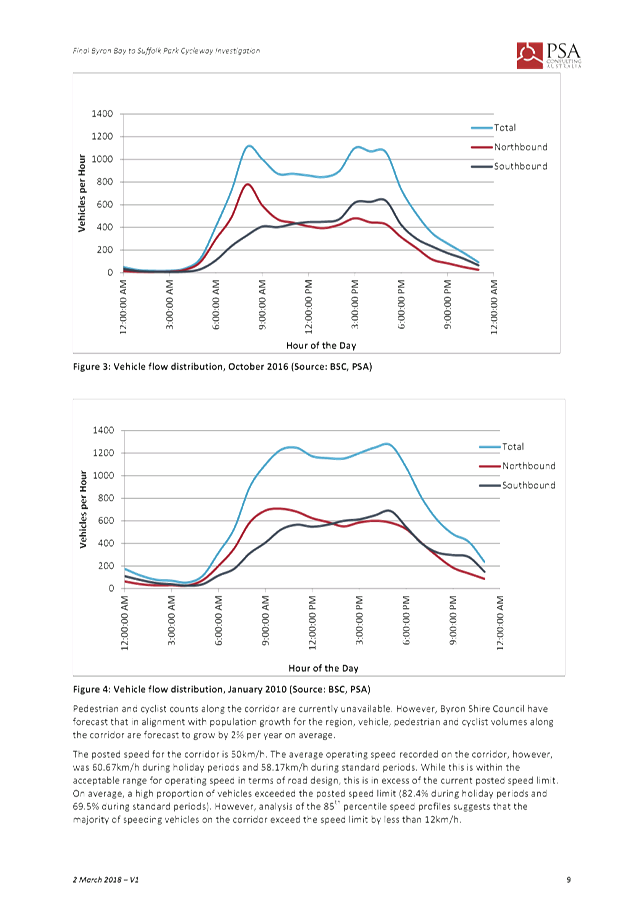
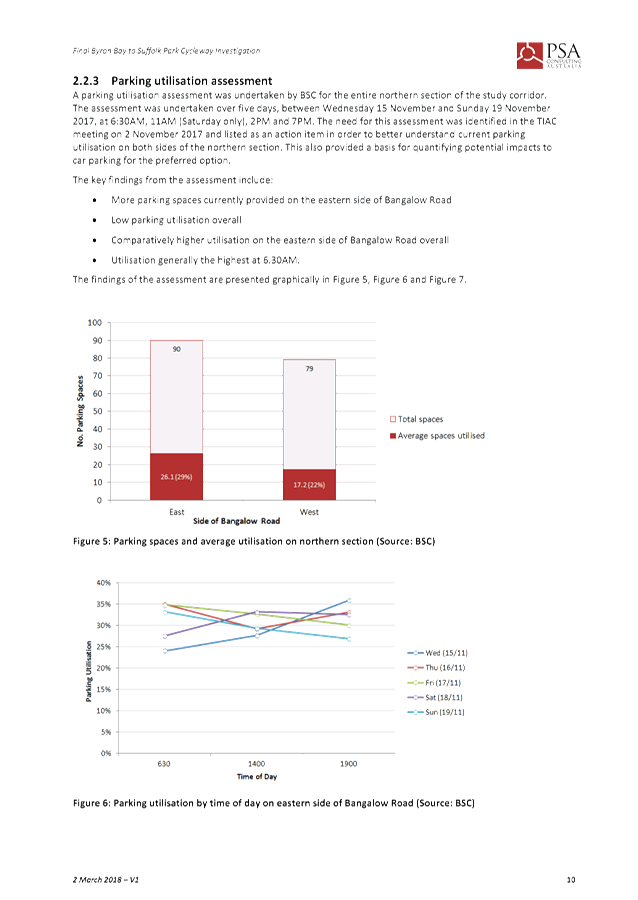
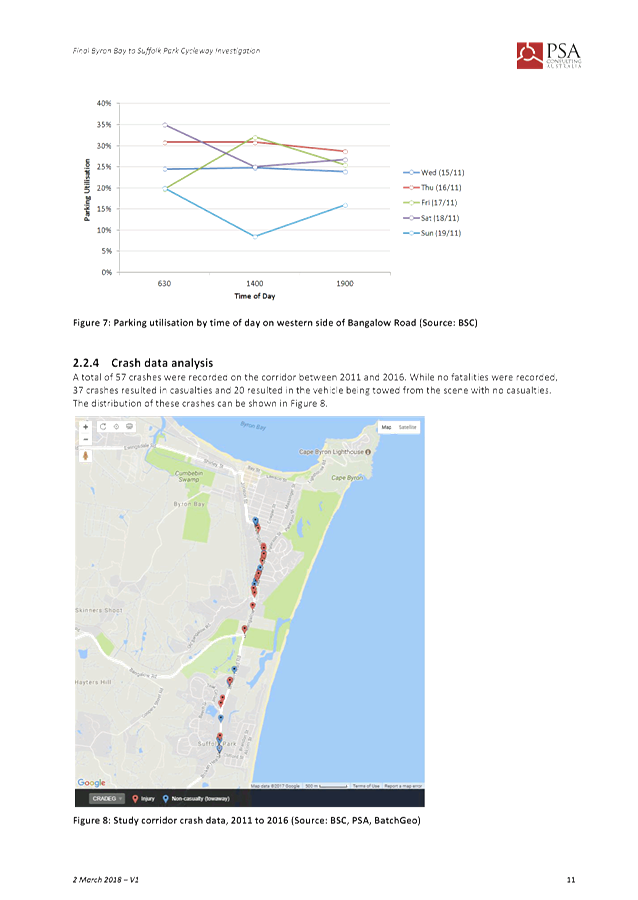
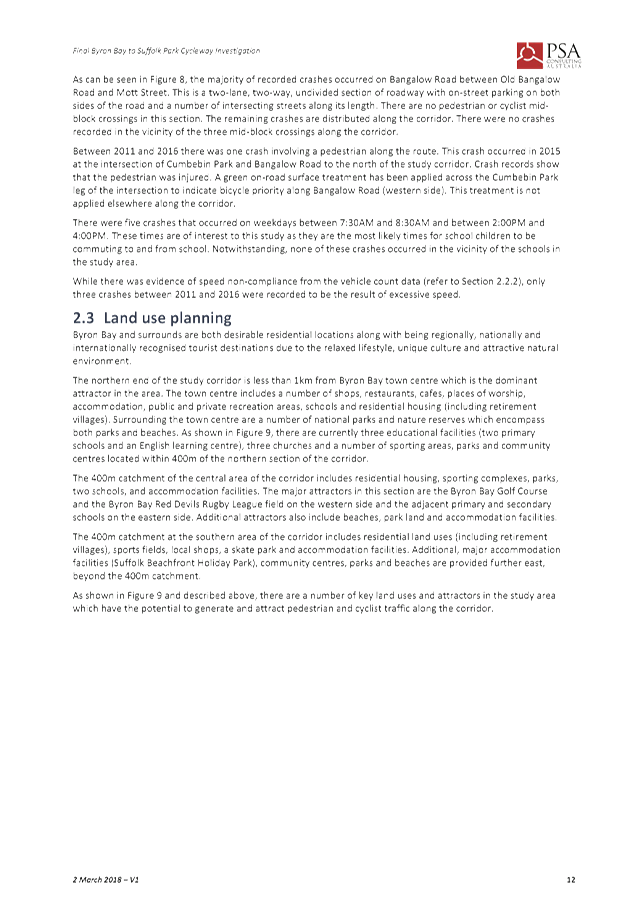
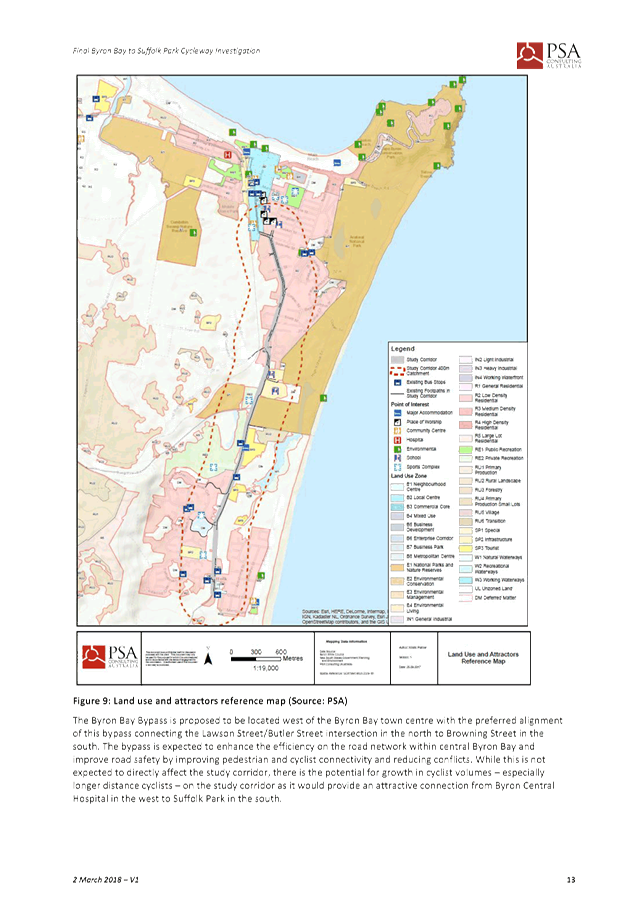
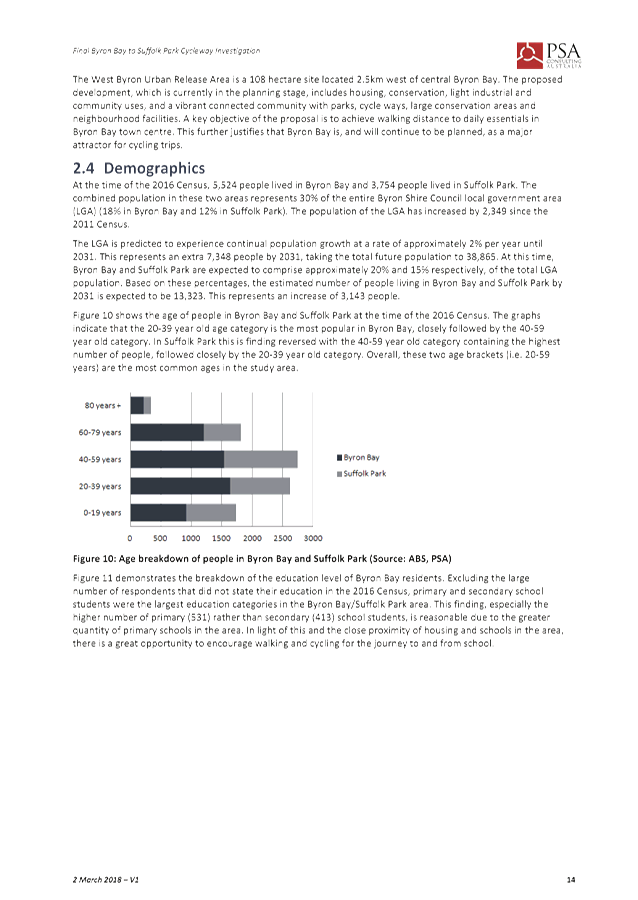
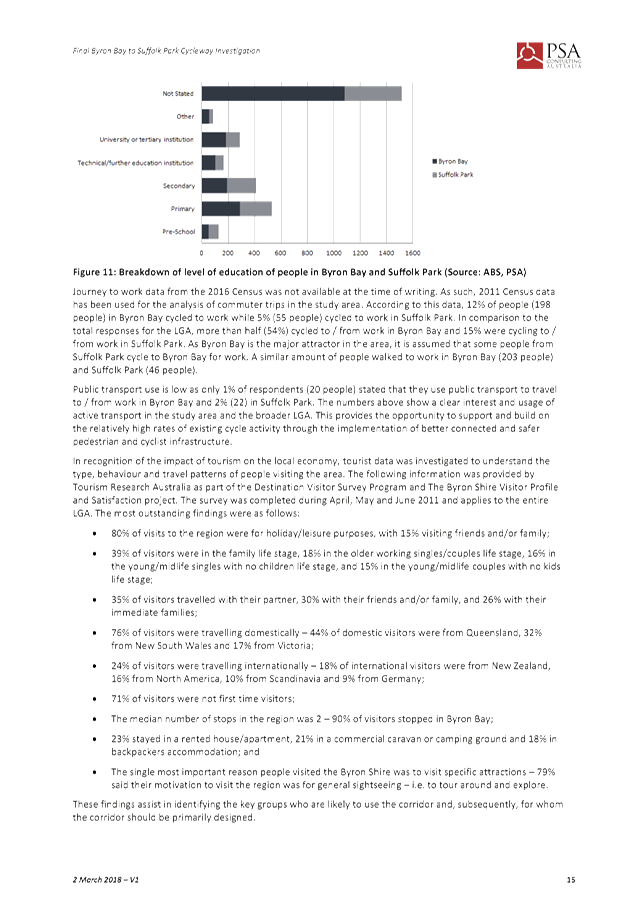
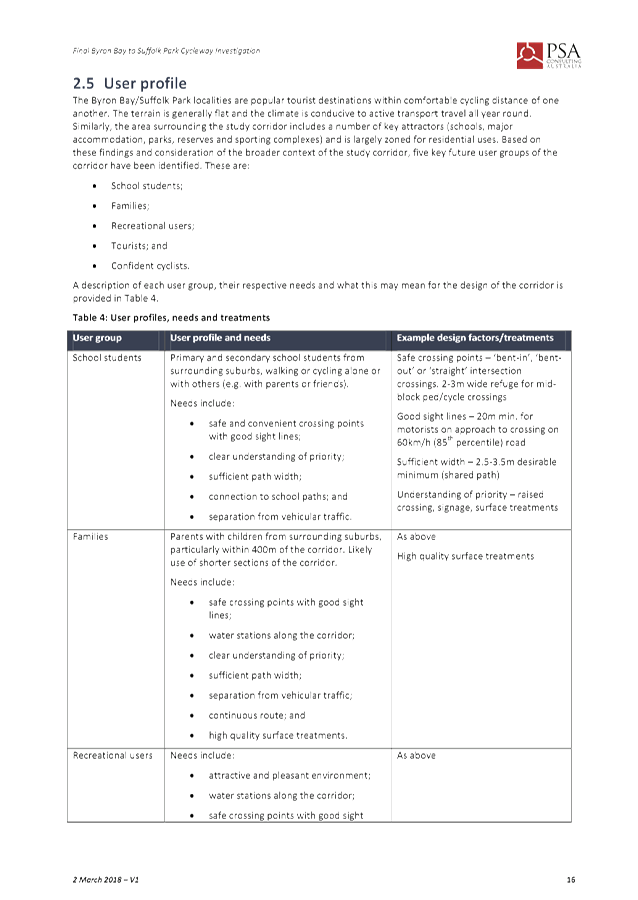
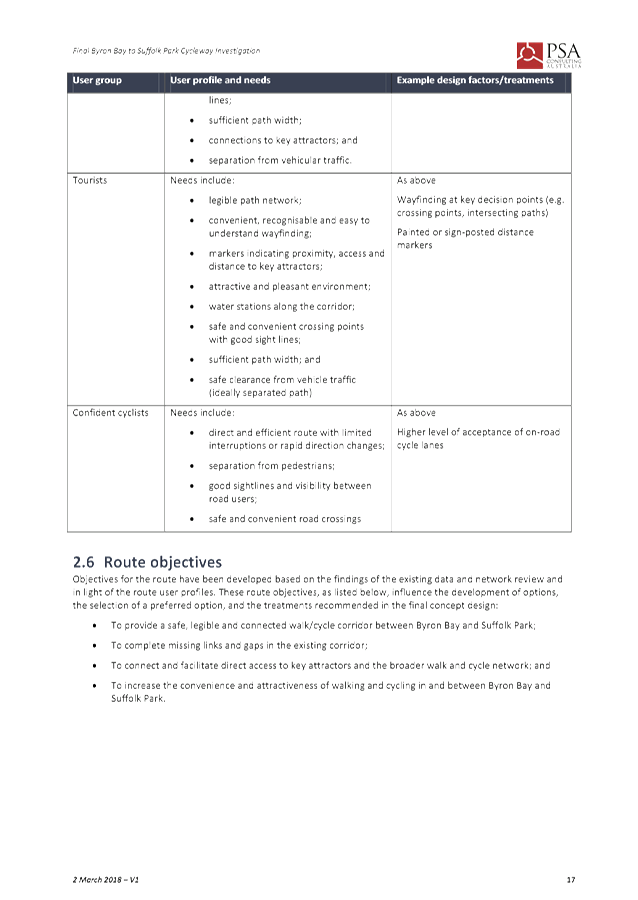
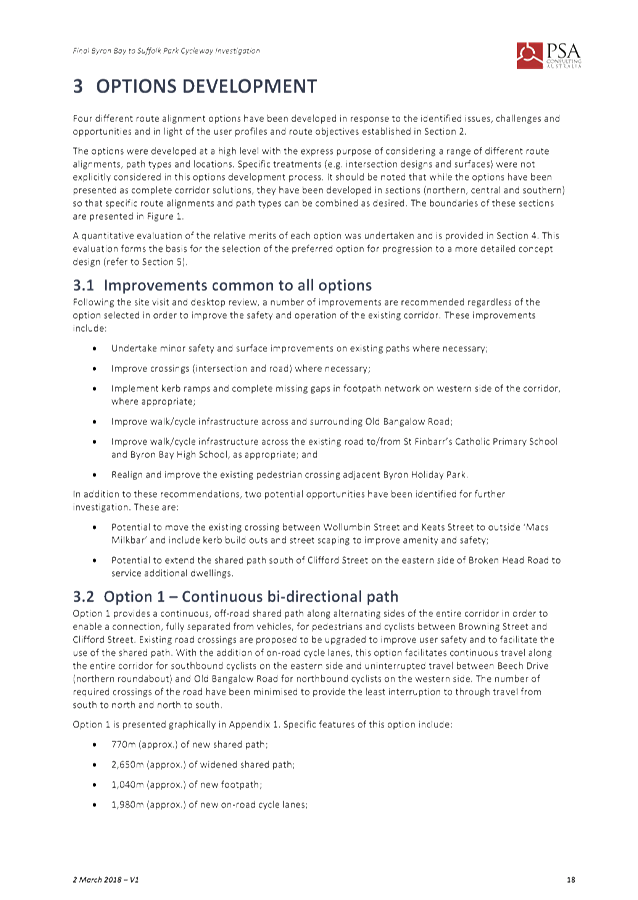
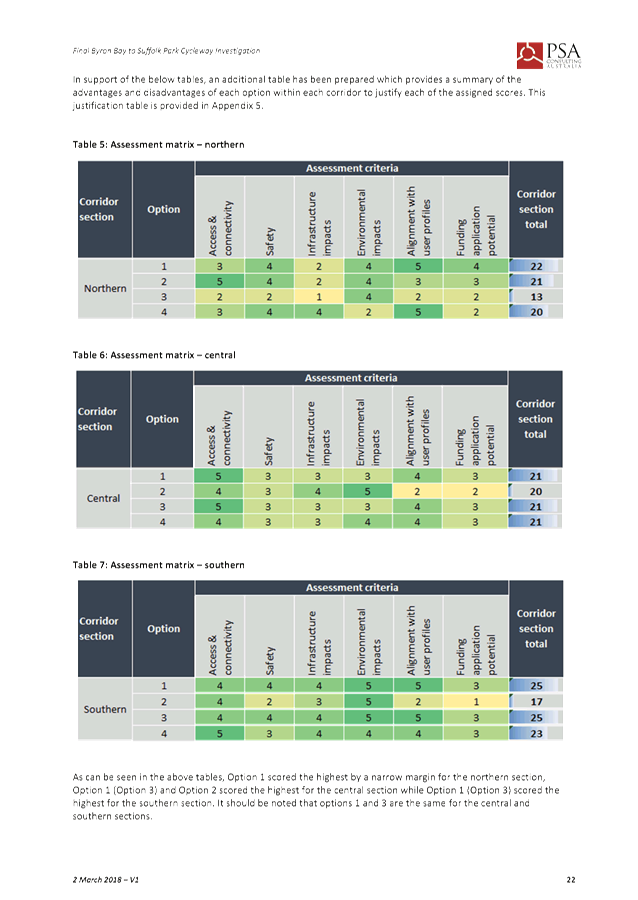
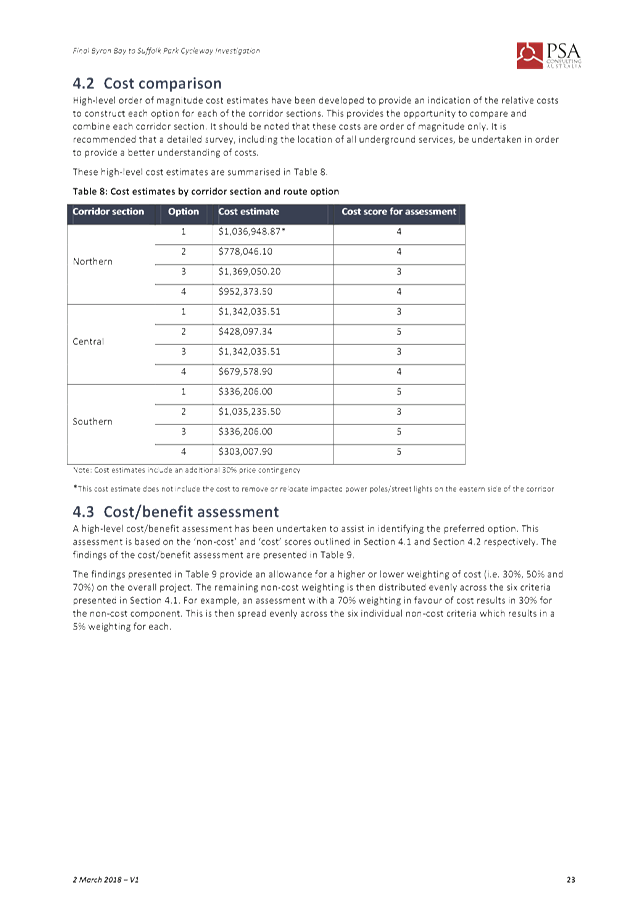
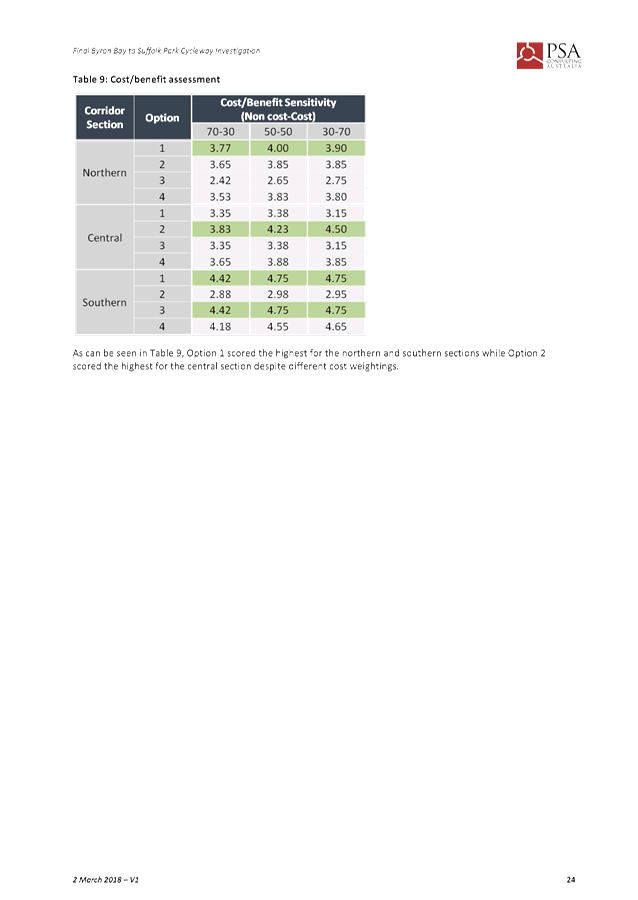
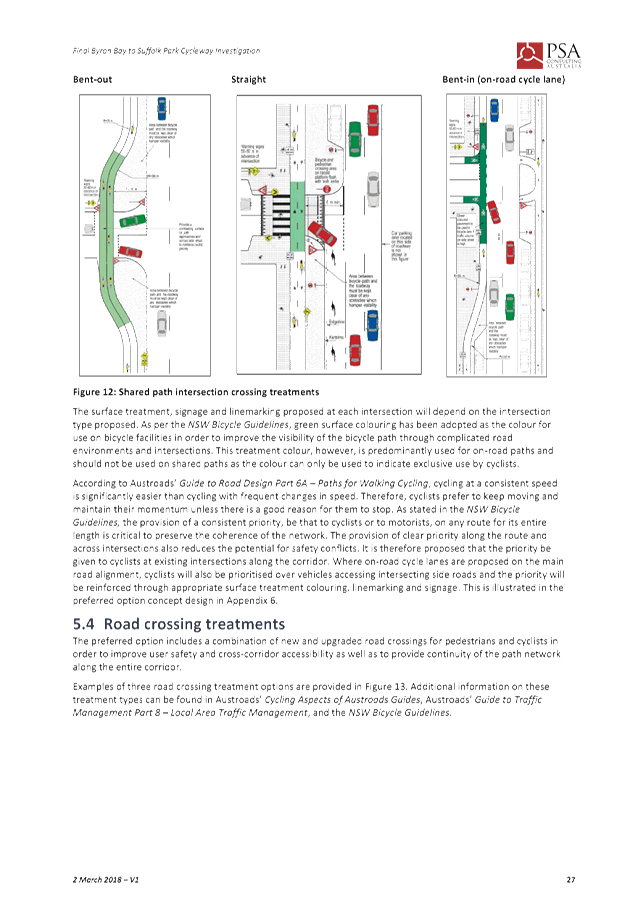
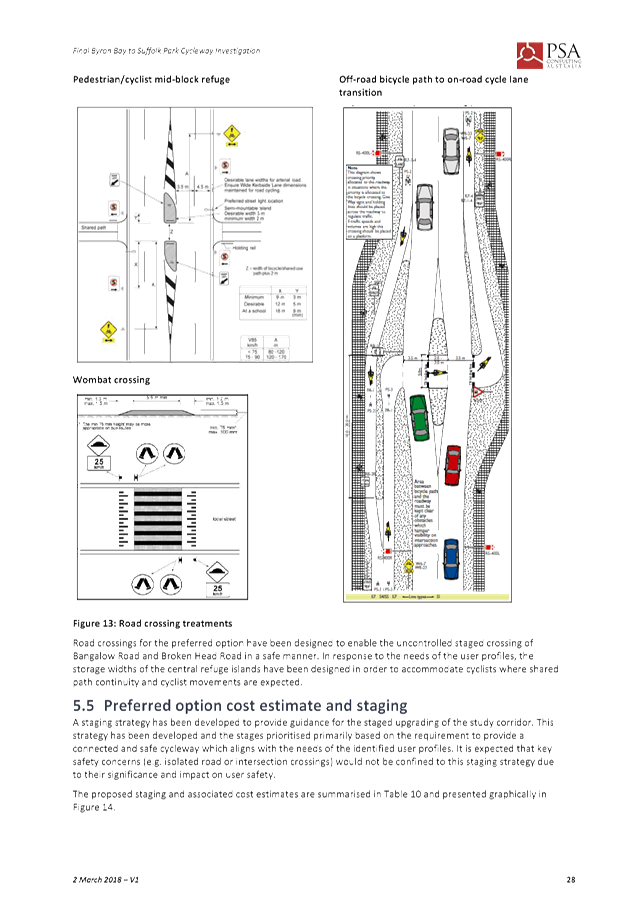
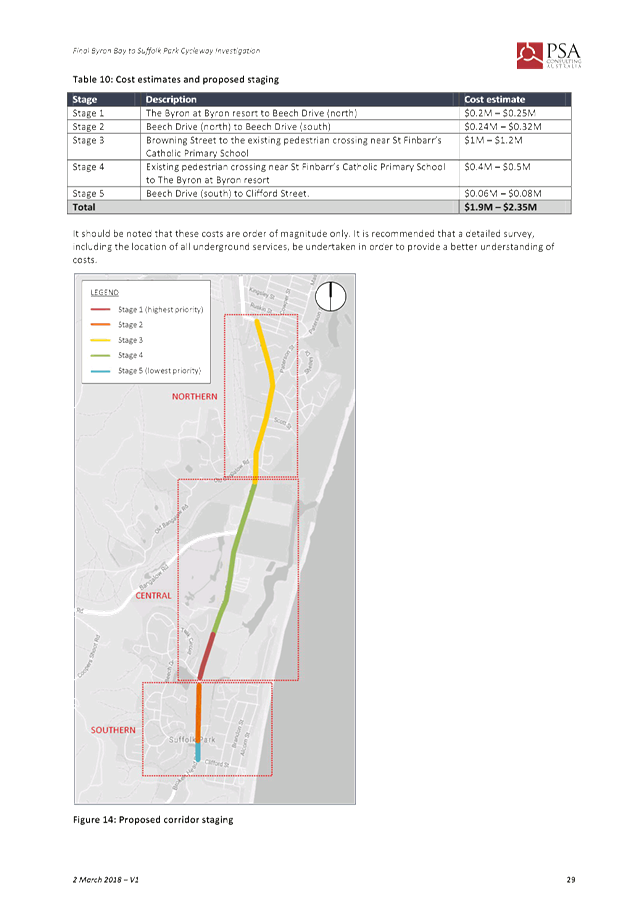

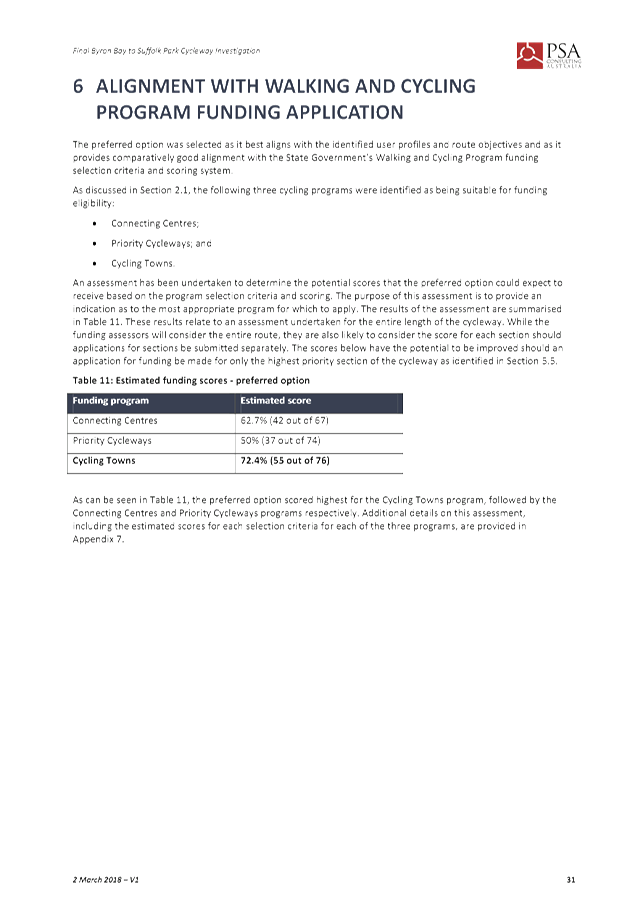


Staff Reports - Infrastructure Services 4.2 - Attachment 2
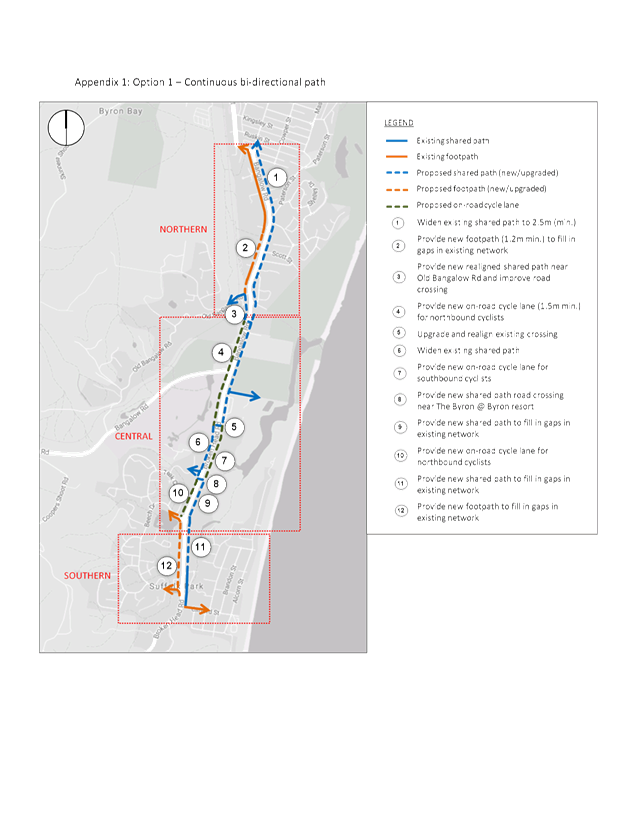
Staff Reports - Infrastructure Services 4.2 - Attachment 3
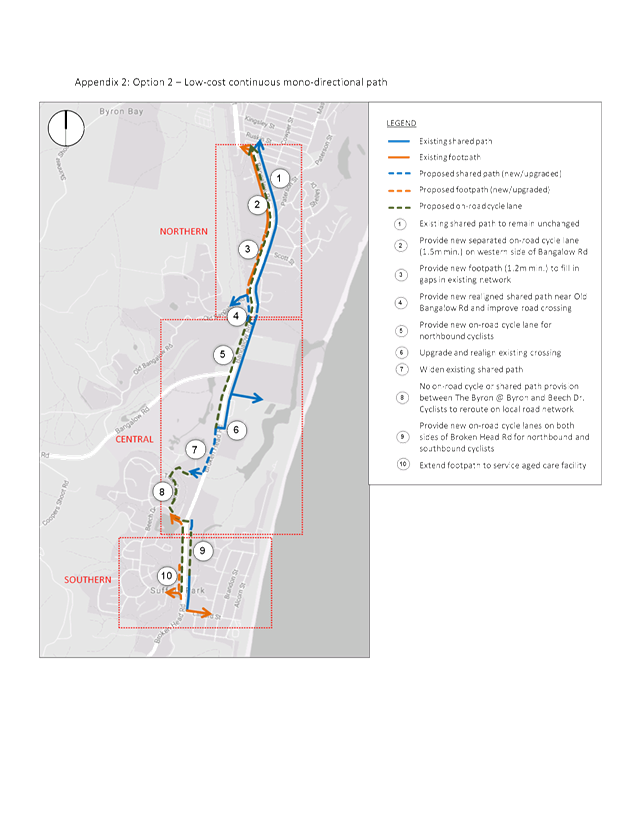
Staff Reports - Infrastructure Services 4.2 - Attachment 4
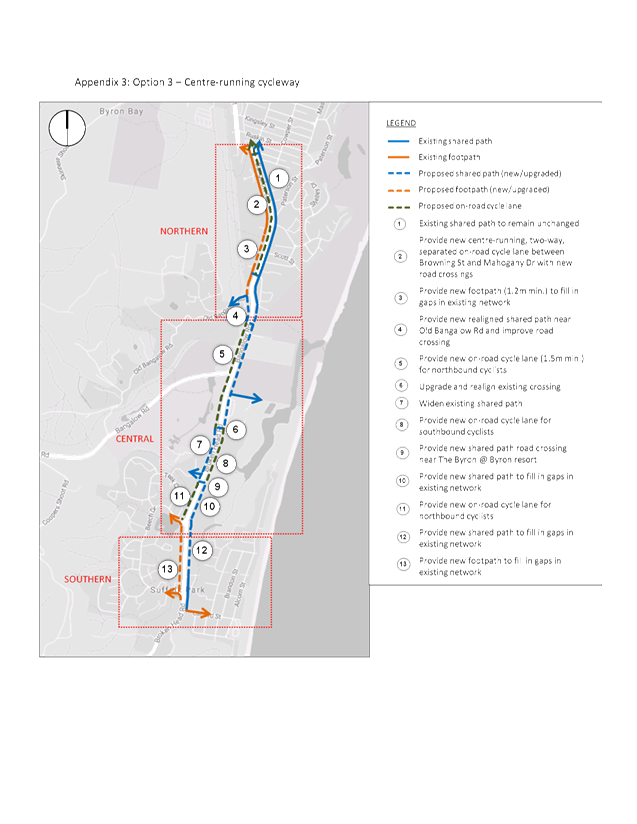
Staff Reports - Infrastructure Services 4.2 - Attachment 5
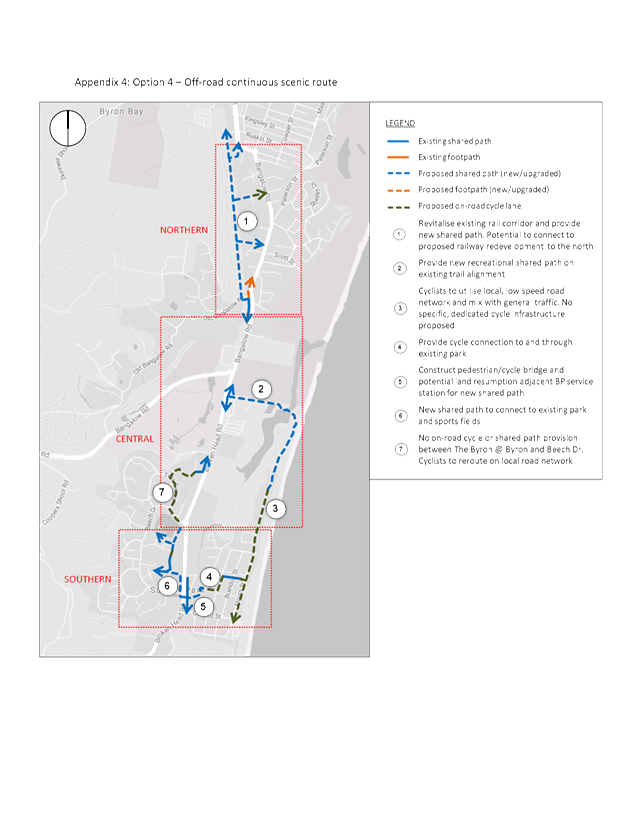
Staff Reports - Infrastructure Services 4.2 - Attachment 6
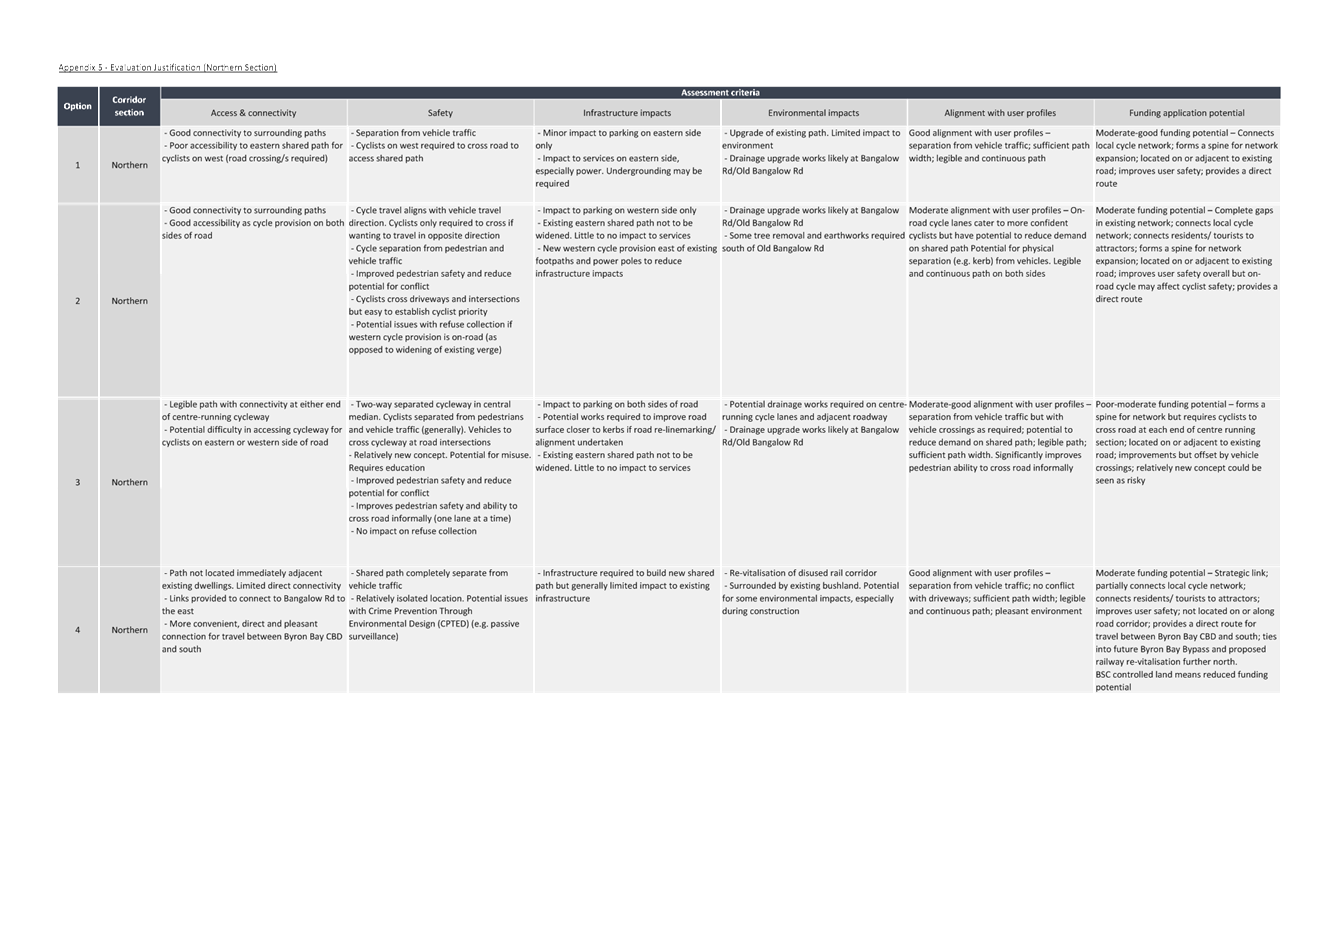
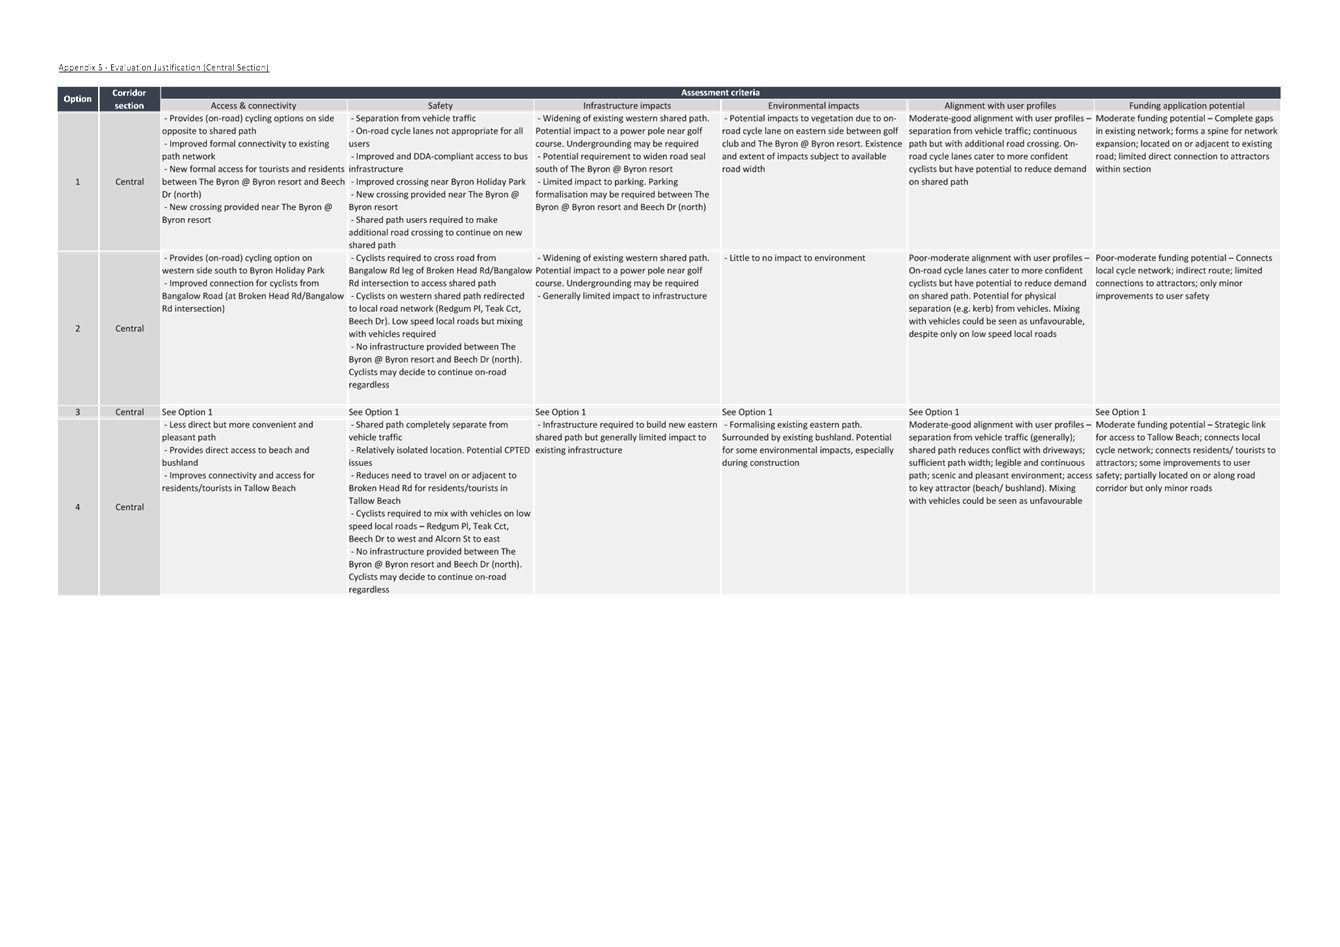
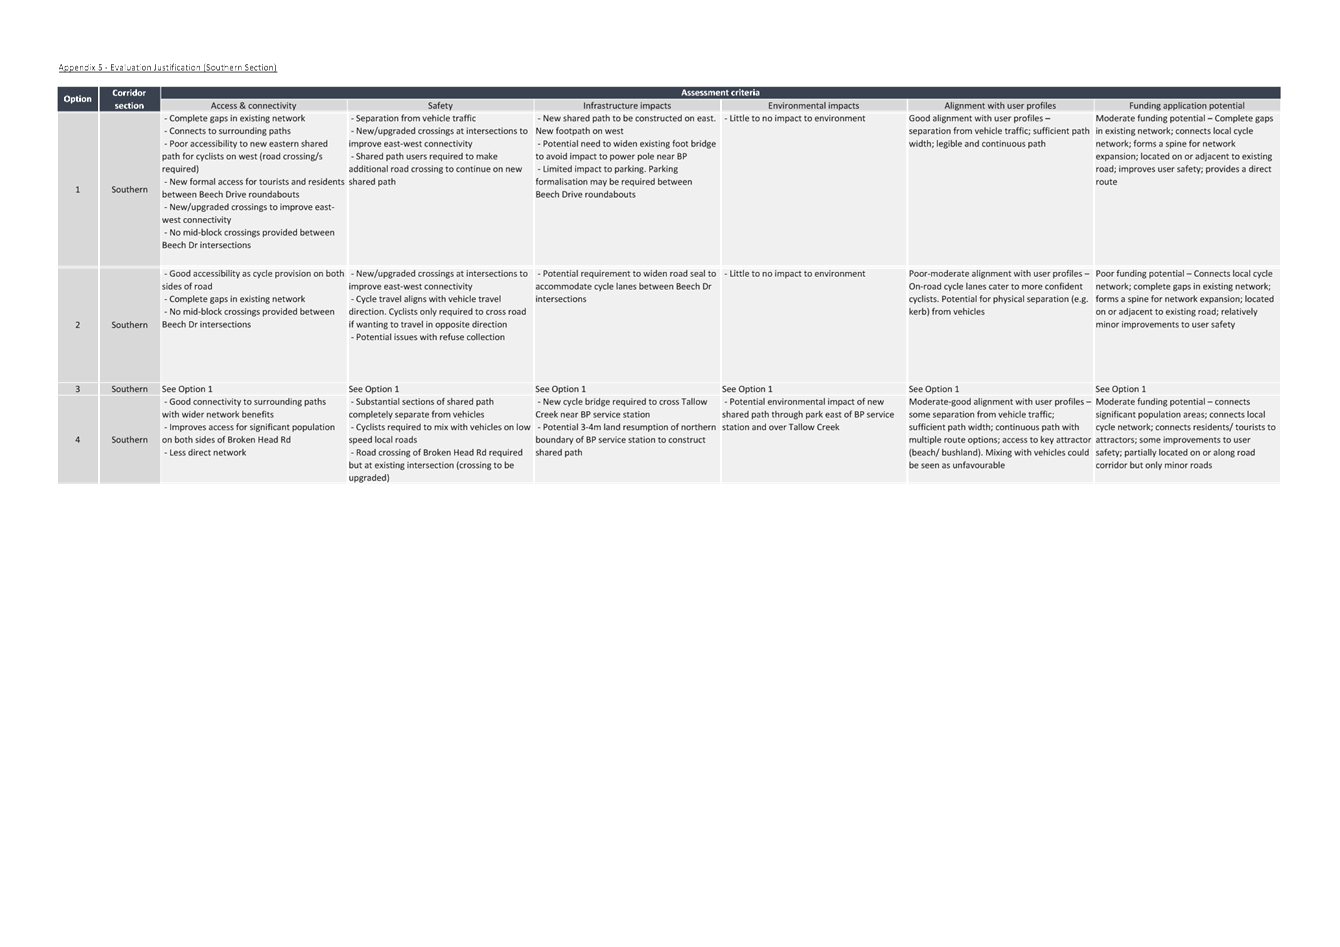
Staff Reports - Infrastructure Services 4.2 - Attachment 7
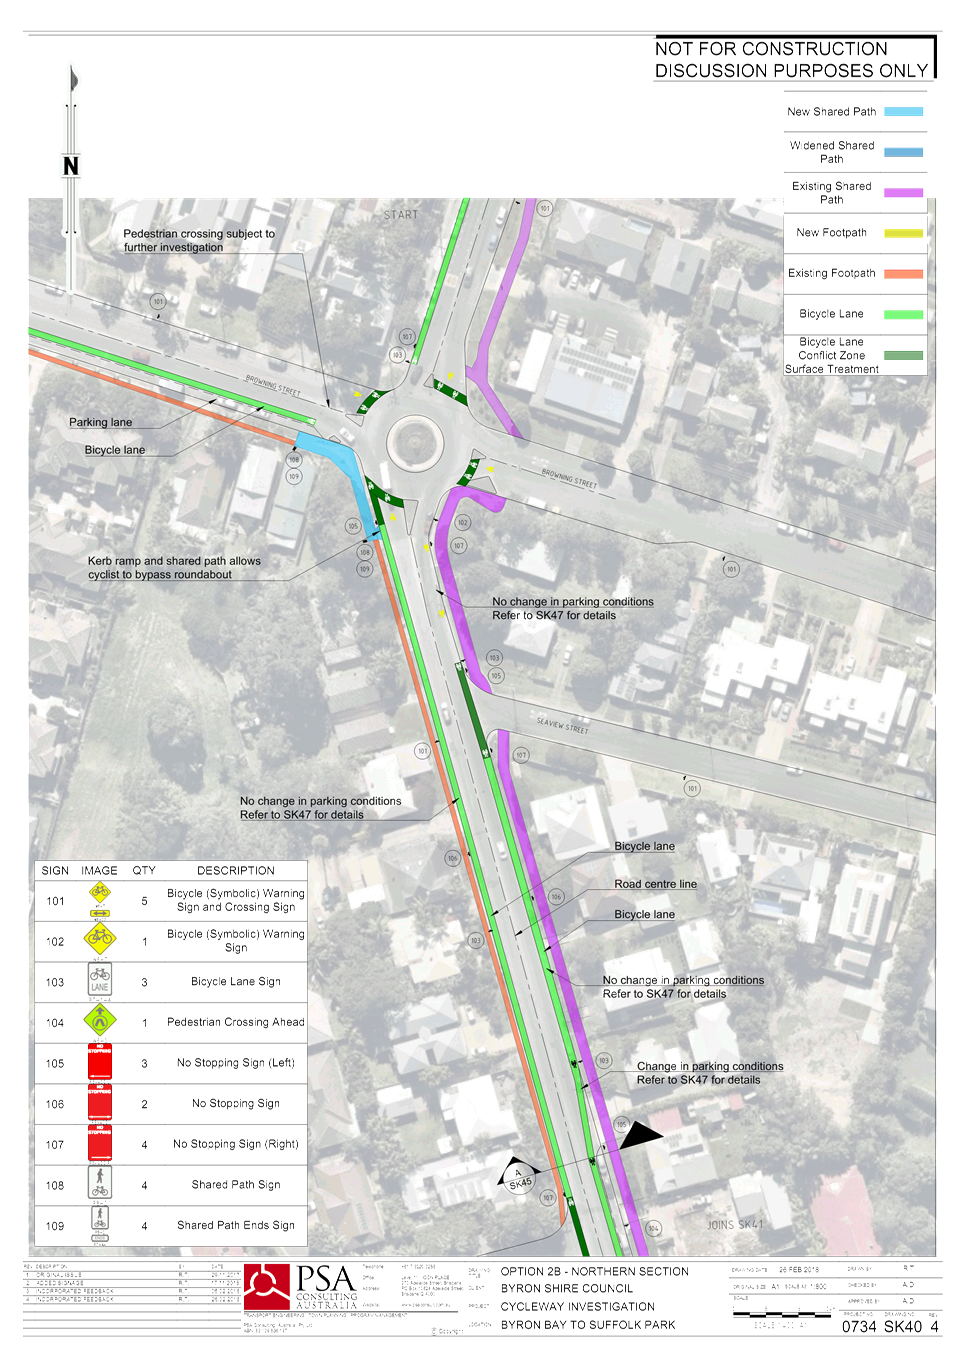
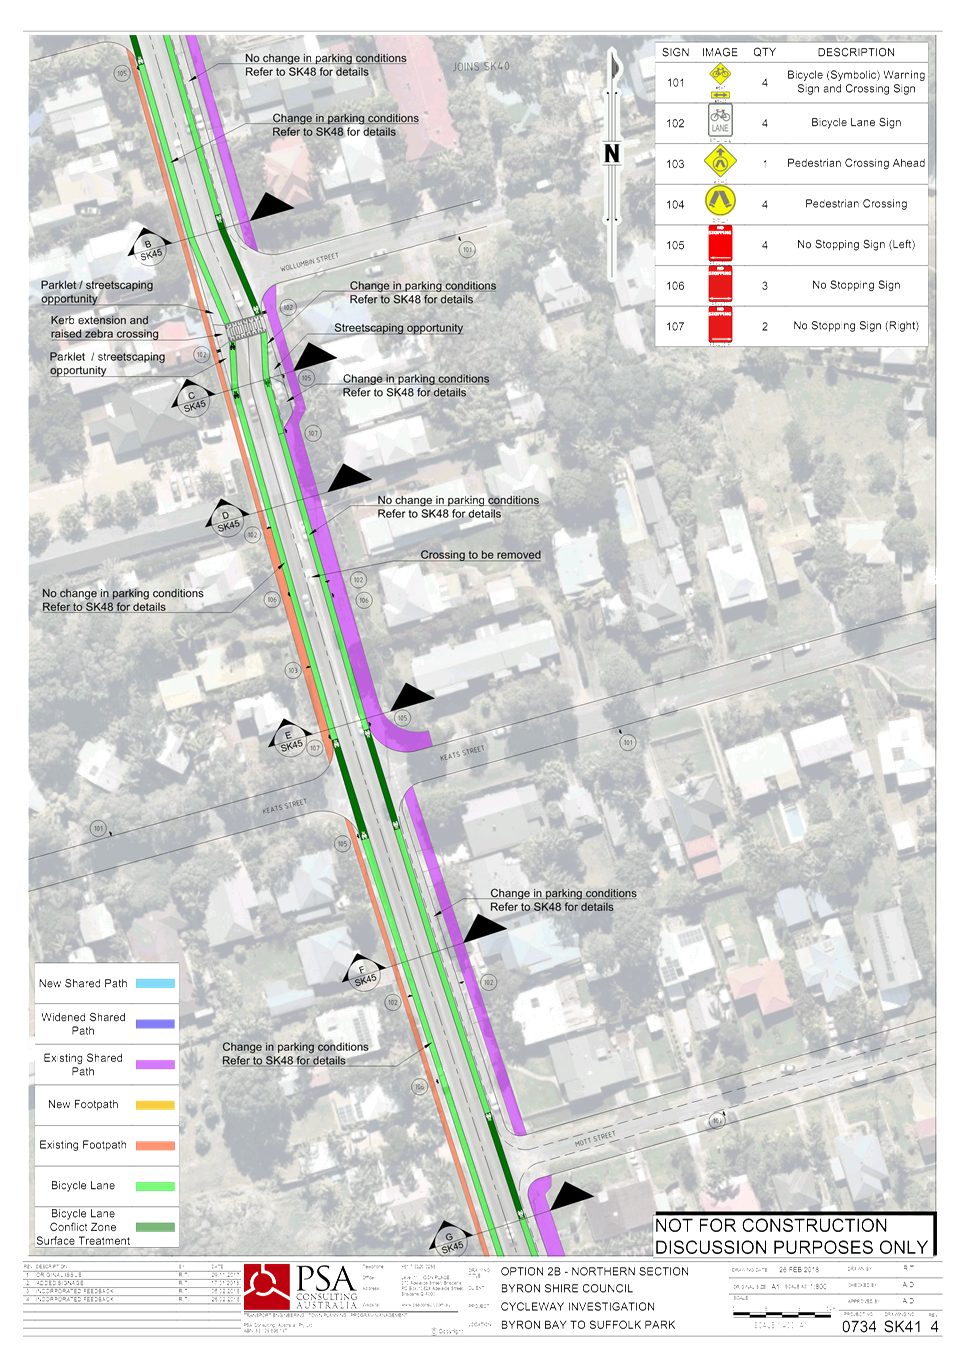
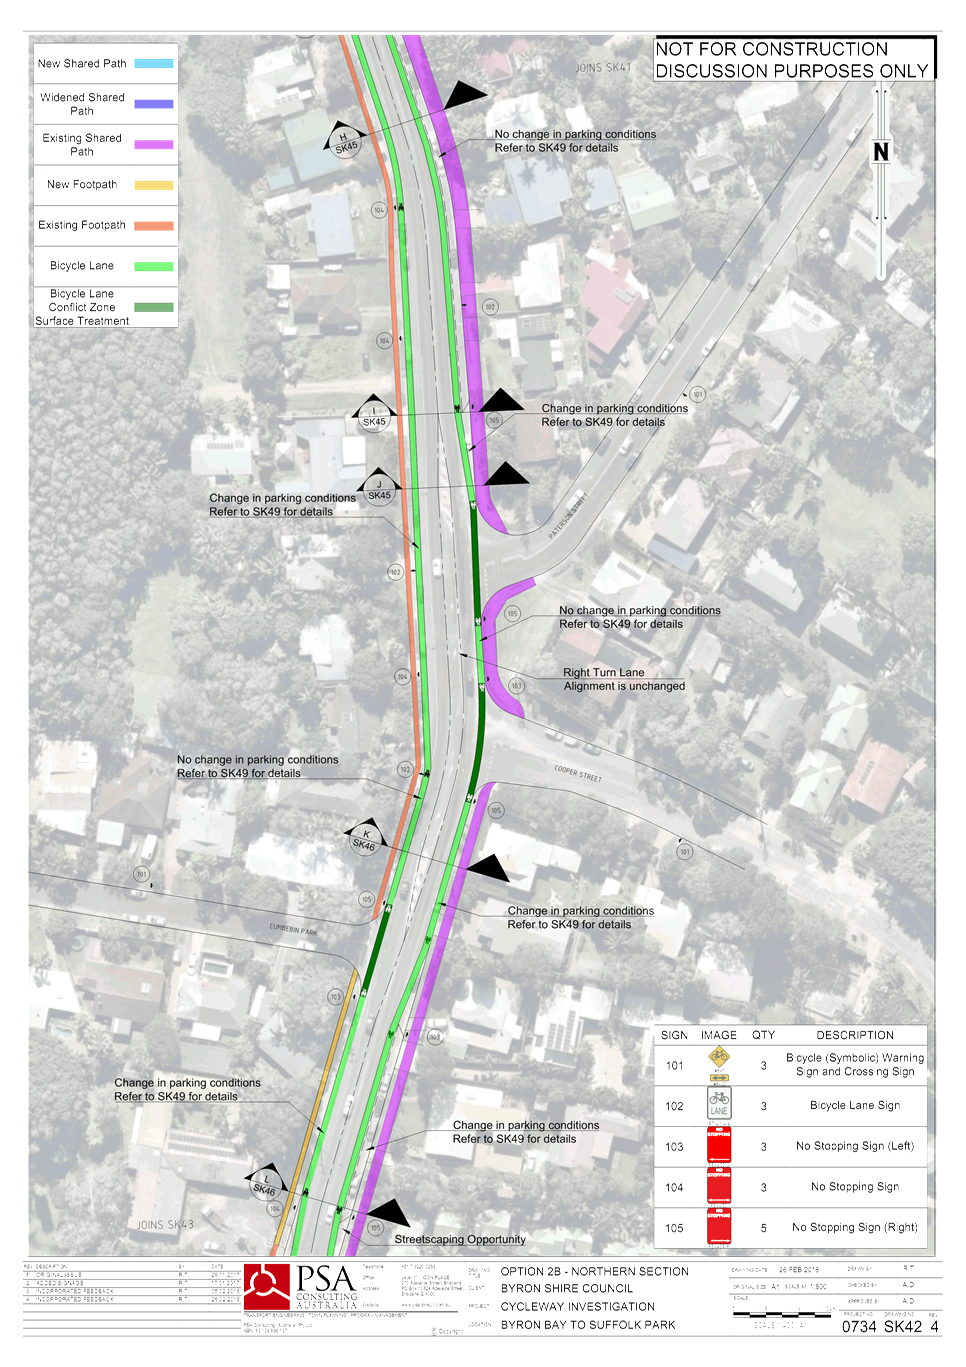
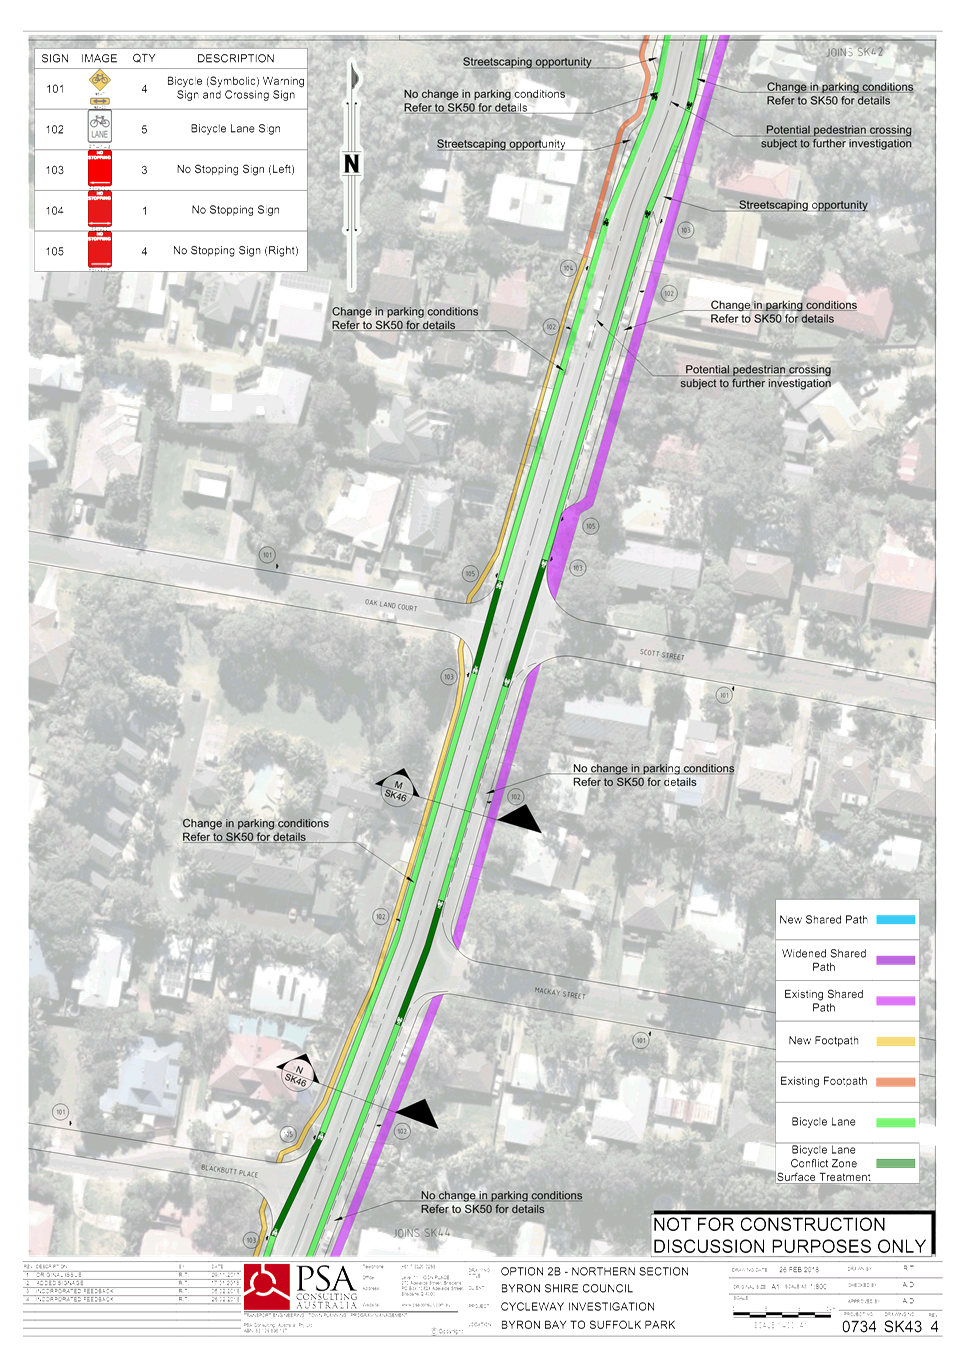
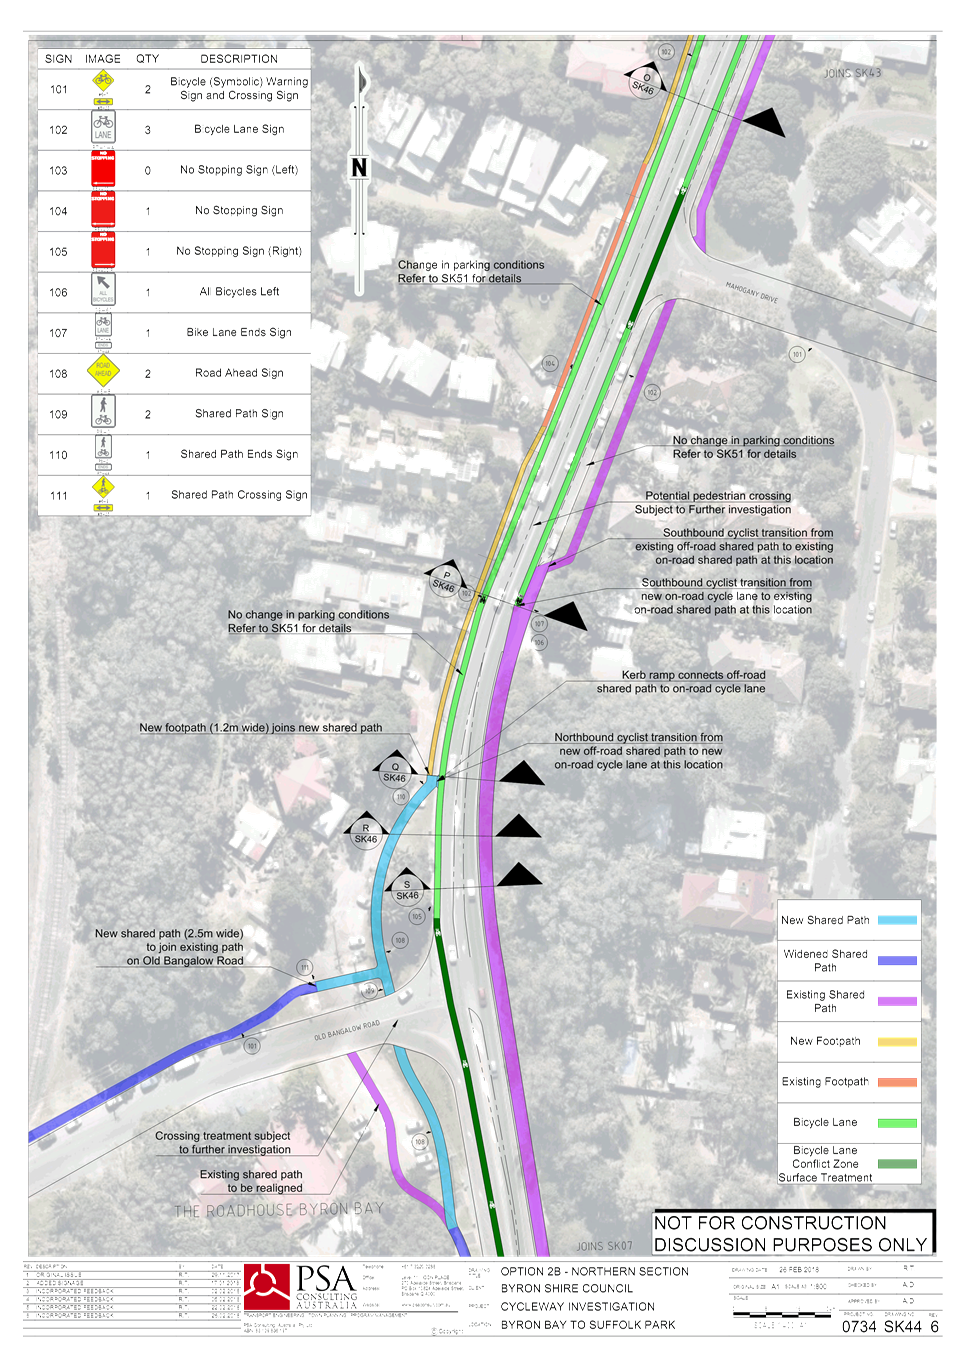
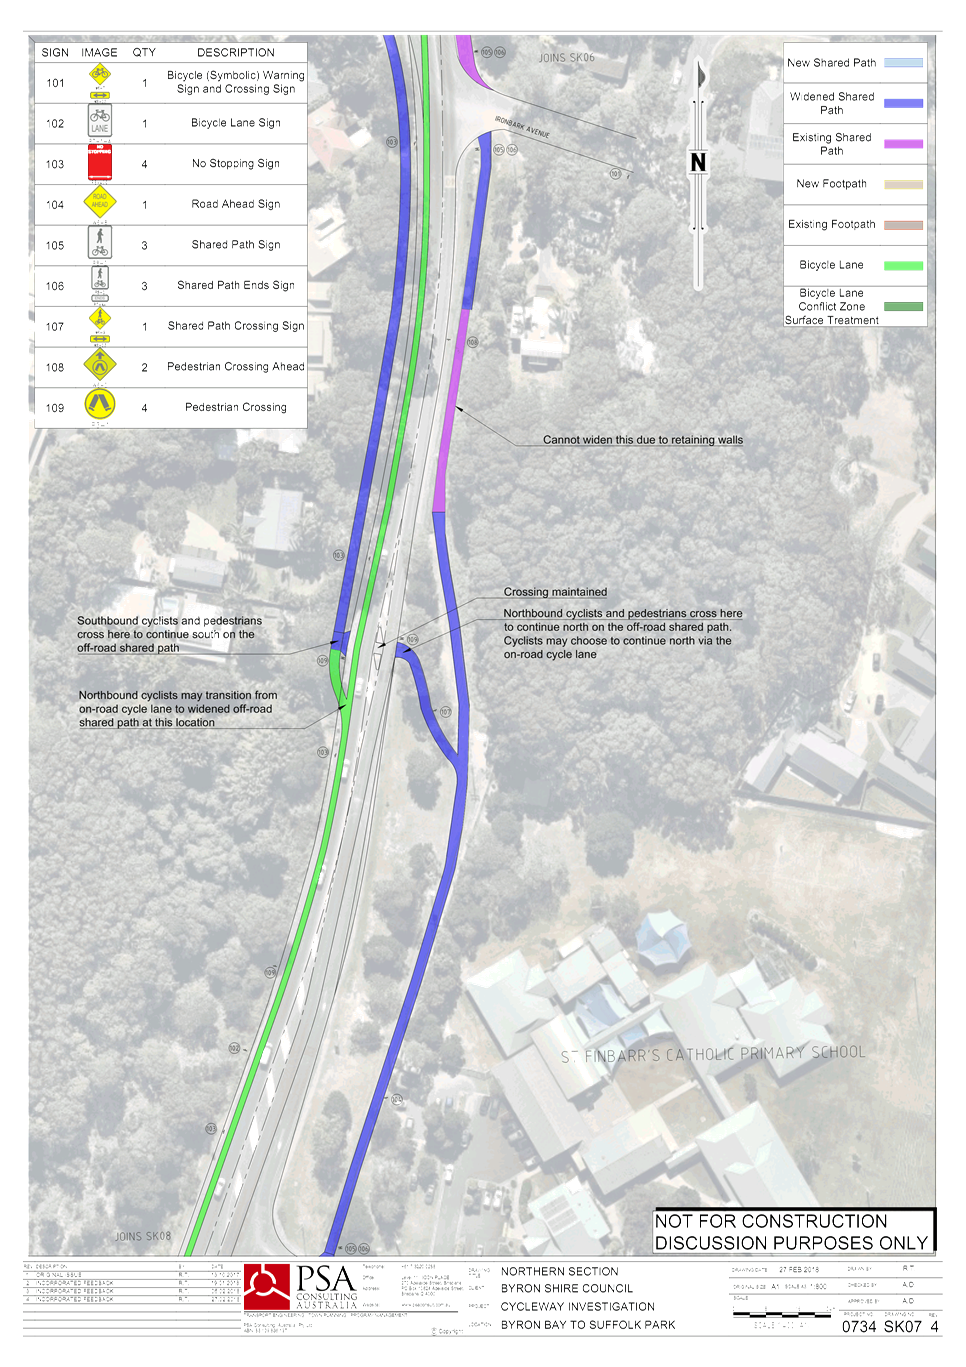
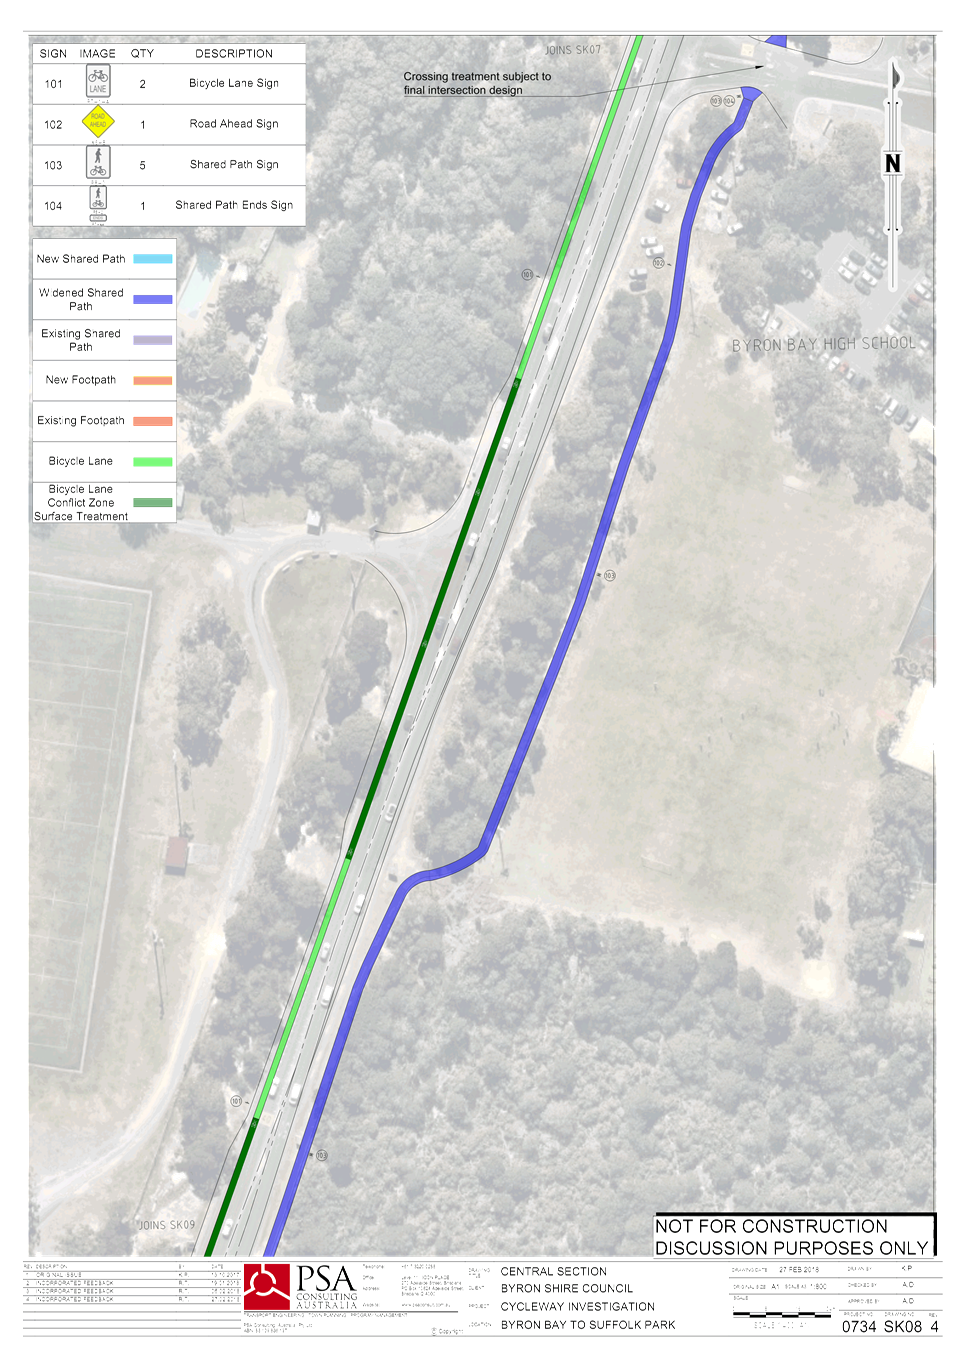
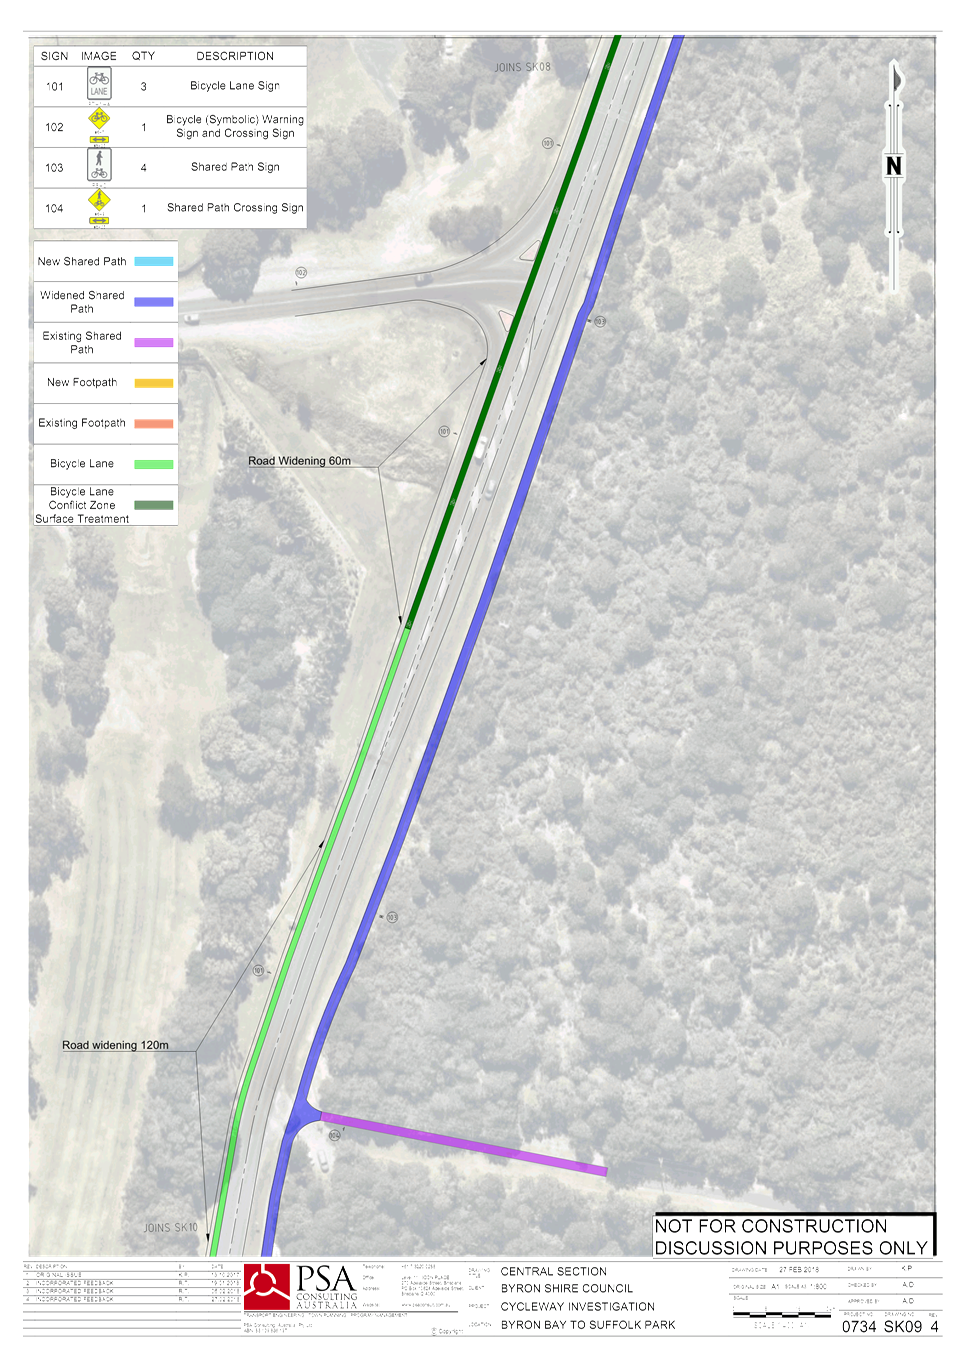
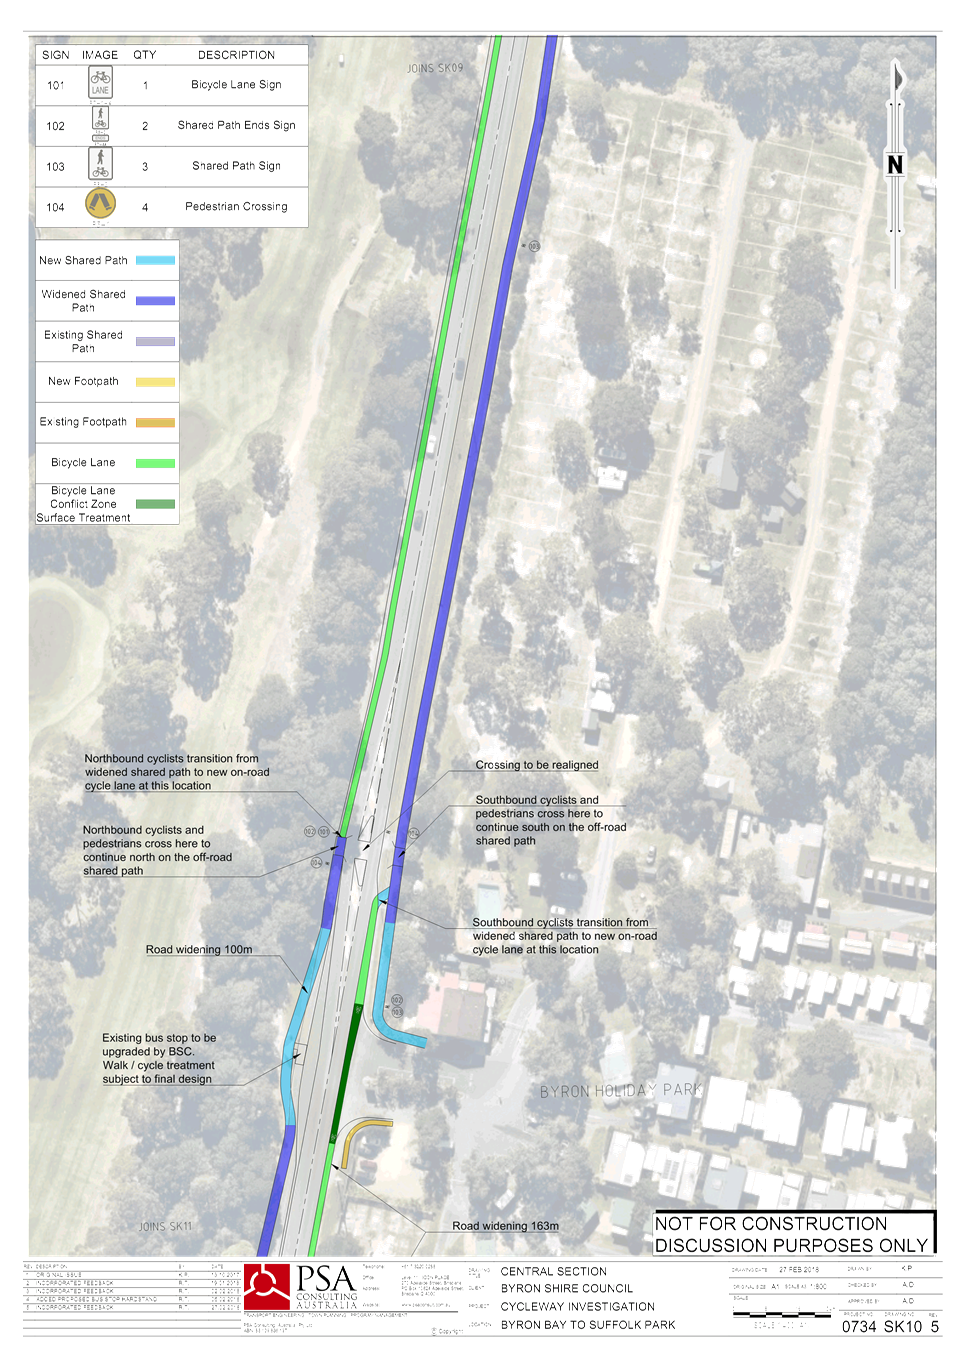
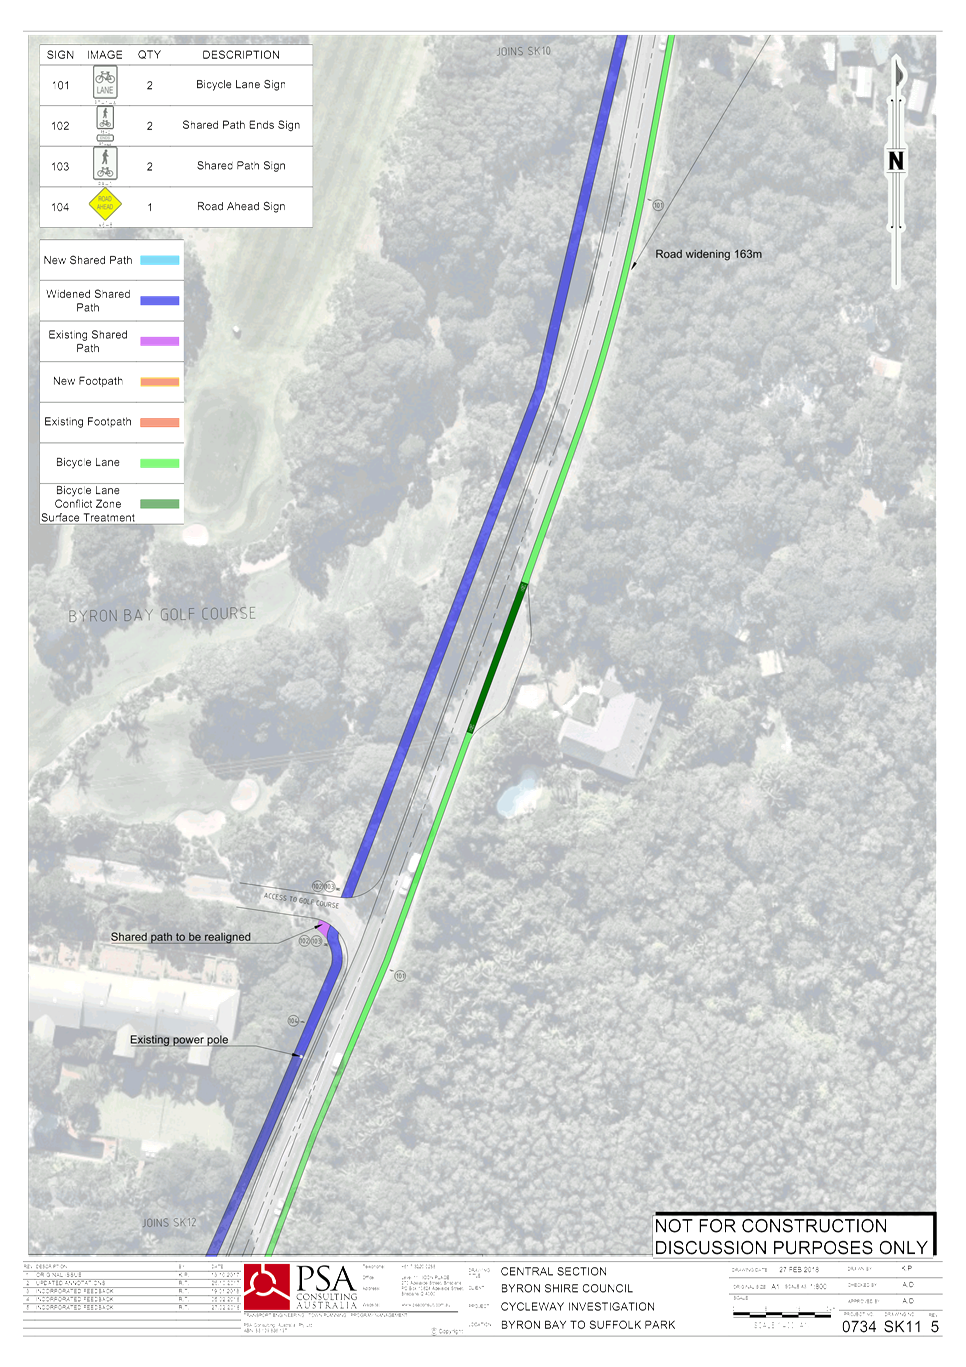
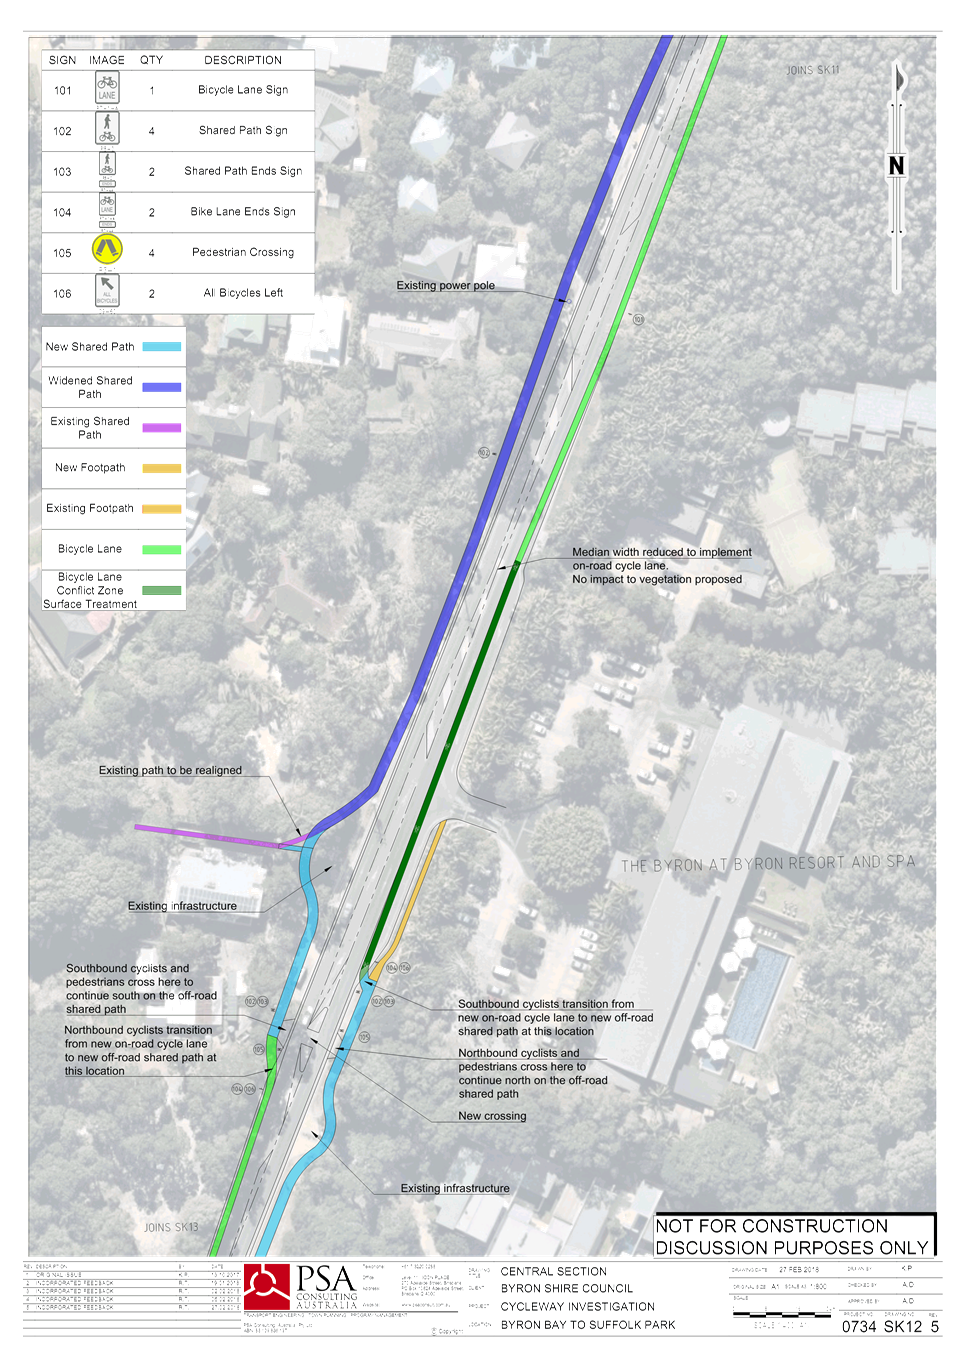
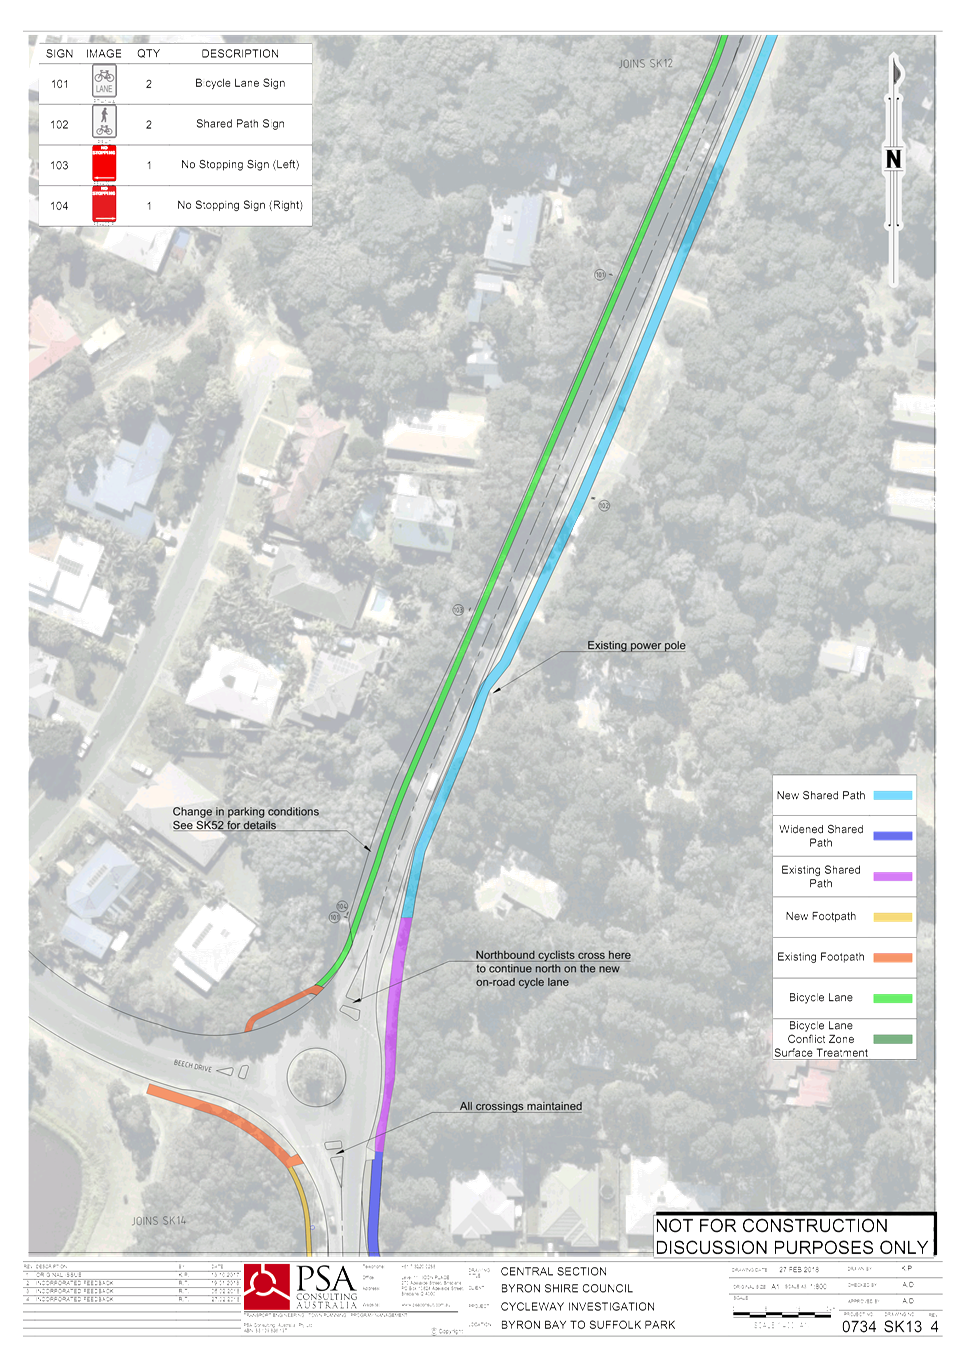
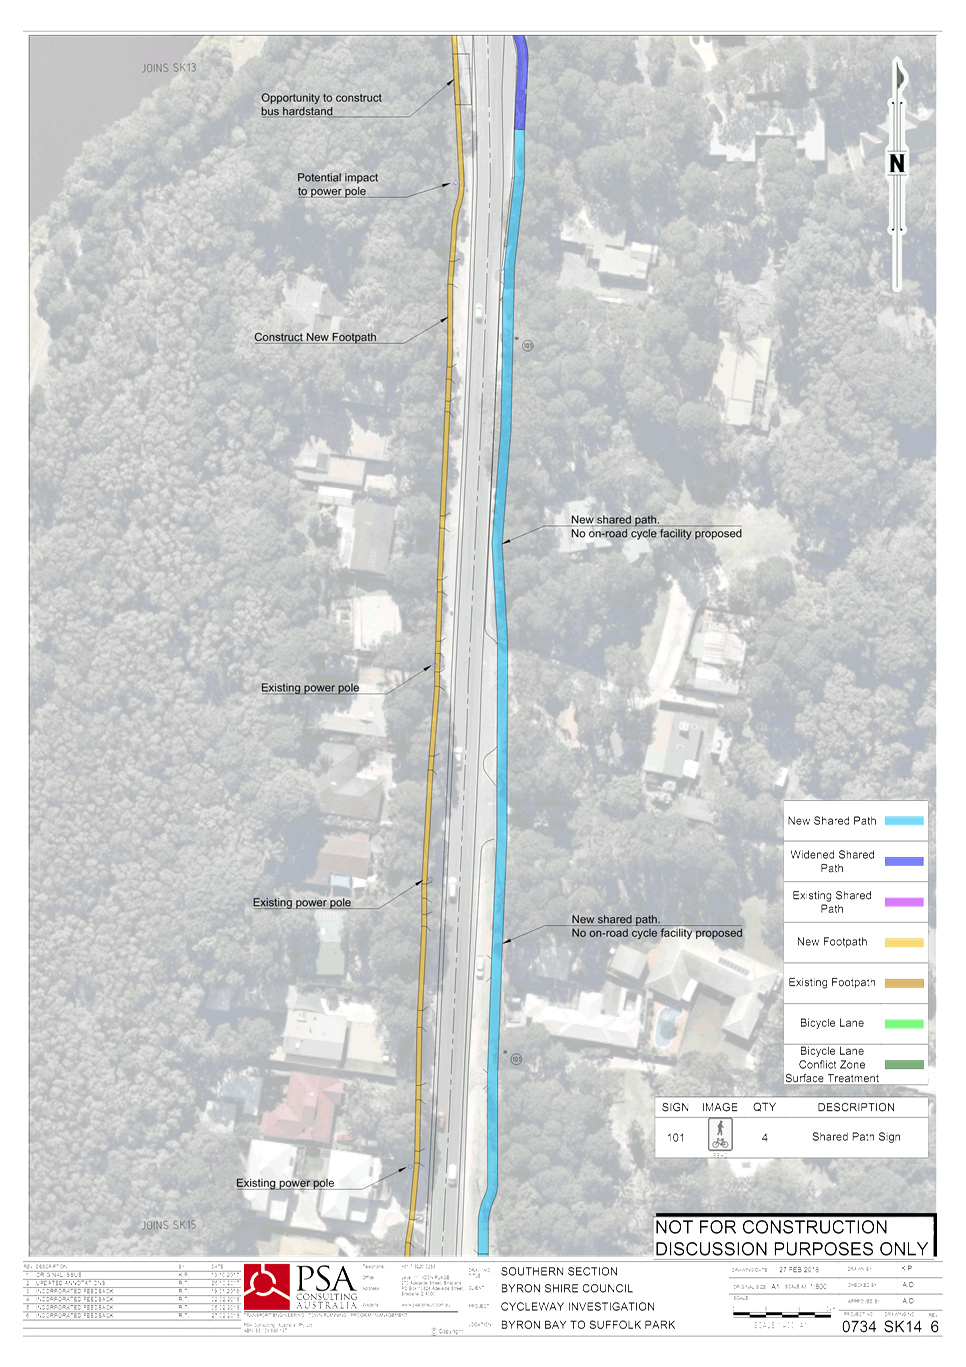
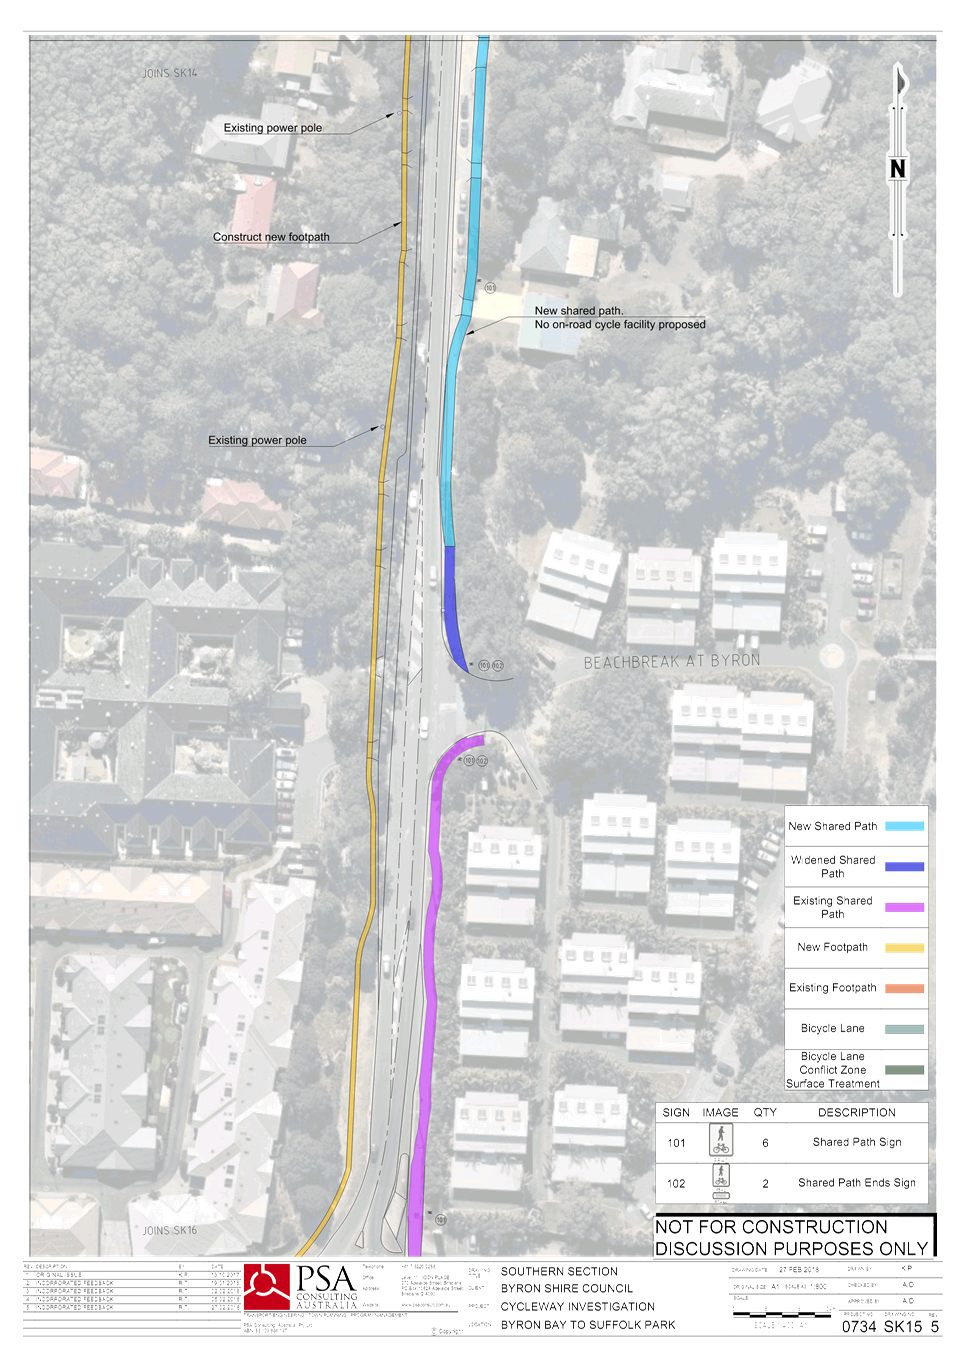
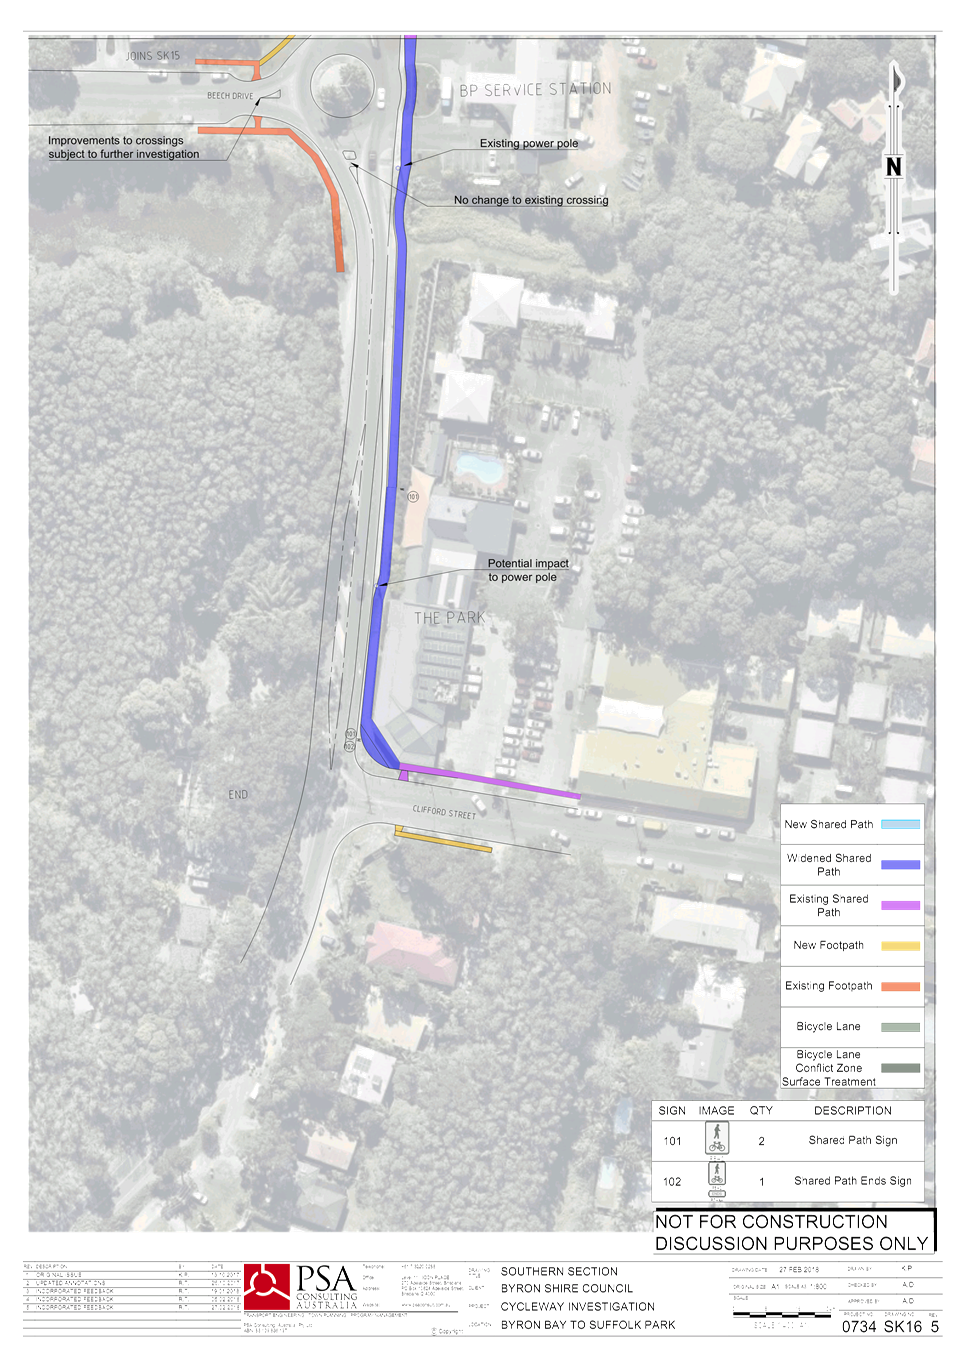
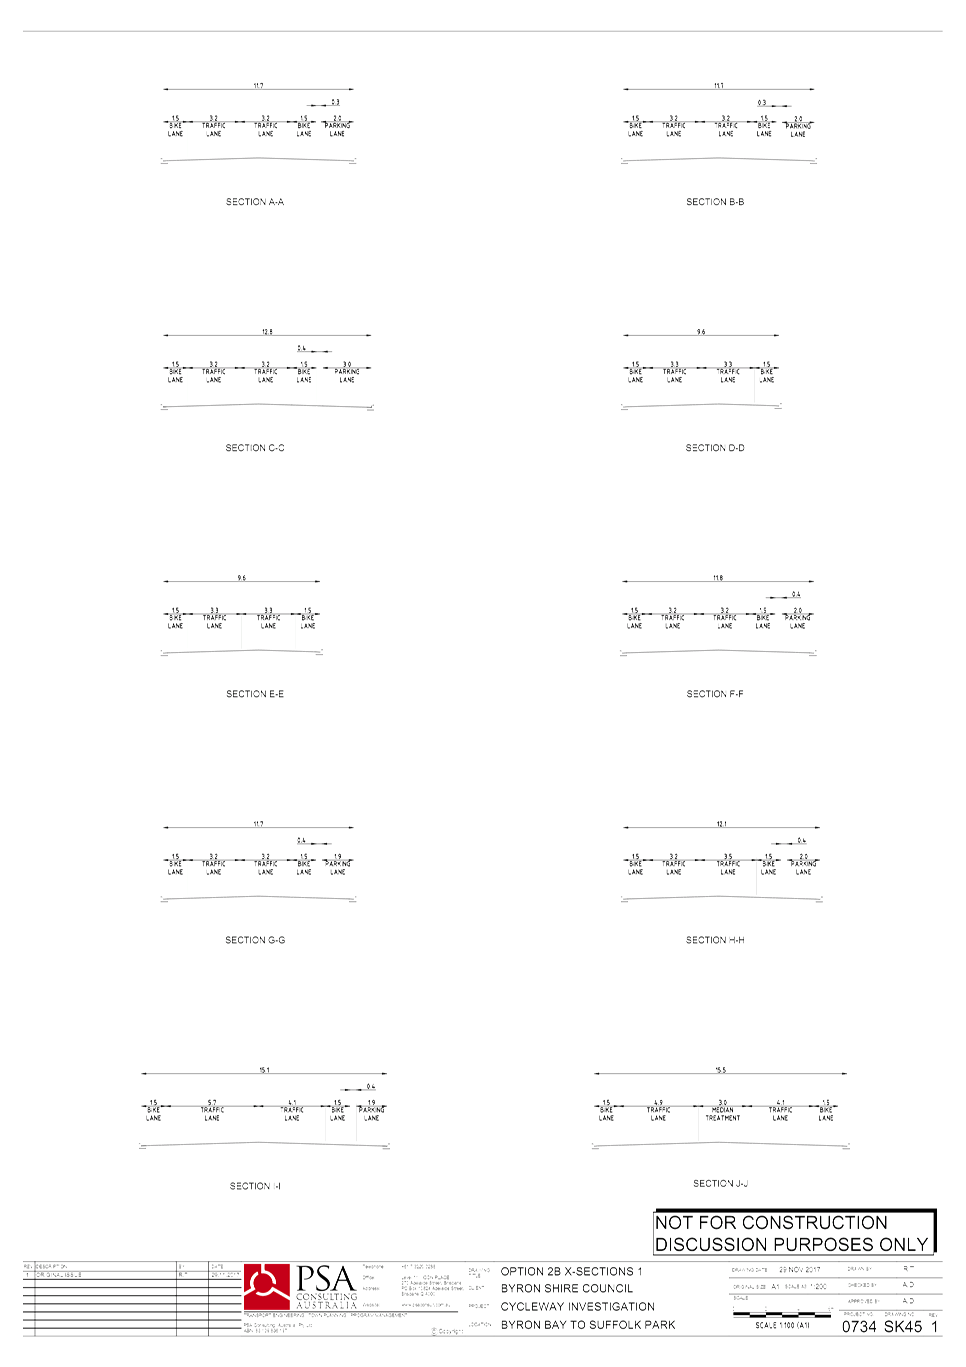
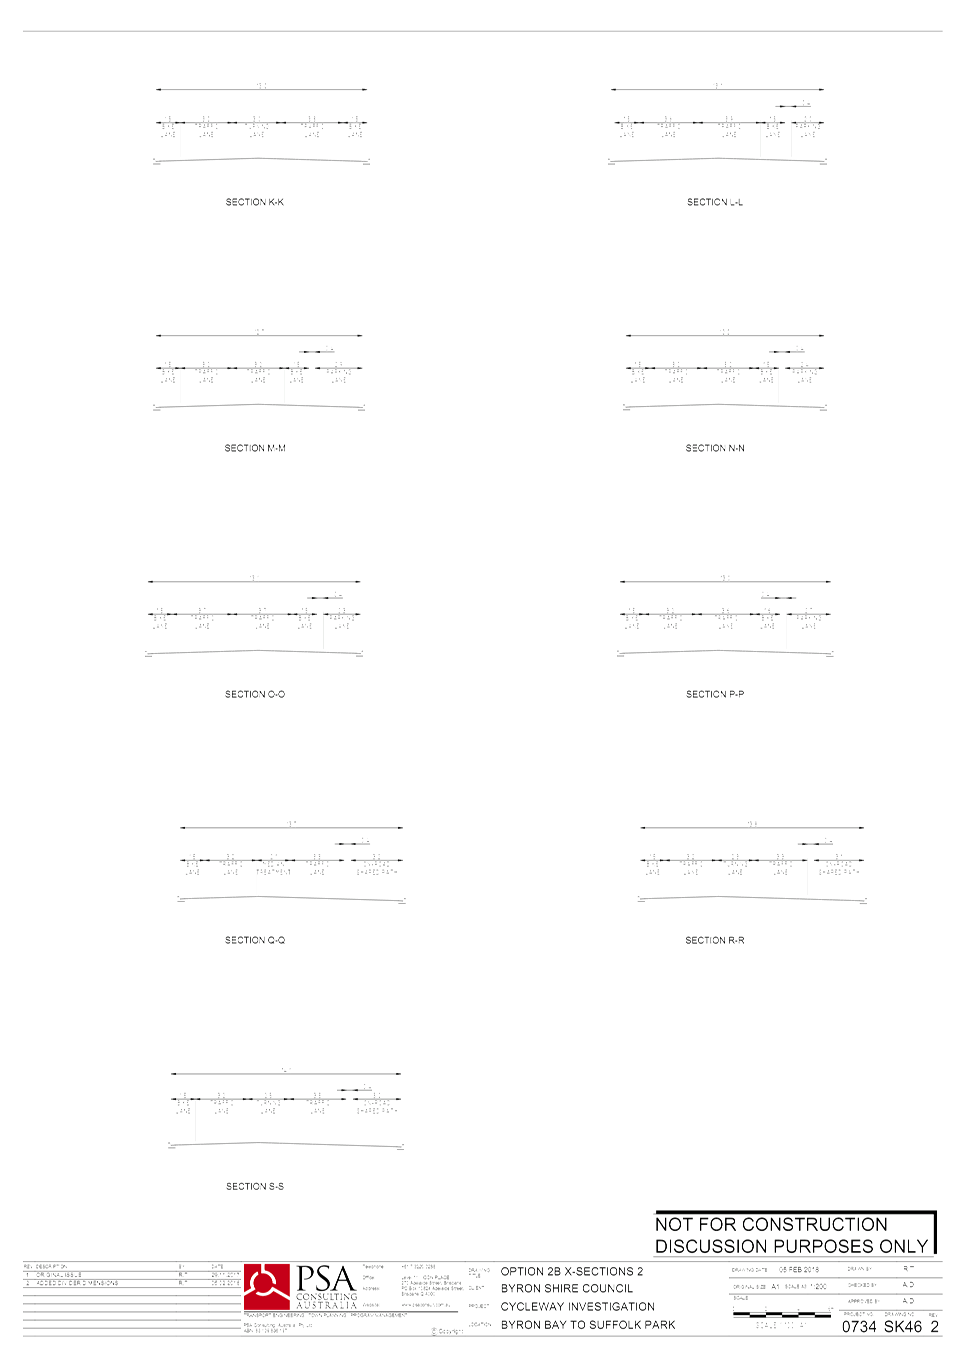
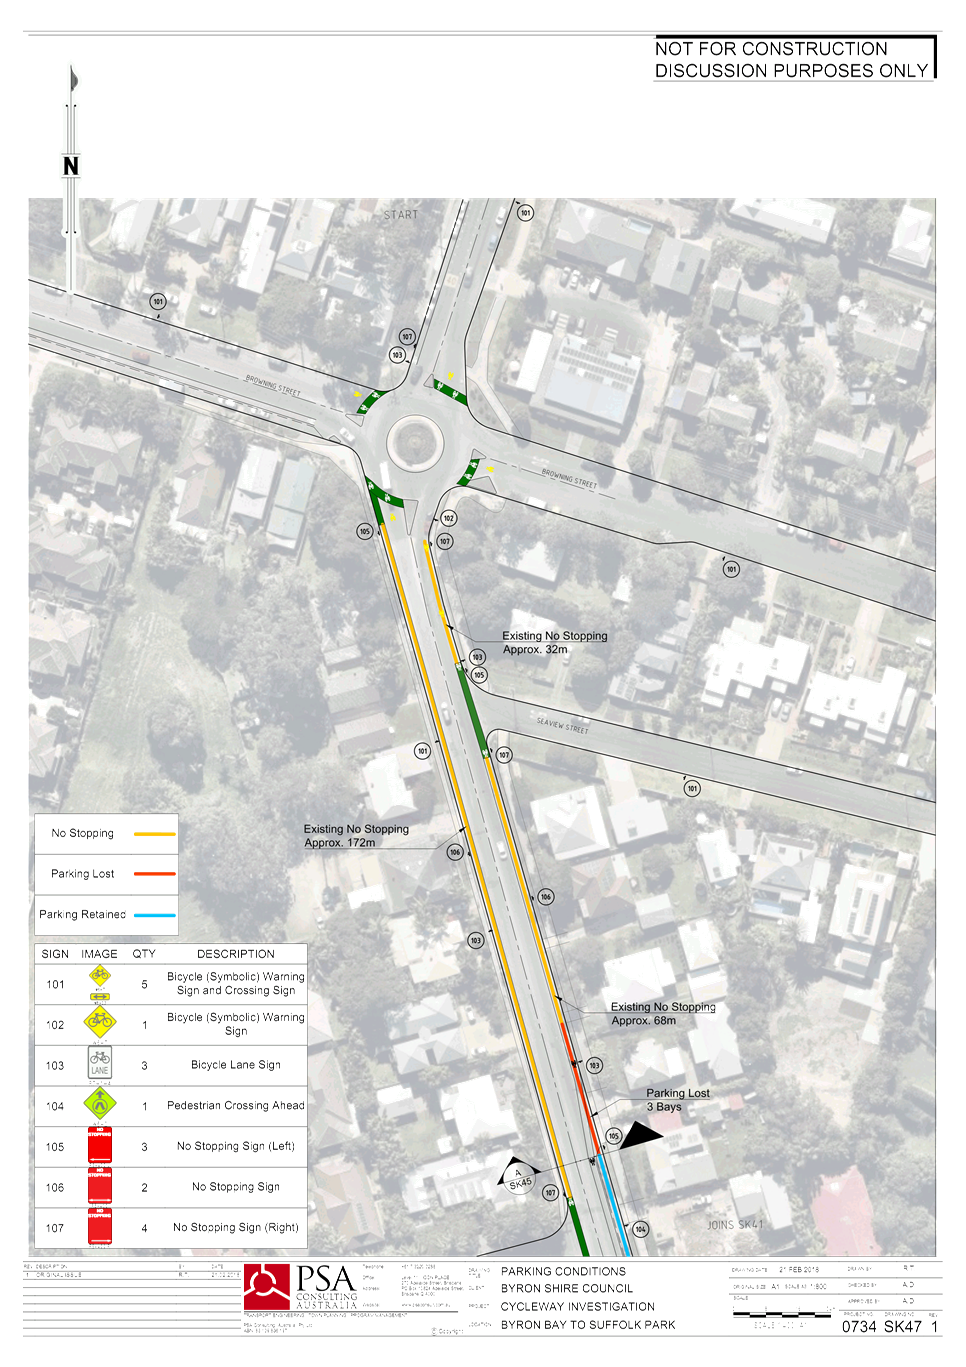
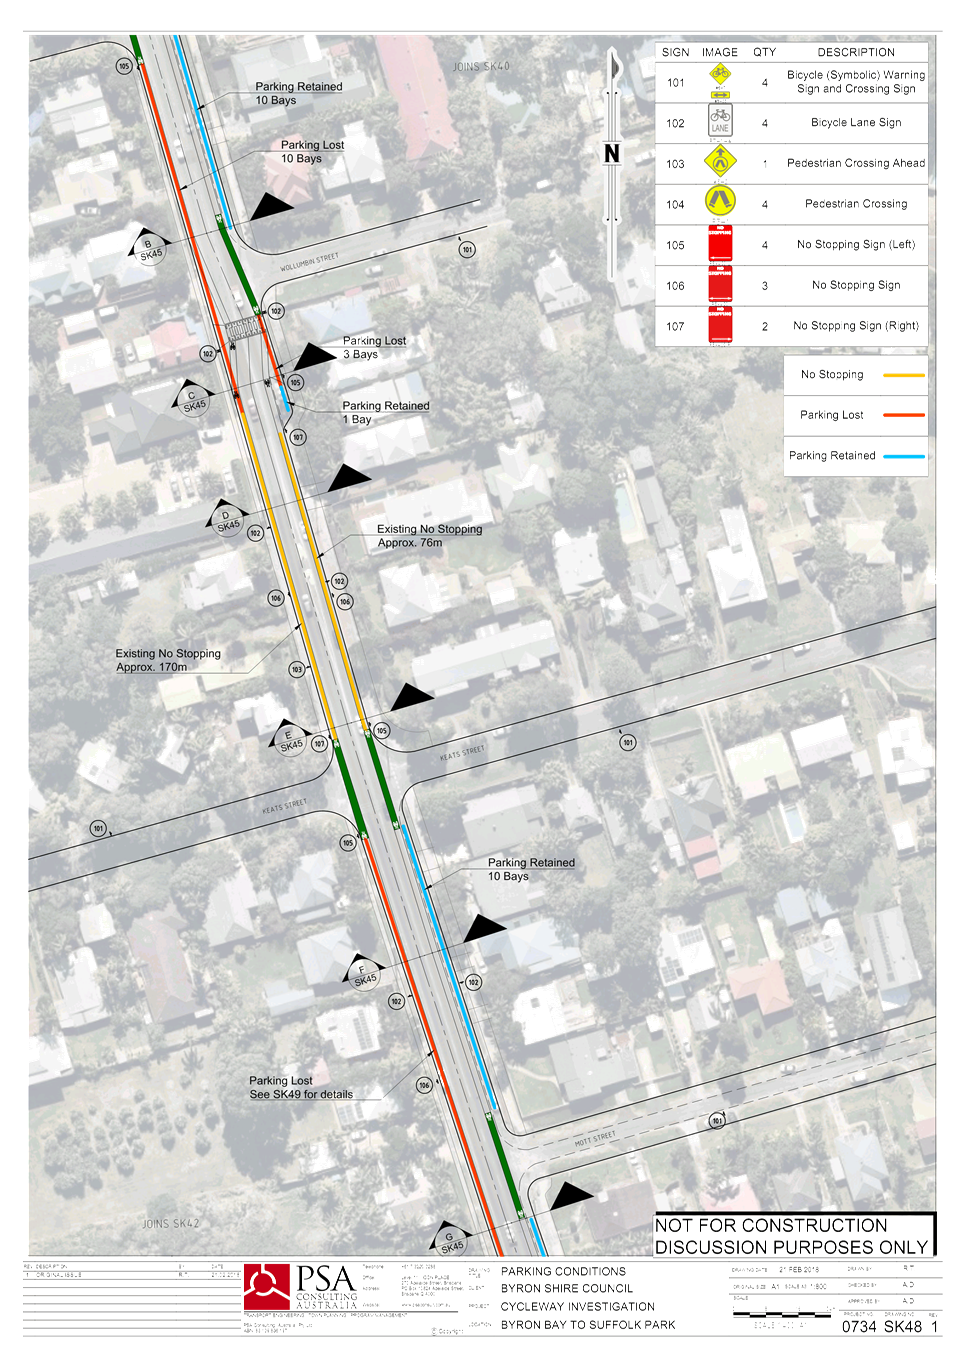
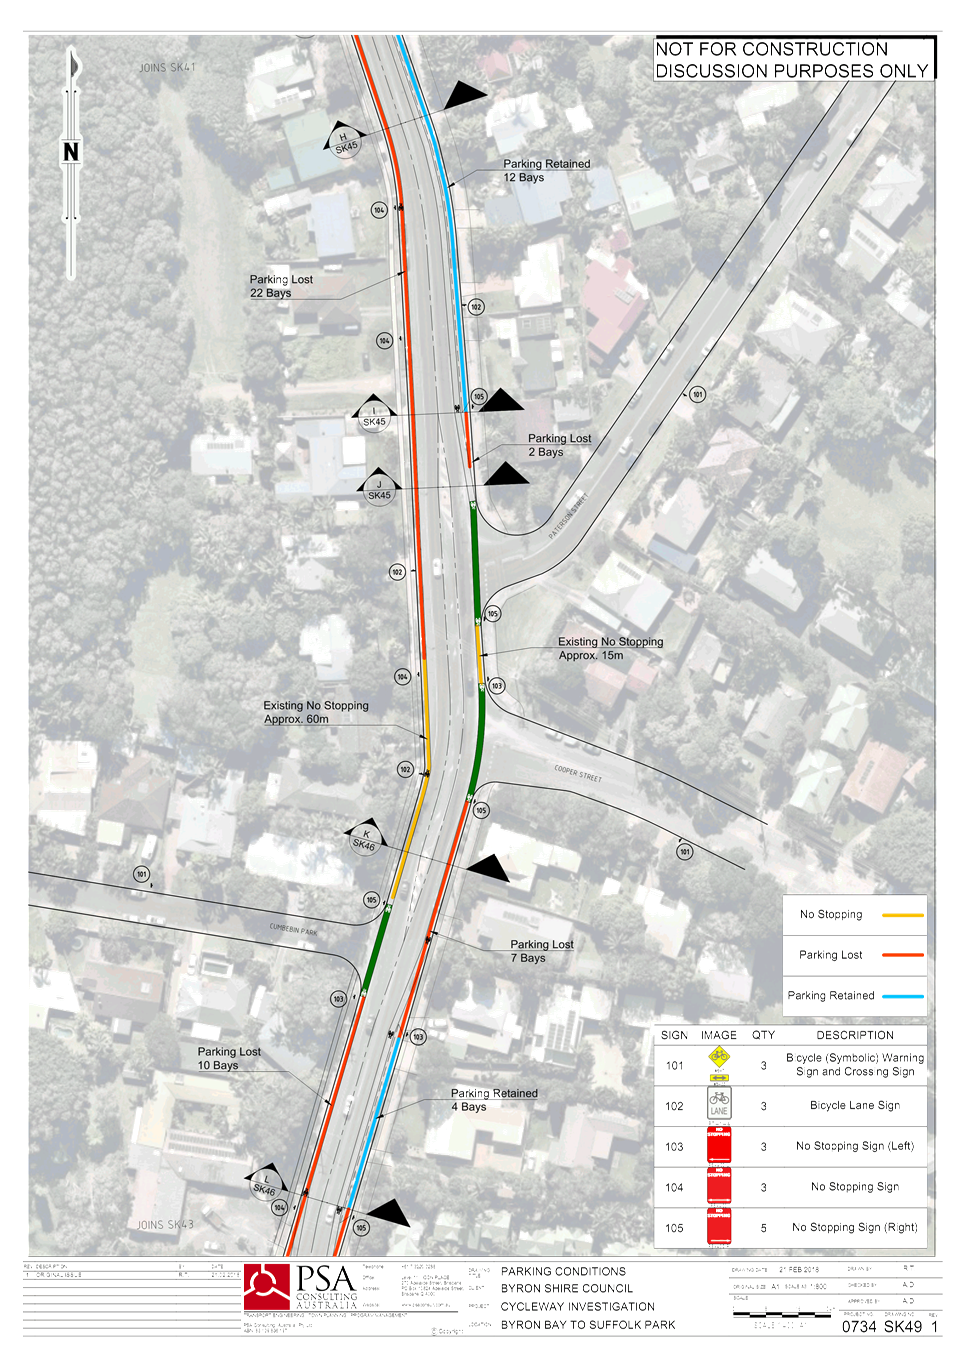
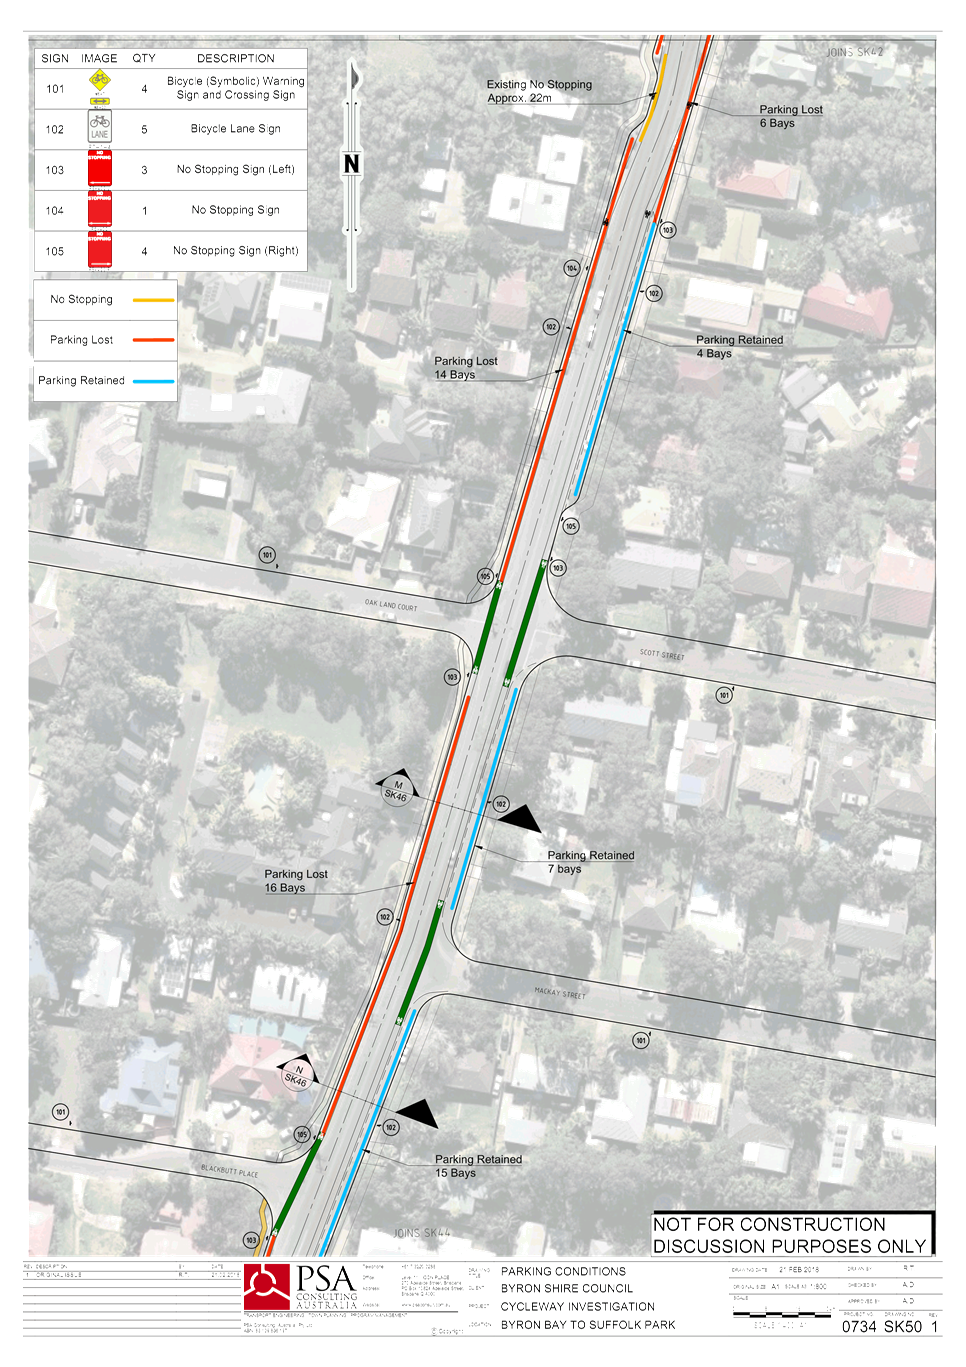
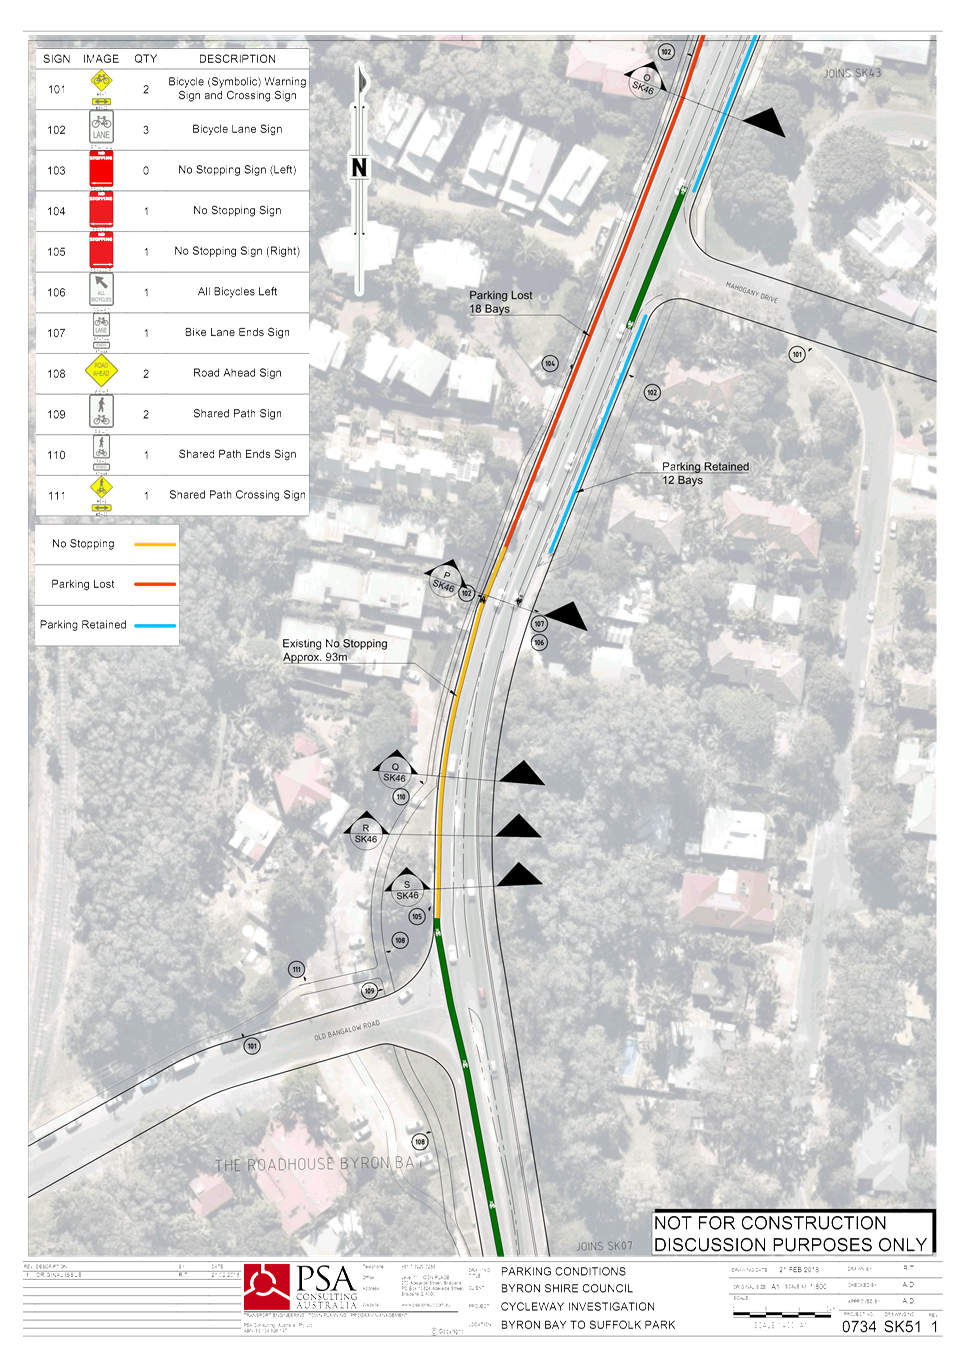
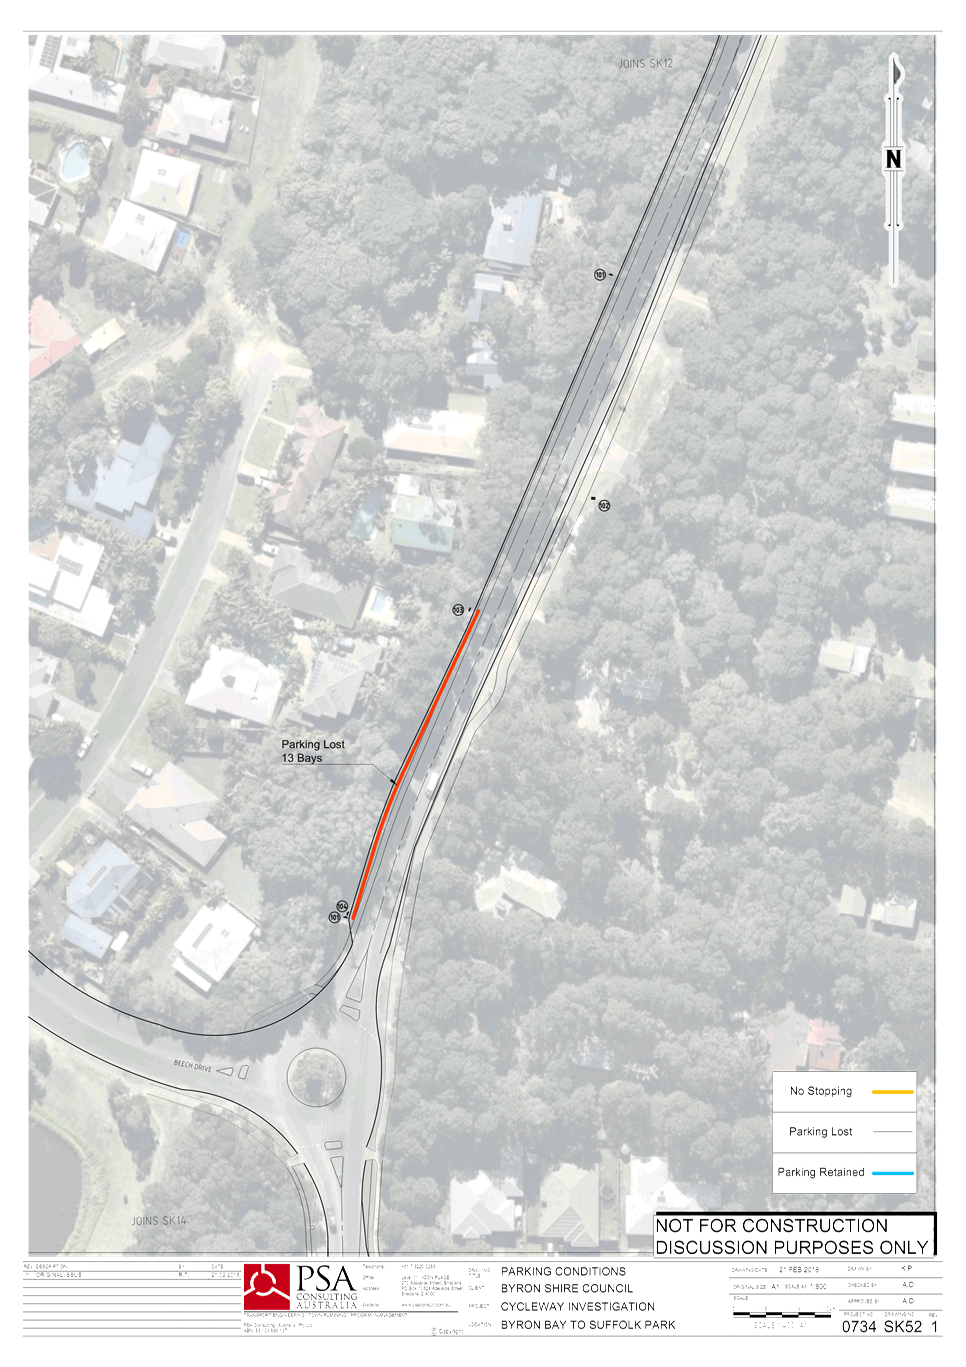
Staff Reports - Infrastructure Services 4.2 - Attachment 8
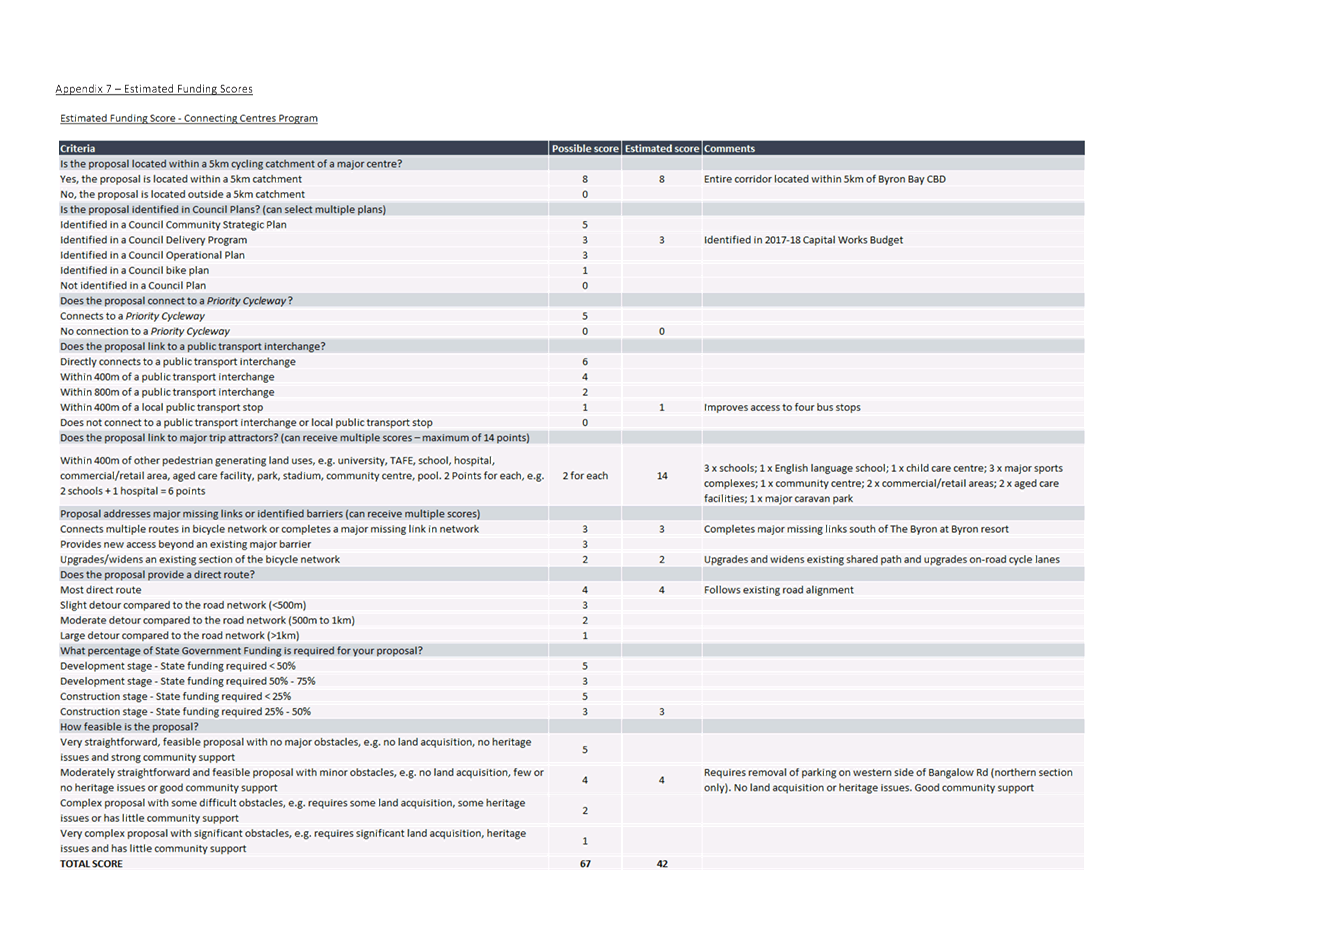
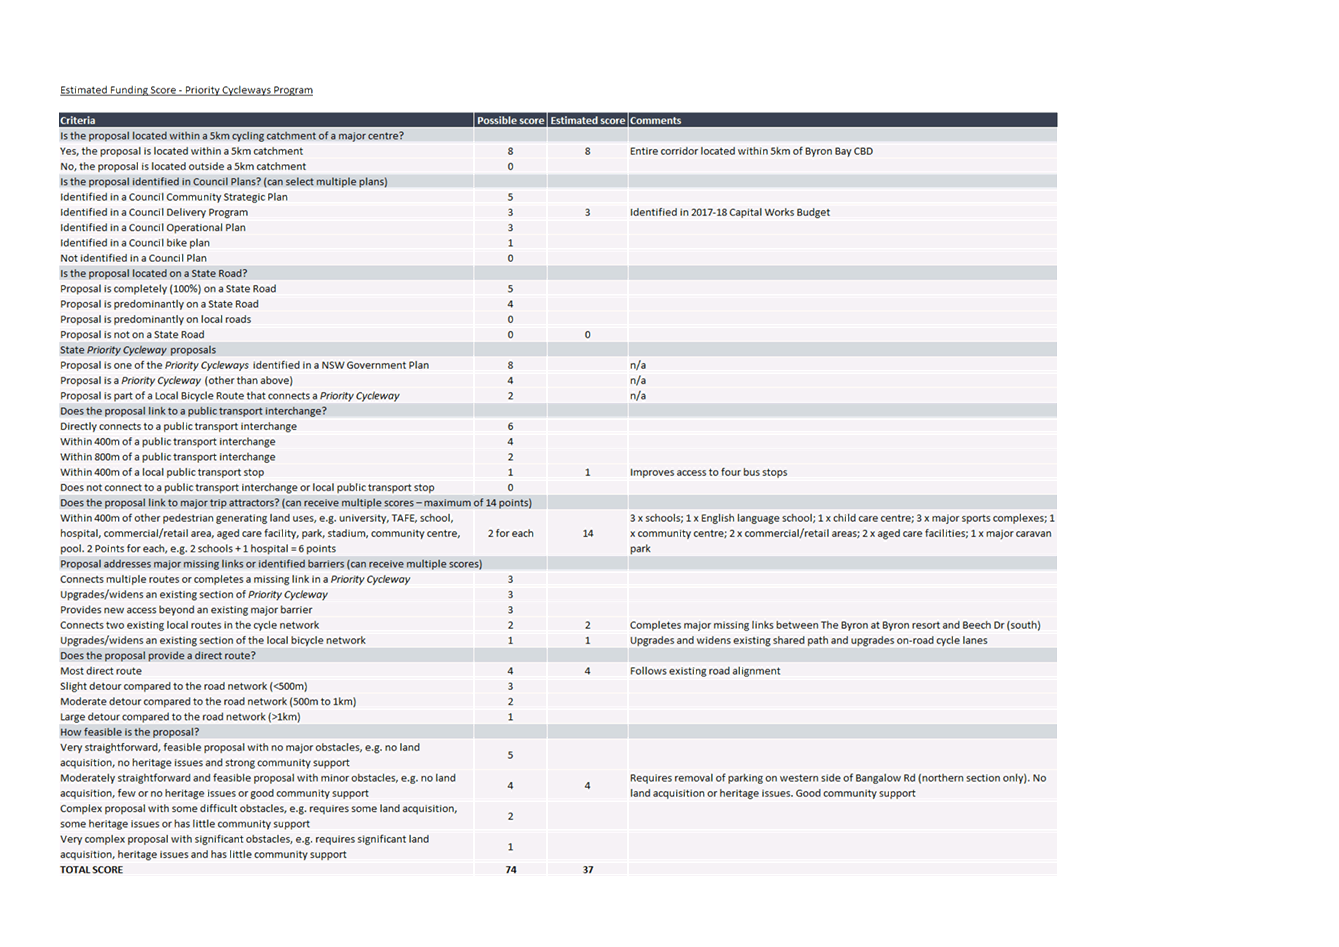
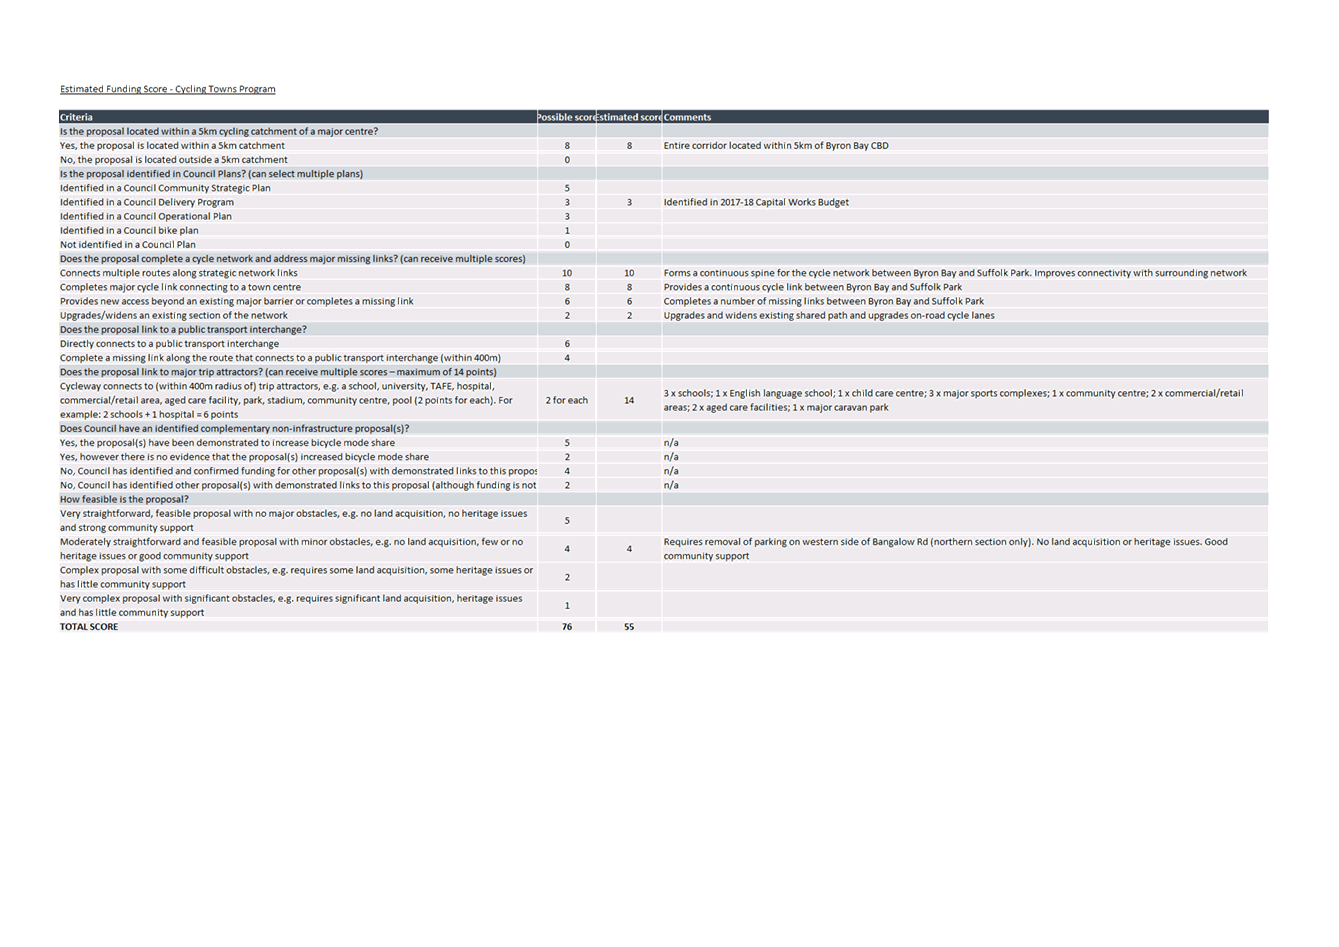
Staff Reports - Infrastructure Services 4.3
Report No. 4.3 High
Risk Infrastructure Service Priorities
Directorate: Infrastructure
Services
Report
Author: Blyth
Short, Asset Management Coordinator
File No: I2018/348
Theme: Community Infrastructure
Asset Management
Summary:
The purpose of this report is
to present information on high risk infrastructure assets and the link with the
Community Solution Panel Briefing Book. Significantly there is a major funding
gap for required renewals of high risk Causeways and Major Culverts. The
recent awarding of $5.17 million grant funding for bridge renewals has created
an opportunity for Council to reassign proposed loan funding for the renewal of
high risk Causeways and Major Culverts.
|
RECOMMENDATION:
That the balance of the loan funds previously
anticipated for Bridge Renewal now be committed over the coming financial
years to the renewal of high risk Rural Causeways and Major Culverts.
|
Report
The purpose of this report is
to present information on high risk infrastructure assets and the link with the
Community Solution Panel Briefing Book. Information on the Panel is available
online (http://www.yoursaybyronshire.com.au/byron-shire-community-solutions-panel).
The high risk infrastructure assets are identified as
below:
· Bridges
· Rural Stormwater
Causeways and Major Culverts
· Road defects
· Stormwater defects
· Building defects and
non Australian standard compliant
· Roadside Barrier
defects and non Australian Standard compliant
Council has not yet completed a building and roadside
barrier condition assessment. The buildings inspections requires an
external specialised consultant to complete and this is planned for 2018/19
year. The roadside barriers can be completed with council staff who have
been specifically trained, but with the very high number of roadside barriers
(423 at present), this will take some considerable time.
For the maintenance and capital renewal of the high risk
assets Council has developed a detailed risk matrix register to determine the
order of priority. This risk register resides in the Authority Asset
Register. The High Risk Asset (Risk Matrix) is identified in Section 6 of
Risk Management Procedure (E2015/23531). These Risk Matrixes not only
take current asset condition into consideration, but also many other
environmental and social factors that have an impact on that particular asset.
The prioritised Risk Matrix calculations for our highest
risk assets can be found in Council’s electronic document management
system (TRIM):
· Risk Matrix for
Rural Major Culverts (E2016/85145)
· Risk Matrix for
Rural Causeways (E2016/85152)
· Risk Matrix for
Bridges (E2016/85259)
· Risk Matrix for
Retaining Walls (E2016/85260)
Council uses Assetic Predictor© modelling software to
enable transparent risk management decision making in regards to sealed roads
and bridge repair treatments.
There is no industry standard way to prioritise asset
classes against each other, other than use experienced judgement on the risk
matrix of likelihood and consequence. The prime consideration is
likelihood of fatality or injury.
On the next page is a table and figure of the current
spend and calculated financial gap additional to the predictor modelling.
Table 1 Financial Gaps additional to Predictor modelling
|
Asset Sub-type
|
Current Spend
2016/17
|
Gap
|
Required
Budget
|
|
|
CAPITAL
RENEWAL
|
|
|
|
|
|
Stormwater
/ Drainage Capital Causeways & Major Culverts
|
$677,020
|
$7,700,000
|
$8,377,020
|
|
|
(Reflect™
outstanding defects)
|
|
|
Road
Capital Reseals
Note: (TABLE 15 TAMP)
|
$1,800,000
|
$2,000,000
|
$3,800,000
|
|
|
|
Road
Capital Reconstruction
Note:
(TABLE 15 TAMP)
(Not
including new assets)
|
$5,828,701
|
$1,681,820
|
$7,510,521
|
|
|
Roads
|
$3,542,797
|
$2,290,625
|
$5,833,422
|
|
|
(Work Orders
Roads)
|
(Reflect™
outstanding defects)
|
|
|
Stormwater
|
$611,908
|
$616,139
|
$1,228,047
|
|
|
(Work Orders SW)
|
(Reflect™
outstanding defects)
|
|
|
Buildings
|
$1,555,676
|
UNKNOWN
|
UNKNOWN
|
|
|
Roadside
Barriers
|
$9,132
|
UNKNOWN
|
UNKNOWN
|
|
|
TOTAL
RENEWAL AND MAINTENANCE
|
$14,025,234
|
$14,288,584
|
$26,749,010
|
|
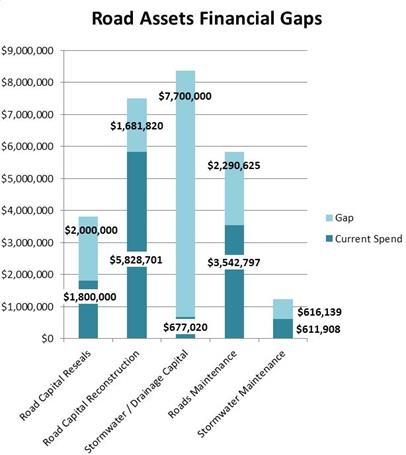
Figure 1: Road Asset Financial Gaps
It can be seen there is a
major funding gap pertaining to the timely renewal of rural causeways and major
culverts. Council has already experienced collapse in these assets as per
Figure 2. Further examples of high risk causeways and culverts are demonstrated
from Figure 3 to 7. It is recommended that the balance of the loan funds
previously anticipated for Bridge Renewal now be committed over the coming
financial years to the renewal of high risk Rural Causeways and Major Culverts.
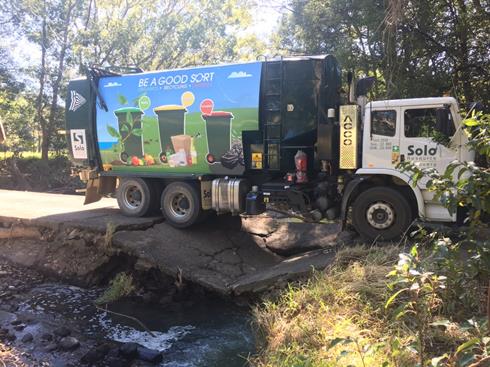
Figure 2: Durrumbal causeway
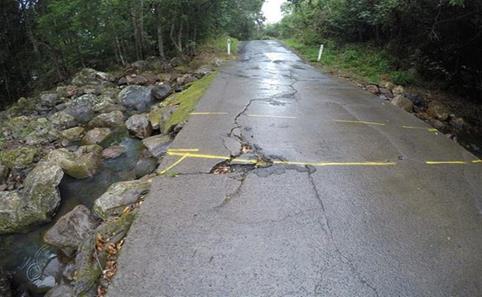
Figure 3: Left Bank Road # 2
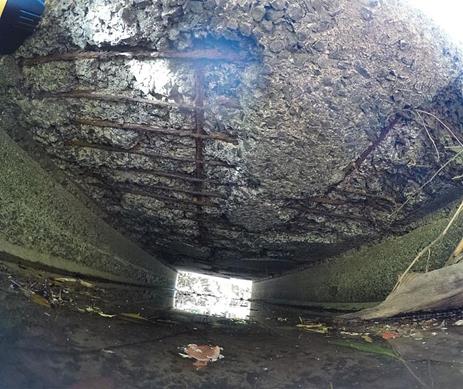
Figure 4: Main Arm Road # 14 - Major deterioration beneath
slab of box culvert - spalling & delamination (temp steel plate on roadway
has been installed)
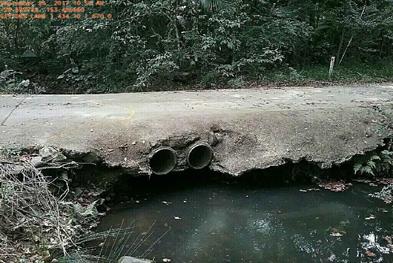
Figure 5: Gittoes Lane - 100% causeway width undermined.
Water flow under causeway and not through pipes.
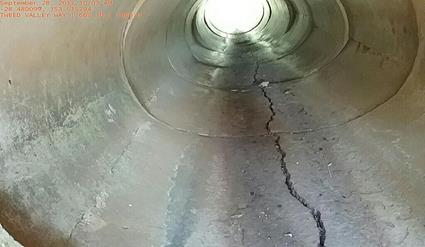
Figure 6: Tweed Valley Way - Pipes severely deformed, this
is impacting roadway above.
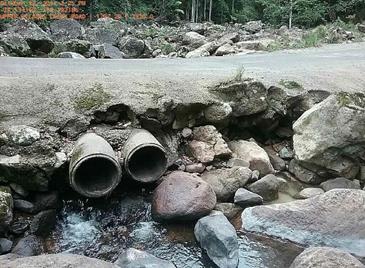
Figure 7: Upper Wilsons Creek # 09 - 100% causeway width
undermined. Water flow under causeway and not through pipes.
There are many more examples.
Financial Implications
Financial implications have
been detailed above.
Statutory and Policy Compliance Implications
The information provided is
in accordance with the Asset management Policy of Council.
Staff Reports - Infrastructure Services 4.4
Report No. 4.4 Bike
Plan and PAMP Status Report
Directorate: Infrastructure
Services
Report
Author: Daniel
Strzina, Project Engineer
File No: I2018/358
Theme: Community Infrastructure
Local Roads and Drainage
Summary:
The purpose of this report is to provide to TIAC an update
on the progress of Council’s Pedestrian Access and Mobility Plan (PAMP)
and Bike Strategy and Action Plan (Bike Plan), with the intention that TIAC
recommend that Council proceed with engagement of the preferred specialist
consultant to undertake the work.
|
RECOMMENDATION:
That the
Committee recommend to Council:
1. That
a Communications Plan be developed and reported to the Communications Panel.
2. That
Council:
a) note
the update on the progress of Council’s Pedestrian Access and Mobility
Plan (PAMP) and Bike Strategy and Action Plan (Bike Plan)
b) note
the submissions by preferred consultant, PSA Consulting, in response to
Request for Quotations for the PAMP and Bike Plan works
c) engage
PSA Consulting to develop the Pedestrian Access and Mobility Plan (PAMP) and
review and update the Bike Strategy and Action Plan (Bike Plan)
|
Background
In 2008 Council adopted the Byron Shire Bike Strategy and
Action Plan (Bike Plan) to facilitate the expansion of the existing network of
bicycle facilities in the Byron Shire.
A review of both the PAMP and Bike Plan is required to
ensure that they are current and reflect changes to relevant legislation,
design standards and guidelines. It is also noted that Council’s
PAMP and Bike Plan are used when assessing funding applications for
construction projects.
Report
Actions to date are as follows:
· Funding of $60,000
has been allocated to the development of the PAMP. Funding of $60,000 has
been allocated to the development of the Bike Plan.
· Consultant’s
briefs for the Bike Plan and PAMP were developed from RMS guidelines and issued
to a selection of four (4) suitable consultants by means of a Request for
Quotation.
· Submissions were
received from three (3) consultants and assessed.
Of the three (3) consultants to submit responses to the RFQ:
· Transform
Planning’s PAMP submission was inadequate due to poor community
consultation recommendations and an inability to meet deadlines. They did
not submit a quotation for the Bike Plan work.
· TTM submissions
were considered adequate for both the PAMP and Bike plan works, however their
quotation exceeded budget allocation in both cases.
· PSA Consulting
provided adequate submissions for both the PAMP and Bike Plan works, and
quotations were within the budget allocation in both cases.
The quotations from PSA Consulting were chosen as the
preferred submissions for both the PAMP and Bike Plan due to:
· Clear
demonstration of a comprehensive understanding of the work
· Demonstrated
experience in the field of active transport planning
· Recent successful
engagement by Council on the Byron Bay to Suffolk Park Cycleway Investigation
· Quotations within
allocated budget
The preferred submissions are included below for review,
with the intent that the Committee recommend that Council engage PSA Consulting
to undertake both scopes of works.
It should be noted that timing and completion of the PAMP
and Bike Plan is dependent on the engagement date, which has yet to be
confirmed, and communications strategy, which will be defined as part of the
works. A revised program for the completion of the works will be
circulated once developed.
|
Pedestrian Access and Mobility Plan (PAMP) Submission
– PSA Consulting
|
|
1. Please
submit a proposed program for carrying out the work, including the proposed
hours of work and working days, and a Gantt chart or similar showing the
major milestones and duration of the project.
|
|
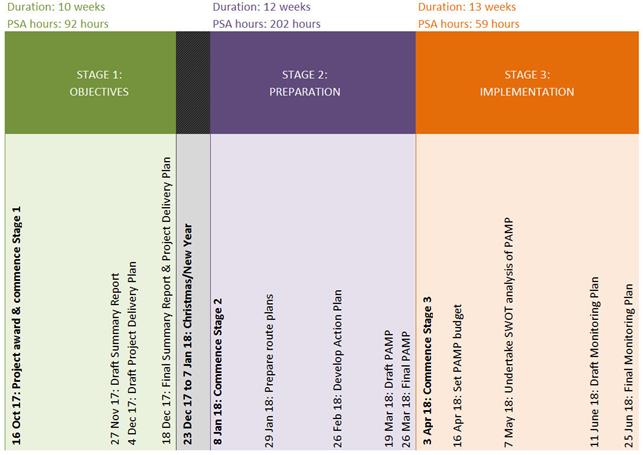
|
|
2. Describe
the proposed methodology and sequence of works to be performed under the
contract.
|
|
The Byron Pedestrian Access and Mobility Plan (PAMP) will
enable Byron Shire Council (BSC) to coordinate and maximise the benefit of
their investment in pedestrian infrastructure and policy to provide safe,
connected and legible pedestrian routes. The PAMP is a collaborative document
developed through partnership between State and Local Government, along with
the community and other local stakeholders. The development of the Byron PAMP
will enable BSC to maximise any future funding grant applications. The Byron
PAMP will be undertaken in three stages as outlined below.
Stage1: Objectives
· Define
objectives - during this task, the team will meet with BSC and discuss the
objectives that the PAMP will be able to meet, the timeline for the PAMP and
any current opportunities within BSC’s funding mechanisms.
· Select most
suitable objectives for Byron – this task will set the focus of the
PAMP to allow the most effective use of funding and resources across the
pedestrian network. These PAMP objectives will then be rated using local
knowledge of BSC staff to ensure that the objectives are able to be measured
following the implementation of the PAMP. PSA propose to use the RMS guiding
objectives and rating system with BSC to rate the objectives.
· Form a PAMP team
– The PAMP team will be developed during Stage 1 to be called upon for
both the preparation and the implementation stages. This team will need to
include a range of council officers, including engineers, town planners and
community planners. PSA as accredited Road Safety Auditors will be able to
provide road safety advice during the preparation of the PAMP to accompany
advice from internal BSC officers. An important consideration of the PAMP
team will be the involvement of the community. It is recommended that a
reference group be created to enable BSC to consult with community groups
such as people with disabilities and any other local groups, dependant on the
relevant objectives to the Byron PAMP. This will involve setting the charter
for the reference group.
Stage2: Preparation
· Define the PAMP
area and undertake research and review – This task will include a
meeting with BSC to discuss the coverage area of the PAMP. Following the definition
of the area, a literature review and research will be undertaken to consider
the existing documentation, including Local, State and Federal Government
policies, standards and plans. This task will also include the collection of
data including existing facilities and their conditions, crash data,
pedestrian and vehicular counts, social and demographic data and public
transport access and utilisation.
· Undertake a site
visit to review existing issues and opportunities – following the
review of existing data, a site visit will be undertaken to review the
existing condition and to observe user behaviour. The site visit will be
undertaken at a time of high pedestrian activity around attractors within the
PAMP area.
· Prepare maps of
the study area – Following the site visit, a range of maps will be
plotted to demonstrate the existing issues, opportunities, attractors and
visually represent the data already analysed.
· Develop PAMP
Routes – this task will take into account the data analysed and the
insight gained during the site observations including the issues /
constraints, the opportunities, the pedestrian generators and attractors and
the design standards required for each user group. PAMP routes will be
visually represented to provide functional routes and facilities for safe and
efficient pedestrian connectivity within the defined PAMP area.
· Prepare and
undertake community consultation – following the drafting of the PAMP
routes, community consultation will be undertaken. It is recommended that this
be undertaken through reference groups to allow discussion groups and public
exhibition of the Draft PAMP in the local newspapers, libraries and online on
BSC’s website. PSA have also included provision to attend two (2)
community consultation workshops to facilitate discussion and gain feedback
on the Draft PAMP.
· Audit the routes
– following the community consultation, audits will be undertaken to
determine the scale of work required along each designated route. These
audits are proposed to be undertaken by PSA staff with Road Safety Auditing
experience. The PSA team would welcome input from relevant BSC officers for
these route audits.
· Develop an
Action Plan – following both the community consultation and feedback
and the audits of the routes, the PSA team will develop an Action Plan and
works schedule to allow BSC to implement the PAMP. This will be a prioritised
list of actions which have an allocated funding source. The Action Plan will
not only include infrastructure works, but also policy works required to
address pedestrian mobility and accessibility within the PAMP area.
· Promote the PAMP
– Following the development of the Action Plan, the PSA Project team
will develop a report for release to the community as a second round of
community consultation. This will include a public display of the PAMP in BSC
libraries and on BSC’s website. This will allow the community to
provide any feedback. The PSA team, through consultation with the BSC team
will incorporate any appropriate feedback in an updated finalised PAMP.
· Finalise the
PAMP – the finalised PAMP will include a report, drawings of the PAMP
routes, appendices of the staging and action plan and maps and supporting
documentation, including community feedback.
Stage3: Implementation
· Set budget for
the PAMP – following the finalisation of the PAMP, the PSA project team
will identify funding opportunities for each of the actions in the plan.
These could include grant funding through state and federal government
sources, developers, and local community clubs and groups. The identification
of funding sources will enable PSA to work with BSC to set a realistic annual
council budget to contribute to the implementation of the priority measures
of the PAMP.
· Monitor the PAMP
– the PSA team will establish a regime for monitoring the PAMP, which
will include a record and database management of works complete, regular
collection of data to evaluate and monitor objectives and future periodic
updates of the PAMP.
· Undertake a SWOT
Analysis – to allow continuous improvement of the PAMP, a Strengths /
Weaknesses & Opportunities / Threats (SWOT) analysis will be undertaken
to score the PAMP against its original objectives.
· Determine the
Quality of the PAMP – an RMS rating will be provided on the PAMP, with
this rating calculation preparation to be undertaken by PSA.
|
|
3. Provide
details of all personnel who will be nominated to work on the project.
|
|
Staff member name
|
Position held
|
Role on the project
|
Qualifications and experience
|
% of time on the project
|
|
Hannah Richardson
|
Director, Traffic &
Transport Engineer
|
Project Director
Reviewing analysis,
providing input into development of PAMP routes, community consultation.
|
Bachelor Engineering (RPEQ,
CPEng)
Graduate Diploma
Urban and Regional Planning Project
Director
Over 10 years of Traffic
Engineering and Transport Planning, including over two years experience as
Coordinator, Traffic & Transport for Sunshine Coast Council with
responsibilities for concept through to detailed planning of cycleways for
the Sunshine Coast Local Government Area.
|
20%
|
|
Aaron
Donges
|
Senior Transport Planner
|
Project Manager
Development of PAMP, undertaking audits, community
consultation and data analysis.
|
Bachelor Urban Development
Aaron has over six years of experience which includes
the management of a range of projects and involvement in a number of large,
multi-disciplinary projects as the traffic and transport lead.
Aaron has undertaken area transport strategies,
pedestrian and cyclist studies, travel demand management studies,
multimodal accessibility studies, a city-wide bus network review and
redesign project, and many more.
|
40%
|
|
Tim Boxall
|
Traffic and Transport Engineer
|
Traffic Engineer
Developing Maps, undertaking audits as an experienced
road safety auditor, undertaking analysis of data for the PAMP Routes
|
Bachelor Engineering (Civil)
Tim is a graduate from the Queensland University of
Technology with first class honours in Civil Engineering. Since graduation,
Tim has quickly acquired knowledge of traffic engineering practices
including traffic impact assessments, car parking studies and transport
modelling. Tim is the current QLD recipient of the AITPM Young
Professionals Award.
|
40%
|
|
|
4. Provide
details of recent contracts (within the last two years) that demonstrate
expertise application to the services required.
|
|
Company Name
|
Sunshine Coast Council
|
City of Gold Coast
|
Brisbane Airport Corporation
|
|
Contact name, phone, email
|
Rodney Zinn
(07) 5420 8004
rodney.zinn@sunshinecoast.qld.gov.au
|
Casandra Smith
(07) 5582 9079
clsmith@goldcoast.qld.gov.au
|
Chris Slattery
(07)3406 3050
chris.slattery@bne.com.au
|
|
Description of services provided
|
In 2017 Sunshine Coast Council plan installed
‘smart bollards’ to manage traffic during street closures as a
part of a streetscaping upgrade project. The ‘smart bollards’
are proposed to be automatic bollards and the aim is to reduce the
requirement for external traffic management companies to be present for
recurring street closures for markets and other events. The project sparked
a need for guidance on traffic management measures pertaining to the
bollard sensor system, the signage requirements (location, height, wording,
sequencing and duration of display), sequencing of bollard motion and
management of vehicle entry / exit to the enclosed area (including for
emergency vehicles).
|
PSA are in the process of developing a City Freight Plan
for the City of Gold Coast. The City Freight Plan project will develop a
long-term strategic plan to ensure Council can appropriately respond to the
challenges of managing and supporting freight as part of a multi- modal
transport system. It will provide an understanding of the economic
contribution freight makes to the City’s economy. The Plan will
establish a fine grained freight network hierarchy and propose series of
actions that will be consistent with and build on the GC2018 initiatives.
|
PSA Consulting (Australia) was engaged by the Brisbane
Airport Corporation to provide traffic engineering advice in relation to
the provision of a safe and cost effective design solution for the
provision of cycling facilities on Airport Drive.
|
|
Date project completed
|
July 2016 – June 2017
|
April 2017 – October 2017
|
May 2017 – August 2017
|
|
|
5. Please
attach the following documents to your quote:
RCertificate of Currency for Workers
Compensation Insurance
RCertificate of Currency for Public
Liability Insurance - $10,000,000
RProfessional Indemnity Insurance -
$5,000,000
|
|
6. Please
provide any further information that is applicable to the provision of the
goods/services.
|
|
This fee is exclusive of vehicle and pedestrian counts,
pedestrian origin-destination surveys and existing footpath condition audits.
Following the definition of the study area, the costs of these will be
estimated, based on the defined objectives of the PAMP.
|
|
7. Please
complete the pricing schedule below and describe any additional charges that
apply
|
|
Item Description
|
Amount (ex GST)
|
Amount (inc GST)
|
|
Stage 1 – Objectives
|
$14,760
|
$16,236
|
|
Stage 2 – Preparation
|
$29,950
|
$32,945
|
|
Stage 3 – Implementation
|
$9,970
|
$10,967
|
|
Total of quotation:
|
$54,680
|
$60,148
|
Note that prices must include all overheads, profit and
other expenses that the successful proponent may incur in relation to the
supply of the services.
Please describe any additional charges that apply:
This fee is exclusive of vehicle and pedestrian counts,
pedestrian origin-destination surveys and existing footpath condition audits.
Following the definition of the study area, the costs of these will be
estimated, based on the defined objectives of the PAMP.
|
|
Bike Strategy and Action Plan (Bike Plan) Submission
– PSA Consulting
|
|
1. Please
submit a proposed program for carrying out the work, including the proposed
hours of work and working days, and a Gantt chart or similar showing the
major milestones and duration of the project.
|
|
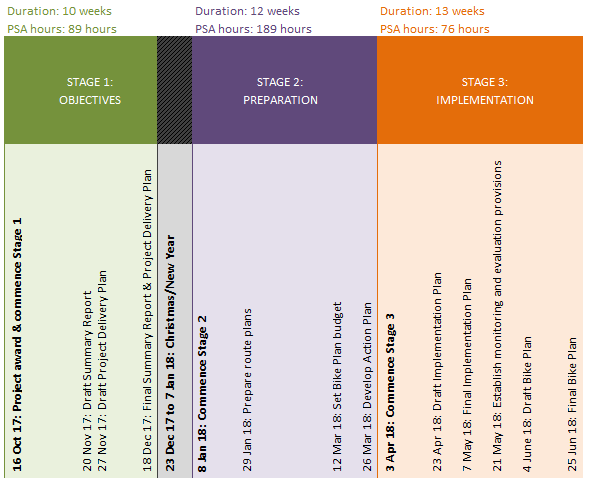
|
|
2. Describe
the proposed methodology and sequence of works to be performed under the
contract.
|
|
The Byron Bike Plan will enable Byron Shire Council (BSC)
to coordinate and maximise the benefit of their investment in cycling
infrastructure, policy and promotional programs to provide safe, connected
and legible cycling routes. The development of the Byron Bike Plan will
enable BSC to maximise any future funding grant applications. The Byron Bike
Plan will be undertaken in three stages as outlined below.
Stage 1: Objectives
· Review existing
planning and delivery documents – this will involve a review of all
existing documentation, policies, standards, relevant local, state and
federal government planning mechanisms and a review of the land use planning
context
· Define
objectives - during this task, the team will meet with BSC and discuss the
objectives that the Bike Plan will be able to meet, the timeline for the Bike
Plan and any current opportunities within BSC’s funding mechanisms.
· Select most
suitable objectives for Byron – this task will set the focus of the
Bike Plan to allow the most effective use of funding and resources across the
cycle network. These objectives will then be assessed to ensure they are
measurable and unambiguous.
· Form a team and
develop a project delivery plan – The PSA Project team will form a team
and identify a stakeholder management/communication plan for use throughout
the development of the Bike Plan in the preparation and the implementation
stages. This will need to include a range of BSC officers, including
engineers, town planners and community planners. PSA as accredited Road
Safety Auditors, with experience in active transport planning for councils,
will be able to provide road safety advice during the preparation of the Bike
Plan to accompany advice from internal council officers. An important
consideration of the Bike Plan consultation will be the involvement of the
community. It is recommended that a reference group be created to enable BSC
to consult with community groups such as local bicycle user groups (BUGs) and
any other local groups, dependant on the relevant objectives to the Byron
Bike Plan. This will involve setting the charter for the reference group.
This task will also include an identification of estimated timings and costs
to deliver the project
· Define area and
undertake research and review – This task will include a meeting with
BSC to discuss the coverage area of the Bike Plan. Following the definition
of the area, a literature review and research will be undertaken to consider
the existing documentation, including Local, State and Federal Government
policies, standards and plans. This task will include the collection of data
relating to current cycling activities, including demographics, Origin
– Destination Surveys, and behavioural observations. This task will
also include the collection of data including existing facilities and their
conditions, crash data, cyclist and vehicular counts, social and demographic
data, identification of user profiles, and public transport access and
utilisation.
Stage 2: Preparation
· Undertake a site
visit to review existing issues and opportunities – this will include
assessing existing cycling routes and will inform the identification of
proposed new / alternative / upgraded routes and infrastructure. This will be
undertaken by a site visit
· Prepare maps of
the study area and develop routes – Following the site visit, a range
of maps will be plotted to demonstrate the existing issues, opportunities,
attractors and visually represent the data already analysed, along with
demonstrating a proposed network of routes.
· Set priorities
for routes – following the development of the routes, a prioritisation
process will occur to align with the objectives set and to allow a cost
effective implementation. This will include an estimation of the costs and
benefits of the Bike Plan. This will include provision for other facilities,
such as wayfinding signage, mid-trip and end-of-trip facilities.
· Establish
promotional programs – establish a system of promoting cycling and road
safety for cyclists within the area to encourage the uptake of those that are
not currently comfortable cycling due to a perceived threat to their safety.
To complement the promotional campaign, consultation should occur with local
businesses and schools to encourage employer and school programs to increase
cycling mode share for trips to / from work and school.
· Prepare and
undertake community consultation – following the drafting of the Bike
Plan, community consultation will be undertaken. It is recommended that this
be undertaken through reference groups to allow discussion groups and public
exhibition of the Draft Bike Plan in the local newspapers, libraries and
online on BSC’s website. PSA have also included provision to attend two
(2) community consultation workshops to facilitate discussion and gain
feedback on the draft Bike Plan.
· Audit the routes
– following the community consultation, audits will be undertaken to
determine the scale of work required along each designated route. These
audits are proposed to be undertaken by PSA staff with Road Safety Auditing
experience. The PSA Project Team will appreciate any input by relevant BSC
officers in the audits of these routes.
· Set budget for
the Bike Plan –the PSA project team will identify funding opportunities
for each of the proposed cycling routes and behavioural programs. These could
include grant funding through state and federal government sources,
developers, and local community clubs and groups. The identification of
funding sources will enable PSA to work with BSC to set a realistic annual
council budget to contribute to the implementation of the priority measures
of the Bike Plan.
· Develop an
Action Plan – following the community consultation/feedback, the audits
of the routes and the identification of funding opportunities, the PSA team
will develop an Action Plan and works schedule to allow BSC to implement the
Bike Plan. This will be a prioritised list of actions which have an allocated
funding source. The Action Plan will not only include infrastructure works,
but also policy works required to address cyclist mobility and accessibility
within the defined area.
Stage 3 - Implementation
· Develop an
Implementation Plan – following both the development of proposed routes
and behavioural promotional activities, a prioritised implementation plan
will be developed.
· Establish
monitoring and evaluation provisions – The PSA team will establish a
set of steps to enable the monitoring and evaluation and eventual updating of
the Bike Plan, which will include review of the measurement of the objectives
identified during the beginning of the plan development.
· Finalise the
Bike Plan – the finalised Bike Plan will include a report, drawings of
the routes, appendices of the staging and action plan and maps and supporting
documentation for educational and promotional activities, including community
feedback.
|
|
3. Provide
details of all personnel who will be nominated to work on the project.
|
|
Staff member name
|
Position held
|
Role on the project
|
Qualifications and experience
|
% of time on the project
|
|
Hannah Richardson
|
Director, Traffic &
Transport Engineer
|
Project Director
Reviewing analysis,
providing input into development of PAMP routes and promotional and
educational programs, community consultation.
|
Bachelor Engineering (RPEQ,
CPEng)
Graduate Diploma
Urban and Regional Planning
Project Director
Over 10 years of Traffic
Engineering and Transport Planning, including over two years experience as
Coordinator, Traffic & Transport for Sunshine Coast Council with
responsibilities for concept through to detailed planning of cycleways for
the Sunshine Coast Local Government Area.
|
20%
|
|
Aaron
Donges
|
Senior Transport Planner
|
Project Manager
Development of Bike Plan, undertaking site inspections,
community consultation and data analysis.
|
Bachelor Urban Development
Aaron has over six years of experience which includes
the management of a range of projects and involvement in a number of large,
multi-disciplinary projects as the traffic and transport lead.
Aaron has undertaken area transport strategies,
pedestrian and cyclist studies, travel demand management studies,
multimodal accessibility studies, a city-wide bus network review and
redesign project, and many more.
|
40%
|
|
Kirstin Palmer
|
Traffic and Transport Engineer
|
Traffic Engineer
Developing Maps, undertaking site investigations as an
experienced road safety auditor, undertaking analysis of data for the Bike
Plan Routes
|
Bachelor Engineering (Civil)
Kirstin is a graduate from the Queensland University of
Technology. Since graduation, Kirstin has quickly acquired knowledge of
traffic engineering practices including traffic impact assessments, car
parking studies and transport modelling. Kirstin has experience in working
in-house with Mackay Regional Council in the design office and will bring
this experience to the project.
|
40%
|
|
|
4. Provide
details of recent contracts (within the last two years) that demonstrate
expertise application to the services required.
|
|
Company Name
|
Sunshine Coast Council
|
City of Gold Coast
|
Brisbane Airport Corporation
|
|
Contact name, phone, email
|
Rodney Zinn
(07) 5420 8004
rodney.zinn@sunshinecoast.qld.gov.au
|
Casandra Smith
(07) 5582 9079
clsmith@goldcoast.qld.gov.au
|
Chris Slattery
(07)3406 3050
chris.slattery@bne.com.au
|
|
Description of services provided
|
In 2017 Sunshine Coast Council plan installed
‘smart bollards’ to manage traffic during street closures as a
part of a streetscaping upgrade project. The ‘smart bollards’
are proposed to be automatic bollards and the aim is to reduce the
requirement for external traffic management companies to be present for
recurring street closures for markets and other events. The project sparked
a need for guidance on traffic management measures pertaining to the
bollard sensor system, the signage requirements (location, height, wording,
sequencing and duration of display), sequencing of bollard motion and
management of vehicle entry / exit to the enclosed area (including for
emergency vehicles).
|
PSA are in the process of developing a City Freight Plan
for the City of Gold Coast. The City Freight Plan project will develop a
long-term strategic plan to ensure Council can appropriately respond to the
challenges of managing and supporting freight as part of a multi- modal
transport system. It will provide an understanding of the economic
contribution freight makes to the City’s economy. The Plan will
establish a fine grained freight network hierarchy and propose series of
actions that will be consistent with and build on the GC2018 initiatives.
|
PSA Consulting (Australia) was engaged by the Brisbane
Airport Corporation to provide traffic engineering advice in relation to
the provision of a safe and cost effective design solution for the
provision of cycling facilities on Airport Drive.
|
|
Date project completed
|
July 2016 – June 2017
|
April 2017 – October 2017
|
May 2017 – August 2017
|
|
|
5. Please
attach the following documents to your quote:
RCertificate of Currency for Workers
Compensation Insurance
RCertificate of Currency for Public
Liability Insurance - $10,000,000
RProfessional Indemnity Insurance -
$5,000,000
|
|
6. Please
provide any further information that is applicable to the provision of the
goods/services.
|
|
This fee does not include the fees involved in surveys of
the current cycling utilisation, demographics or behaviour. An estimate of
this fee will be provided to council during the initial stage, while
developing the extent of the study area for the Bike Plan
|
|
7. Please
complete the pricing schedule below and describe any additional charges that
apply
|
|
Item Description
|
Amount (ex GST)
|
Amount (inc GST)
|
|
Stage 1 – Objectives
|
$13,520
|
$14,872
|
|
Stage 2 – Preparation
|
$28,300
|
$31,130
|
|
Stage 3 – Implementation
|
$11,980
|
$13,178
|
|
Total of quotation:
|
$53,800
|
$59,180
|
Note that prices must include all overheads, profit and
other expenses that the successful proponent may incur in relation to the
supply of the services.
Please describe any additional charges that apply:
This fee does not include the fees involved in surveys of
the current cycling utilisation, demographics or behaviour. An estimate of
this fee will be provided to council during the initial stage, while
developing the extent of the study area for the Bike Plan.
|
Financial Implications
Financial implications are dependent on further reporting to
Council and adoption of recommendations. There are no financial
implications at this point in time.
Statutory and Policy
Compliance Implications
There are no statutory and policy compliance implications at
this point in time.
Staff Reports - Infrastructure Services 4.5
Report No. 4.5 Development
of a Shire-wide Transport Strategy
Directorate: Infrastructure
Services
Report
Author: Tony
Nash, Manager Works
File No: I2018/411
Theme: Community Infrastructure
Local Roads and Drainage
Summary:
Council, at its meeting of 10
October 2016, resolved in support of the 16 August 2016 Transport Advisory
Committee (TrAC) recommendation as follows:
Resolution 16-516
Report No. 5.1 Development of a Shire-wide
Transport Strategy
File No:
I2016/884
Committee Recommendation 5.1.1
1. That
the Committee develop a Shire-wide Transport Strategy which includes:
a) CONTEXT
to include consideration of:
· congestion
· high
tourist numbers
· lack
of local public transport connectivity and regional integration
· high
carbon emissions
· safety
· high
costs of running private vehicles
· road
condition and the cost of maintenance
· demographics
– (difficult for people who can’t drive or don’t have a
licence)
· access
- mobility
· lack
of cycleway connectivity
· lack
of connectivity in general
· poor
location of services – making them more distant than they could otherwise
be
· high
growth area – need to plan for future
· transport
costs to community from planning and commercial decisions
· impact
of future technological and social developments
b) OBJECTIVES
to include consideration of:
· reduce
the need for and/or dependency on private motor vehicle trips
· improve
public transport
· support
community transport
· increase
the bike network and/or use
· improve
pedestrian and residential amenity
· support
advocacy, partnerships and/or community involvement
· improve
road user safety
· improve
integration and regional connectivity
· support
climate change adaptation and mitigation
· further
defining and obtaining of these objectives will be the role of the proposed
transport strategy
· support
of each objective can be sought via relevant Council instruction through
available mechanisms regarding any proposed and/or existing activity, all of
which will be explored via development of the proposed transport strategy that
will be guided by Council’s vision.
c) ACTIONS
to include the consideration of:
· understanding
user experience – feedback, surveys
· develop
priorities from user feedback, eg improve user experience by means of improved
bus shelters, safer road crossings, shorter travel times, for example
· develop
measurement methods for baseline and future actions
· integrated
land use planning
2. That
a draft strategy commence with a review of relevant local, state and
federal programs, plans and strategies in efforts to identify funding and
partnership opportunities.
3. That Council note staff will
apply by 9 September 2016 to meet the RMS Active Transport Funding deadline and
it will include seeking 2017/18 funding for the revision of Council’s
bike plan and PAMP. (Richardson/Hunter)
Since that time there has
been little progress on the development of the strategy and the former
Transport Advisory Committee (TrAC) has been revised into the Transport and
Infrastructure Advisory Committee (TIAC)
This report seeks to
establish a process to move forward with to develop Transport Strategy in
reference to resolution 16-516 as the basis of the framework for the strategy.
There has been no funding
provided yet for the development of a Shire Wide Transport strategy, but
funding of $100,000 has been indicated in 2018/19 as part of Council’s future
Works Program, noting that the program is revised annually and Council only
approves its budget on a year by year basis.
|
RECOMMENDATION:
That the Committee have an extraordinary meeting
in April 2018 to workshop the development a Shire-wide Transport Strategy.
|
Attachments:
1 Policy:
Strategic Transport Statement (Adopted 28/5/09 Res 09-371) (Current_Policies), DM861019 , page 185⇩
Report
The Transport Infrastructure Advisory Committee (TIAC) is a
committee of Council which operates in accordance with its constitution.
A key objective of the constitution is the development of a shire-wide Transport
Strategy.
The most recent report (I2016/884) regarding the strategy
development was tabled at the 16 August 2016 meeting of the previous Transport
Advisory Committee.
That report sought Committee input into the frame work for
the development of the “priority actions”. After much
discussion, the Committee recommended numerous objectives that the strategy
should contain. These objectives were endorsed by Council (Res 16-516, as
per first page).
Previous Proposal on the Development of the Transport
Strategy
The following sections of this report have been extracted
from previous reports to the TrAC (August 2016):-
.
Proposed contents of the
Transport Strategy
The previous direction in terms
of the proposed contents of the Transport Strategy was to divided into primary
and secondary deliverables. They are shown at Table 1 and discussed
further below.
In essence, primary
deliverables take priority; secondary deliverables require third-party funding
or partnership and either are undertaken on the proviso they contribute toward
meeting the stated objectives, which as per Table 2 are redefined as either a
principle or measure.
Table 1: Deliverables
|
Primary deliverables
|
Secondary
deliverables
|
|
Walking and cycling
More off-road shared paths/connections More on-road bike lanes, bike
parking
More footpaths, kerb ramps
Less missing links / network gaps
Improved network/way finding signage
Public transport
More bus shelters
Increased DDA compliance
Funding
Greater third-party and Council funding
Partnerships
Road safety
Road safety program / road upgrades
Transport / Traffic Planning
Traffic management / network review Planned road / intersection upgrades
Parking studies/management
Local Area Traffic Management Plans
|
Secondary deliverables are either complementary to primary deliverables, or
can be provided by third-parties either directly or in partnership.
Therefore Council involvement in them should be
limited, or on proviso of third-party funding contribution and delivery. For
example:
- direct or indirect partnerships
- provision of public and community transport
information and/or services
- online resources / smart-phone applications e.g.
timetables, rideshare, carpool, etc.
- other ‘soft’ infrastructure (e.g.
telecommuting)
- provision of facilities on private or crown
land/property, e.g. bike parking, signage, etc.
|
Primary deliverables
Primary deliverables are to be
limited to typical transport modes of walking, cycling, pubic transport and
road safety/road upgrades, plus undertaking traffic management / network
reviews (i.e. planning) to help determine future projects and priorities, for
example to assist with town centre and master planning.
As parking management is key to
town centre and travel demand management, the parking studies (as currently
being undertaken) should both inform and be considered in the context of
Transport Strategy deliverables as well.
These primary deliverables
provide measurable, quantifiable outcomes and often have a distinct purpose as
defined at time of project conception or brief, e.g. a parking or network
study, a road safety project, etc. and just as often require ‘hard’
infrastructure, such as paths, shelters, seating, road upgrades, etc.
Importantly, such capital works
are a primary responsibility of local government which Council fund and include
annually in the capital works program. The Transport Strategy (once
adopted) would influence such a program.
Thus in summary primary
deliverables namely include existing and traditional undertakings of Council.
Their inclusion in the Transport Strategy (once completed) is not to recreate
or redo such work but ensure such undertakings align with Council goals and
objectives.
Secondary deliverables
The secondary deliverables are
more intangible, or ‘soft’ infrastructure, such as behavioural
programs/promotions (e.g. surveys, information days) or online resources, maps,
timetables, ride share apps, etc.
These however are often sought
or offered by a third-party or require their funding. Therefore it is
recommended they are clearly understood to be secondary or complementary
projects on the proviso they are delivered either by a third-party directly or
via third-party funding.
Nevertheless, primary or
secondary projects would need to meet the endorsed objectives, plus be
consistent with Council’s adopted transport policy, before they are
considered; and even then there needs to be a process of understanding how to
prioritise the numerous projects expected to be contained within the strategy.
Prioritising and aligning
projects
The Transport Strategy will
(once adopted) compete against other Council projects for funding. To improve
chances of funding would be to align it with other key documents and goals of
Council, for example the Community Strategic Plan, plus inclusion in the s94
contributions plans. Outside of Council, aligning with state and federal
government objectives, such as the TfNSW Northern Rivers Regional Transport
Plan and the Regional Development Australia (RDA) and its funding programs is
required.
Thus it is proposed the next
step of strategy development be a review of relevant local, state and federal
programs and plans in efforts to identify funding and partnership
opportunities. Examples include the RMS Active Transport Program (cycling and
walking funding), TfNSW public transport grants (CPTIGS), state and federal
road safety and infrastructure programs, etc.
Such a review however need not
be limited to public bodies, and as the following highlights there are many
local not-for-profit or even private sector enterprises involved in transport.
Avoid duplication, including
with local transport services and providers
Local efforts to improve
transport options abound. The following are just a few of the more
well-known. They are highlighted here to indicate that Council or its
Transport Strategy need to avoid duplicating efforts where possible and not
attempt a strategy as an elixir to all transport-related woes.
The recent released
‘GoByron’ smart-phone transport application was developed by the
Byron Bay taxi company to make bookings of traditional services plus assist
with ride share. It is a private undertaking and not required Council
involvement. It is available for public use.
The now out-of-print, whole of
Northern Rivers transport guide and timetable was undertaken and completed by
NRSDC with the aid of several Councils and TfNSW contributing toward its costs,
and more recently NRSDC are seeking funds for an online, interactive version
which would further their already available online timetable: http://www.goingplaces.org.au/
Similarly, the Northern Rivers
car pool (http://www.nrcarpool.org/)
is a third-party project supported by various organisations and which (as of 9
August) had 3,912 registered members who are able to connect as either rider or
driver.
In regard to public transport,
a beach front private development is progressing its proposal to provide a park
and ride rail-shuttle service between Byron Bay and 3km west of it at Bayshore
Drive. If this is achieved it will replicate Council’s own trial (albeit
on bus).
Such private or community
enterprise efforts are in addition to traditional providers, such as the public
and school transport services provided by TfNSW licensed operators who are
contracted to provide such passenger services. In addition there is also
various community transport options within the shire and across the region, for
example the Tweed Byron Ballina service (http://community-transport.org.au/).
While these examples are
transport specific, it should also be noted other third-parties are also
attempting to address either transport disadvantage or the strategy objectives
themselves. Identifying who these parties are not only avoids duplication of
efforts or resources but also offers an opportunity for partnership, sharing of
resources and knowledge and potentially garnering third-party funding.
Align objectives and
deliverables with the funding and work of others
A case in point is
Council’s “facilitation” role of the Beyond Zero Emissions (http://bze.org.au)
led project entitled “Zero Emissions Byron” (ZEB, https://zerobyron.org/).
Recently this third-party project released a baseline report estimating that
half of Byron shire emissions are due to energy consumption, while transport
was estimated as “the next biggest contributor, accounting for just over
one-third of emissions”, to which the ZEB transport working group
suggests be mitigated via:
…encouraging cycling by
extending the network of (cycle) lanes, improving local bus services,
re-establishing the local railway line for use by trams or other on-car
transport, and promoting car share schemes and electric vehicles.
Source: http://reneweconomy.com.au/2016/byron-bay-maps-path-zero-emissions-2025
Accessed 9 August 2016
This, like the ZEB project
end-goal of 100% renewable energy and zero emissions by 2025, is ambitious, and
even more so if government support does not materialise. However, given it is a
shire transport matter, and that a member of the ZEB Transport working group is
also a member of TrAC, plus the project reflects one of the Committee’s
own (now Council endorsed) objective of reducing emissions, the wider committee
need to consider what is realistic for Council and the Transport Strategy in
regard to contributing toward this end-goal.
Assuming however the ZEB
working group suggestions are supported, questions then arise of how much
cycling, bus patronage, use of rail-line and uptake of rideshare and electric
vehicles is required to help reduce transport emissions, if not to zero by 2025
(which is considered unfeasible) but at very least to below current
levels?
While such a question can not
be answered at this time, and would be subject of a Transport Strategy proper,
it does highlight some immediate concerns.
Firstly, and clearly, not all
is within Council or even state government authority or capability, and without
a pragmatic approach being adhered the strategy has the very real potential of
being impractical and unachievable.
Secondly, objectives while
grand and visionary, do still need grounding (e.g. base data, resources,
planning).
Thirdly, some of the adopted
objectives are more akin to an overarching principle (e.g. reduce emissions)
than a specific goal (e.g. more bike paths) or general measure (e.g. increased
efficiencies, reduced costs).
These first two concerns have
been discussed prior and can be avoided, namely that the Transport Strategy
remain focused on deliverables, not specific or pet projects, and the primary
aim being transport infrastructure.
Doing so would address the
third point; i.e. identify and ensure objectives are clear, quantifiable and
produce an outcome (e.g. a specific measure, xxkm of shared path built); and
that those outcomes are consistent with the overarching principles of the
strategy (e.g. contribution toward reducing emissions) and are measureable
(e.g. improving access, sustainable, etc.).
Such an approach has been
attempted at Table 2 which proposes which of the endorsed objectives are
considered as an overarching principle and a general measure, both of which
would apply to prioritising projects which once delivered provides a
quantifiable outcome.
This process is depicted at
Figure 1 which also shows the proposed development of the Transport Strategy
and the separate development of projects.
Table
2: adopted objectives – principles and measures
|
Objectives as:
|
Outcomes
(i.e. specific measures)
|
|
Overarching principles
|
General measures
|
|
a) the desire to move toward zero emissions
b) telecommunications
f) the ‘measuring’ of outcomesà
h) sustainability
j) feasibility
l) renewable energy (and recycled or zero or low
emission resources)
|
c) access issues
d) improvement of public transport
e) addressing inter town gaps
g) efficiency and costs
i) quadruple bottom line assessment
k) anticipation and acknowledgement of land use and
corridor analysis
|
xxkm of more:
- paths
- bike lanes
- PT services
Increased number of:
- bus shelters
- DDA compliance
- PT patrons
- cyclists
- walking
- car pooling/ride sharing
- seats
- shading
- water bubblers/taps
- toilets
- bike parking
Reduce:
- transport emissions
- vehicle numbers
- vehicle trips
|
Figure
1: proposed framework - separation of strategy and project development
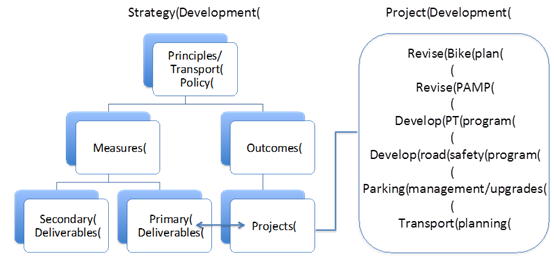
Next steps – review
and report
As suggested above, and
assuming the framework of the strategy development of deliverables, principles,
measures and outcomes is supported, it is proposed the next step is to commence
the strategy itself via a review of relevant local, state and federal programs,
plans and strategies in efforts to identify funding and partnership
opportunities. To this end Committee members’ assistance is sought in
reviewing each of the following:
Active transport
It is recommended the review
commence with cycling and walking, noting RMS provides fund for revision of
bike plans and PAMP. Details of the RMS active transport program is online:
http://www.rms.nsw.gov.au/business-industry/partners-suppliers/lgr/active-transport/index.html
Public transport
TfNSW and their strategies and
goals are online at:
http://www.transport.nsw.gov.au/content/northern-rivers-regional-transport-plan
Other than Byron Bay being
elected as a cycling town, their regional transport plan has little in regard
to specifics.
As for funding, TfNSW manage
the Country Passenger Transport Infrastructure Grant Scheme (CPTIGS). This
offers funding to develop and improve public transport facilities, for example
bus stops and shelters. Details of it are online and liaising with the local public
transport operator is recommended.
http://www.transport.nsw.gov.au/customers/community-transport/community-transport-agreements-programs/cptigs
Road safety
Each year the Federal black
spot program provides funding, as does the RMS via their Safer Roads program
and local government infrastructure funding programs. Submissions are made via
completion of cost estimates and benefit-cost spread sheets. Details are
online:
http://www.rms.nsw.gov.au/business-industry/partners-suppliers/lgr/grant-programs/black-spots.html
Federal funding
Regional Development Australia
(RDA) programs provide federal funds for large projects that can meet their
often economic objectives. Successful projects are those already planned,
designed or even approved. The regional office also has various local demographic
and other information that may assist with developing a Transport Strategy and
aligning its goals with those of the federal government.
http://rdanorthernrivers.org.au/
Partners
The Northern Rivers Regional
Organisation of Councils (NOROC) is the peak representative group for the
Ballina, Byron, Kyogle, Lismore, Richmond Valley and Tweed local government
areas. They have in the past being active in advocating for a regional
transport plan. While they rely on member funding they offer advocacy and
support.
http://noroc.com.au/
The Northern River Social
Development Council (NRSDC) is a strong advocate for transport improvements and
reducing disadvantage. It offers an important partner and knowledge.
http://nrsdc.org.au/
Proposed Way Forward
Current discussion with the Chair of TIAC and staff in
relation to development is that the Transport Strategy is that the previous
framework and resolution may have put an emphasis on a strategy that would
require significant resourcing and development and potentially be at risk of
not meeting the current needs of the Council and community.
Projects/initiatives that feed into an overall strategy
include:-
· Policy 09/004
– Strategic Transport Statement
· Byron Bay Town
Centre Masterplan
· MR525 Study
· Draft Access and
Movement Studies
o Byron Bay
o Mullumbimby
o Bangalow
· PAMP
· Bike Plan
· Multi Use of the
Byron Shire Rail Corridor
· NSW On Demand
Transport EOI
· NSW Autonomous
Transport EOI
A Transport Strategy should be aimed at leading the Council
and setting its strategic direction.
It is recommended that TIAC undertake a separate workshop/extraordinary
meeting to work through the framework and what will be required in developing
the strategy.
Financial Implications
There are no negative implications proposed in the
recommendations of this report.
Statutory and Policy
Compliance Implications
There are no negative implications proposed in the
recommendations of this report.
Staff Reports - Infrastructure Services 4.5 - Attachment 1
BYRON SHIRE COUNCIL
POLICY NO 09/001
STRATEGIC TRANSPORT STATEMENT
(TRANSPORT POLICY)
Staff Reports - Infrastructure Services 4.5 - Attachment 1
INFORMATION
ABOUT THIS DOCUMENT
(INTERNAL USE ONLY)
|
Date Adopted by
Council
|
28 May 2009
|
Resolution No.
|
09-371
|
|
Policy Responsibility
|
Guide development of a
potential Council transport strategy
|
|
Review Timeframe
|
As needed
|
|
Last Review Date:
|
|
Next Scheduled Review
Date
|
|
Document History
|
Doc No.
|
Date Amended
|
Details Comments eg
Resolution No.
|
|
(#PDF 853432)
|
17/6/09
|
To accompany Council
report #862460
|
|
#861019
|
11/6/09
|
Res 09-138, 08-776
|
Further Document
Information and Relationships
|
Related Legislation
|
|
|
Related Policies
|
|
|
Related Procedures/
Protocols, Statements, documents
|
Improving the Town
Centre #179156
|
TABLE OF CONTENTS
1. OBJECTIVES............................................................................................................................... 1
2. POLICY
STATEMENT / VISION................................................................................................. 1
3. TOOLS
FOR IMPLEMENTATION.............................................................................................. 2
4. PARTNERS.................................................................................................................................. 3
5. GLOSSARY.................................................................................................................................. 4
6. ATTACHMENTS.......................................................................................................................... 6
Staff Reports - Infrastructure Services 4.5 - Attachment 1
Policy 09/001
|
POLICY TITLE
|
STRATEGIC
TRANSPORT STATEMENT (TRANSPORT POLICY)
|
|
|
|
|
FILE REFERENCE
|
COR710160
|
NB: For words in italics
see the Glossary at end of document.
1. OBJECTIVES
1.1. reduce
the need for and/or dependency on private motor vehicle trips
1.2. improve
public transport;
1.3. support
community transport;
1.4. increase
the bike network and/or use;
1.5. improve
pedestrian and residential amenity;
1.6. support
advocacy, partnerships and/or community involvement;
1.7. improve
road user safety;
1.8. improve integration
and regional connectivity;
1.9. support climate
change adaptation and mitigation.
Further defining and obtaining of these objectives will be
the role of the proposed transport strategy.
Support of each objective
can be sought via relevant Council instruction through available mechanisms
regarding any proposed and/or existing activity, all of which will be
explored via development of the proposed transport strategy that will be guided
by Council’s vision.
2. POLICY STATEMENT / VISION
In an era of depleting natural
resources, climate change and increasing financial, environmental and community
costs, Byron Shire Council aim is:
To develop and support an
effective, convenient, efficient, equitable and integrated
shire-wide transport network and management approach that improves mobility,
accessibility and choice for all users, especially the
transport disadvantaged, while reducing use of non-renewable energy
and improving sustainability, amenity and opportunities for individual,
community and environmental health, wellbeing and interaction.
This will be achieved by
delivering an integrated and partnership approach of developing,
managing, constructing and/or maintaining all facets of the multi-modal
transport mix to meet the above objectives; the attainment, responsibility and
measurement of which will be subject to the transport strategy and its
subsequent actions.
3. TOOLS FOR IMPLEMENTATION
3.1. Existing
Council have many existing
mechanisms (i.e. tools) to implement actions aimed at meeting the above
objectives. These actions, either existing or future, will be initially
identified and tabled during development of, and updated as needed through, the
transport strategy, which will be an evolving and living (working) document for
Council implementation.
In a transport context however,
most actions fall within and/or influenced by travel or transport demand
management (TDM) techniques which, broadly speaking, has two tools at
its disposal: supply and demand.
Supply tools are a more
traditional approach and typically attempt to manage demand by increasing or
decreasing available infrastructure. Examples include increasing the bike
network and its facilities and use, reducing car parking and developing
alternatives to road transport (e.g. rail).
Supply side techniques is often
the approach of development assessments, devising works programs, etc which
look to assess impacts (in terms of vehicle volumes/growth, safety,
maintenance, cost to benefit, etc) to determine needs (e.g. parking, traffic
management, road space, facilities etc). Examples of existing supply techniques
include the following, with others to be identified during the “gaps”
and needs analysis as per resolution 09-138:
- Council
adopted bike plan: which tables an array of needs from off-road paths,
on-road lanes to secure parking and education.
- Proposed
PAMP and car parking studies/reviews: which will be influenced by
development of a transport strategy to ensure an integrated and coordinated
approach is considered with the first step being assessment of existing
infrastructure/supply.
- Disability
and Inclusion Action Plan (DAIP), Youth and Aged Strategies, Cultural and
Events Plans and other Council documents: the influence and direction of
which will be identified during development and evolvement of the transport
strategy.
Demand techniques are tools used
to manage the demand for services and/or facilities and include hard (i.e.
physical) and soft (i.e. behavioural) approaches to effect change. Typically,
physical actions attempt to enforce change, whereas behavioural change is often
voluntary. Examples are as follows.
- Physical:
via use of engineering and enforcement; such as traffic calming
devices, reallocation and/or change of road space/use, the cost, supply and
availability of parking, etc. Specific examples include reduction of parking,
user pays parking, physical barriers to entry or ease of travel, such as entry
threshold treatments, speed humps, one way/no entry, turn bans, etc
- Behavioural:
via education and engagement; attempt to influence or change
people’s habit via voluntary behaviour change, either through formal
programs (e.g. TravelSmart, Council policy, education, walking school bus) or
informal means (e.g. promotion, events, activities like ride to work or school
days, etc). Often such techniques accompany any physical implementation to help
promote and educate change.
3.2. Future
It is envisaged the development
of the transport strategy:
a) will develop and be
based on a sustainable transport hierarchy, an example being Yarra City
Council’s Strategic Transport Statement for inner city Melbourne
(#834889); and
b) identify need for new and/or
changes/modifications to existing mechanisms to implement. These will be
flagged, investigated and reported as appropriate.
4. PARTNERS
Council view partnerships as key
to delivering the vision and meeting the objectives outlined above, especially
as many facets of transport fall outside the traditional sphere of Council
operations, such as public and community transport which are typically state
and/or private concerns.
Council also realise each
potential partner may have different priorities and by engaging each it is
hoped an understanding is struck that will assist all parties in obtaining
respective and common goals.
The following list is not viewed
as exhaustive.
4.1. Residents
Council recognise that residents,
while a small base in relation to the demand placed on, and contributions
toward, transport services and infrastructure, remain a priority as they rely
on the transport network on a daily basis for movement of people and goods.
4.2. Business
/ Commercial
The diversity, accessibility and
feasibility of local business and commercial operations contribute to the
Shire’s economic wellbeing and influence resident and visitor perceptions
of the region, all of which is affected by transport.
4.3. Visitors
and Tourism
The shire is a popular tourist
destination and supports many local business and commercial operations either
directly or indirectly. Some locations are more popular than others. Visitors
and those benefiting from tourism require transport and hence need to be
engaged and contribute in the development of transport and its associated
infrastructure.
4.4. Development
/ Developers
Potential areas for development
will be identified in other documents. Developments can play a significant role
in contributing toward attainment of the stated transport vision and
objectives. How this can occur will be subject for the transport strategy and
its subsequent actions.
4.5. Community
Groups / Events
The shire has many active
community groups and events that require and/or influence transport.
Coordinating the timing and scheduling of events and assisting groups will
assist Council in attaining the stated transport vision and objectives.
4.6. Other
Authorities
At the State level the RTA and
Departments of Transport, Lands, Planning, State Development and Revenue are
the most prevalent. At the Federal level the departments responsible for
infrastructure, roads, region, local government and climate change, including
Australian Greenhouse Office (AGO) are primary candidates.
5. GLOSSARY
For the purposes of this policy words in italics used in
this policy mean the following.
amenity refers to safety,
noise, pollution, etc
activity means a proposal,
project, event, development, activity, festival and the like.
accessibility – includes
access and accessibility as identified in Councils’
Disability Action and Inclusion Plan (#790622) as follows.
accessibility refers to having
features to permit use by people with disabilities. It should be stressed that
the term “accessibility” does not just lend itself to providing
wheelchair access. Accessibility is relative; meaning that different types of
disability require different forms of access.
access refers to the
individual’s ability to use the service, facility, program or activity
provided. Consequently, a service is accessible when it is easy to find out
about; easily understood; easy to get to; easy to use; people who use it feel
they are welcome; people know that they will get the right assistance when they
need it; people are confident that every reasonable effort will be made to
address the customer’s requirements. Good access can be defined as
beneficial not only to people with a disability but a significant proportion of
other people in our community including parents with prams; elderly people with
walking frames or sticks; sporting people with injuries; people with temporary
disabilities, injuries or medical conditions; delivery people with trolleys.
convenient or
convenience refers to ease (or not) of undertaking and/or participating in
an activity and includes a variety of factors to measure. For example in
a transport context factors include choice, reliability, frequency, accessibility,
travel time, location, safety, etc
choice means ability to
choose from various options
dependency means reliance,
due to either habitat, behaviour, conception and/or choice
develop means create, expand,
enlarge, build up, extend, etc
disadvantaged on grounds
of either age (e.g. young or elderly), physical and/or mental health and/or
economic, social and/or cultural status, and/or location (e.g. rural)
efficient or efficiency is
a quantifiable measure that reduces resource use (especially non
renewable energy)
equitable is to make any activity
just and fair and especially to consider the disadvantaged
increase means an
undertaking that produces a quantifiable and/or measurable increase/addition to
existing.
integrated means connected,
coordinated, considered and/or inclusive
instruction means either
requiring, requesting, undertaking and/or encouraging
improve means an
undertaking that produces a quantifiable and/or measurable improvement and/or
addresses a concern, for example choice, options, accessibility, mobility,
services, safety, amenity and/or convenience
mechanism means existing
or future process of Council and/or other authority, either by way of
resolution, by law, law and/or regulation, for example LTC and/or DA approval
process, s138 activity permits, s94 contributions, s96 modifications, state
regulations and/or guidelines, adopted policy and/or procedure, etc.
mobility refers to the
movement of people and/or goods and can generally be measured in terms of convenience.
Mobility is not confined to physical or mental limitations as other
factors, such as age, culture, economic/social status, geographical location,
etc may limit and/or influence a person’s mobility due, for example, to
lack of choice or inability to drive due to age and/or health, etc.
non-renewable energy
refers to any finite energy source based on use of fossil fuels, for example
oil, gas, coal, uranium, etc.
reduce means an
undertaking that produces a quantifiable and/or measurable decrease and/or
addresses a concern regarding choice, options, accessibility, services and/or
convenience
resource can refer to
time, cost, natural resources, pollution, energy (especially non renewable)
and the like
support is any means that
is deemed sufficient to provide, support and/or improve. Examples of support
can include the following, which are neither mutually exclusive nor exhaustive:
· Proximity:
locating in close proximity of existing services, infrastructure, etc;
· Provision:
organising new and/or augmenting existing alternative transport arrangements,
especially where existing services are deemed inadequate (e.g. Blues Festival);
· Promotion: e.g.
via event ticket sales, general and targeted advertising, resident/visitor
information, etc;
· Contribution:
direct or indirect financial contribution toward new and/or existing services
and/or facilities;
· Integration:
timing, resources, impact, etc especially in regard to other projects/activities
sustainability is defined
within Council’s Management Plan as a concept that protects
“environment and communities for now and the future” and
“requires the successful integration and balancing of ecological, social
and economic values”. These three values form the “triple bottom
line” and must be considered in any reporting, decision making and
subsequent action or activity.
transport (as per Council
resolution 08-776) is defined as any possible method of human or goods movement
for the purposes of travelling to and from various locations within or beyond
the Shire, including rail, roads, paths, pedestrian, water craft, mobility aids
(e.g. wheelchairs, skateboards, scooters, gophers, etc).
TDM – according to
the Canadian based Victoria Transport Policy Institute, TDM, which is also
referred to as Mobility Management, is a general term for strategies that
result in more efficient use of transportation resources. More details are
online: http://www.vtpi.org/tdm/index.php
users refers to all
existing and potential transport users who transport themselves, others
and/or goods
6.
ATTACHMENTS
Resolution 08-776
08-776 Resolved:
1. That Council:
a) Note
outstanding resolution 06-334 and the proposal for a transport Project
Reference Group contained in item 12.1.
b) Noting
outstanding resolution 06-333 and subject to consideration by the Strategic
Planning and Policy Review Committees, develop a whole of shire transport
strategy and receive further advice as to the necessary level of funding to
complete a transport study that informs an integrated transport plan for the
Shire as it connects with regional transport networks.
c) Receive
a progress report in March 2009 on item 2 above including the scope and
relevance of previous research (eg 'Transport Management Strategy, project
scope document' #589880).
2. That
in this resolution transport is defined as any possible method of human
movement for the purposes of travelling to and from various locations within or
beyond the Shire, including rail, roads, paths, pedestrian, water craft,
mobility aids (eg wheelchairs, skateboards, scooters).
3. That
core community concerns requiring consideration of specific actions in the
development of a low carbon polluting transport network as part of a
financially, ecologically and socially sustainable transport strategy include:
a) a
reduction in road traffic levels and congestion through the expansion of an
alternative transport network throughout the shire
b) improved
safety and residential amenity resulting from reduced road traffic
c) improved
public transport services that connect with regional public transport networks
d) expansion
of alternative and public transport network to hinterland areas to ensure that
rural and village amenity are enhanced
e) increased
rate of cycleway and alternative transport network development
f) light
rail solutions, particularly in and around Byron Bay (eg town tram service)
g) park
and ride facilities as a key part of tourism management
h) need
for high level of integration between tourism and transport management,
including how to encourage tourists to visit and move around the shire by
alternative or public transport.
4. That
should funding be necessary for projects referred to in item 1, it is to be
sourced from any savings made from existing actions and projects made
superfluous by this resolution or in the alternative from General Reserve
funds.