BYRON SHIRE COUNCIL
Late Reports 14.1
Supplementary Report to ITEM 13.10
Report No. 17.1 Draft 2017/18 Financial Statements
Directorate: Corporate and Community Services
Report Author: James Brickley, Acting Director Corporate and Community Services
File No: I2018/1952
Theme: Corporate Management
Financial Services
Summary:
The Draft 2017/2018 Financial Statements have been prepared and been subjected to external audit. This report recommends to Council the adoption of the Draft 2017/2018 Financial Statements and the completion of the statutory steps outlined in Section 418 to 420 of the Local Government Act 1993.
The External Auditor, being the NSW Auditor General (represented by a Director of Financial Audit from the NSW Audit Office) and their representative firm Thomas Noble and Russell have been invited to this Ordinary Council Meeting, to present on the Draft 2017/2018 Financial Statements, and answer any questions from Councillors on the Financial Statements.
|
RECOMMENDATION: 1. That Council adopt the Draft 2017/2018 Financial Statements incorporating the General Purpose Financial Statements, Special Purpose Financial Statements and Special Schedules.
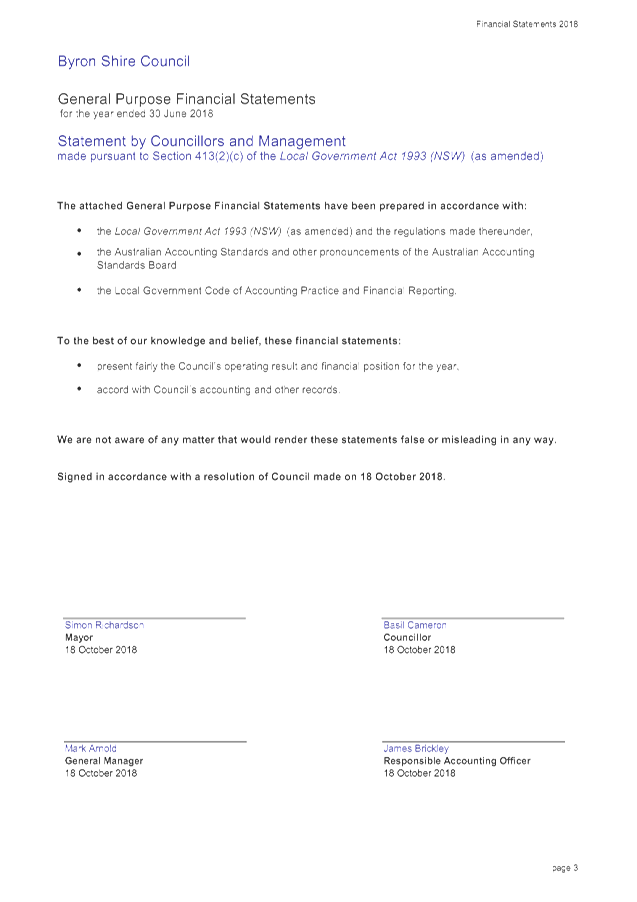
2. That Council approve the signing of the “Statement by Councillors and Management” in accordance with Section 413(2)(c) of the Local Government Act 1993 and Clause 215 of the Local Government (General) Regulation 2005 in relation to the 2017/2018 Draft Financial Statements.
3. That Council exhibit the Financial Statements and Auditor’s Report and call for public submissions on those documents with submissions closing on 30 November 2018 in accordance with Section 420 of the Local Government Act 1993.
4. That the Audited Financial Statements and Auditors Report be presented to the public at the Ordinary Meeting of Council scheduled for 22 November 2018 in accordance with Section 418(1) of the Local Government Act 1993. |
1 Draft
General Purpose Financial Statements 30 June 2018, E2018/82530 , page 6⇩ ![]()
2 Draft
Special Purpose Financial Reports 30 June 2018, E2018/82531 , page 6⇩ ![]()
3 Draft
Special Schedules 30 June 2018, E2018/82532
, page 6⇩ ![]()
4 Byron
Shire Council Conduct of the Audit Report 2018, E2018/82610 , page 6⇩ ![]()
Report
The purpose of this report is to recommend the adoption and exhibition of the Financial Statements for the year ended 30 June 2018. The Financial Statements presented to Council for the financial year ended 30 June 2018 (refer to Attachments 1 to 4) are the final audited results and includes the Auditor’s Report. Council has received an unmodified audit opinion for the 2017/2018 financial year.
The Draft 2017/2018 Financial Statements were to be considered by the Audit, Risk and Improvement Committee on 11 October 2018 but as the audit was not finalised by this date the Meeting was cancelled. The Audit, Risk and Improvement Committee is meeting on 15 November 2018 where consideration will be given to the Financial Statements prior to Council presenting the Financial Statements to the public at the Meeting to be held on 22 November 2018.
The External Auditor, being the NSW Auditor General represented by their representative firm Thomas Noble and Russell have been invited to this Ordinary Council Meeting, to present on the Draft 2017/2018 Financial Statements, and answer any questions from Councillors on the Financial Statements.
The Financial Statements and Auditor’s Reports are a statutory requirement and provide information on the financial performance of Council over the previous twelve-month period.
The Draft 2017/2018 Financial Statements provided in the attachments are broken down into three sections being;
- General Purpose Financial Statements – Attachment 1
- Special Purpose Financial Statements – Attachment 2
- Special Schedules – Attachment 3
Brief explanations for each of these items are as follows.
General Purpose Financial
Statements
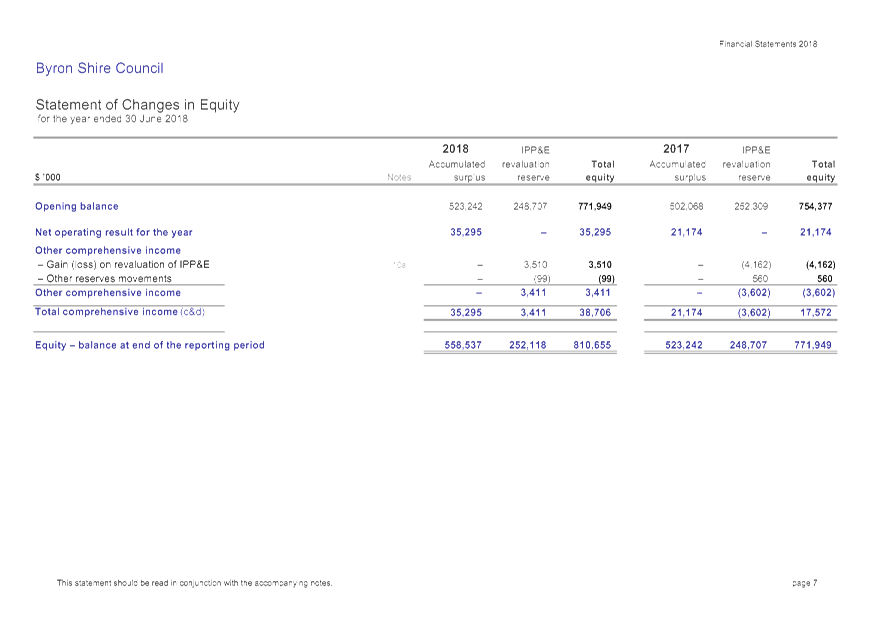
These Statements provide an overview of the operating result, financial position,
changes in equity and cash flow movement of Council as at 30 June 2018 on a
consolidated basis with internal transactions between Council’s General,
Water and Sewerage Funds eliminated. The notes included within these reports
provide details of major items of income and expenditure with comparisons to
the previous financial year. The notes also highlight the cash position of
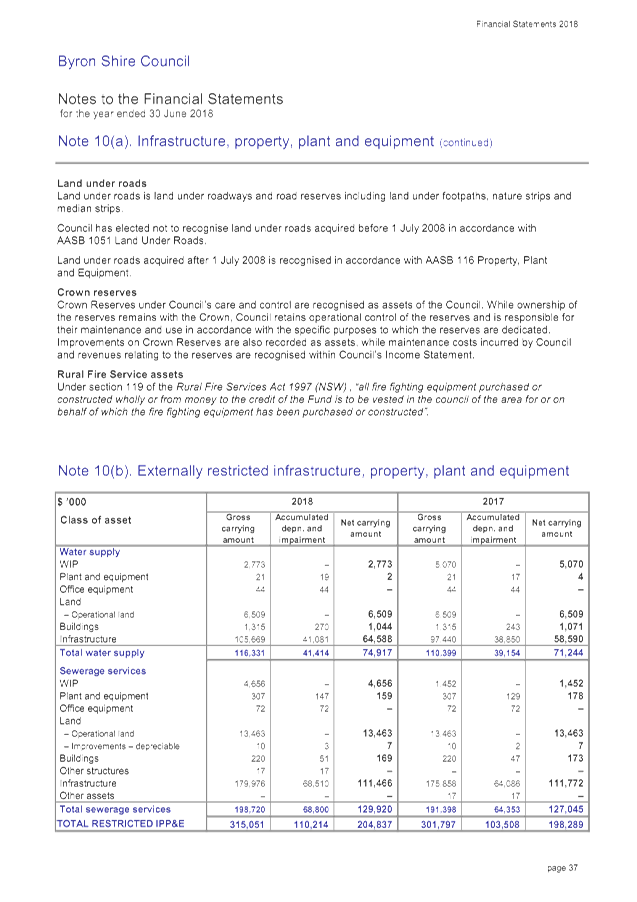
Council and indicate which funds are externally restricted (i.e. may be used
for a specific purpose only), and those that may be used at Council’s
discretion.
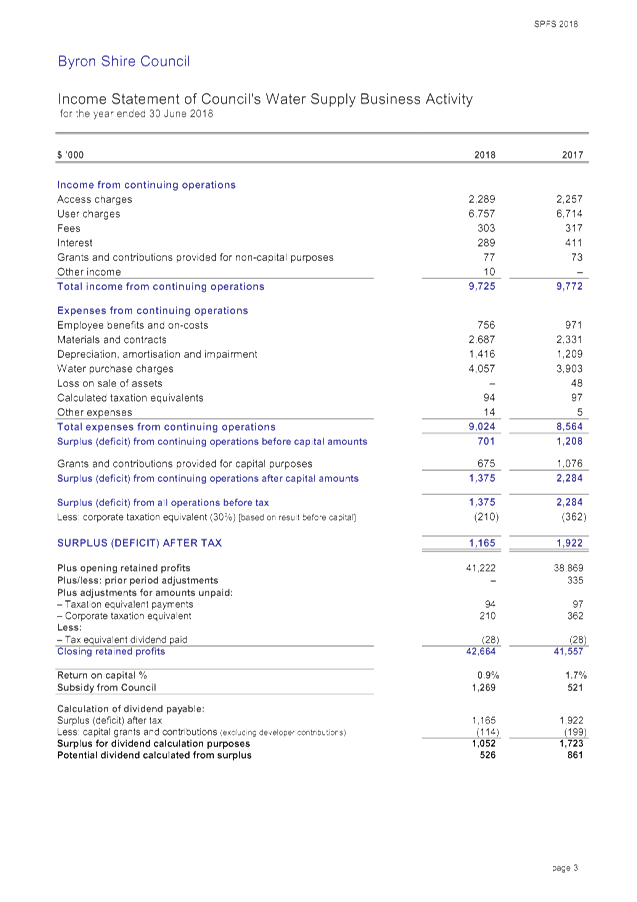
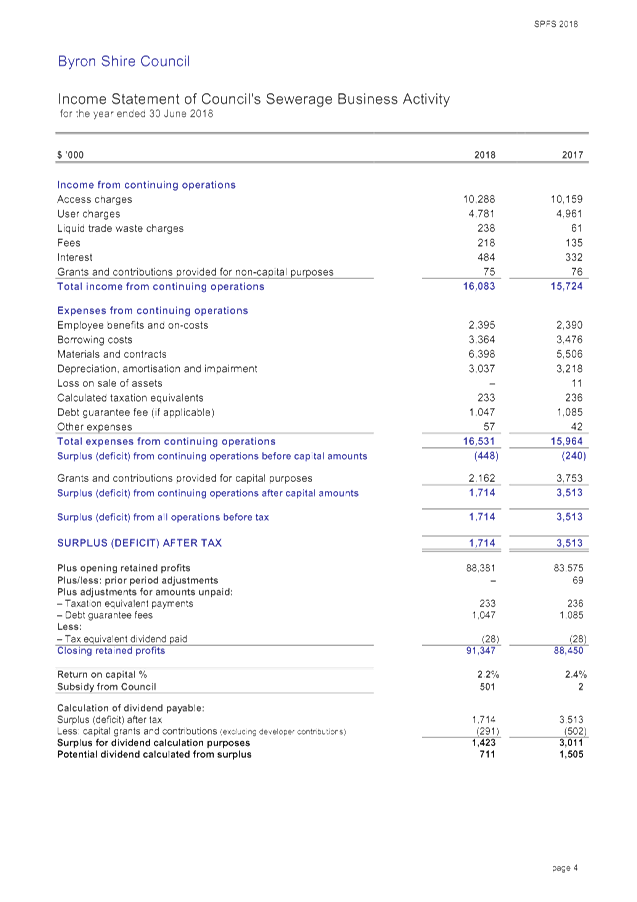
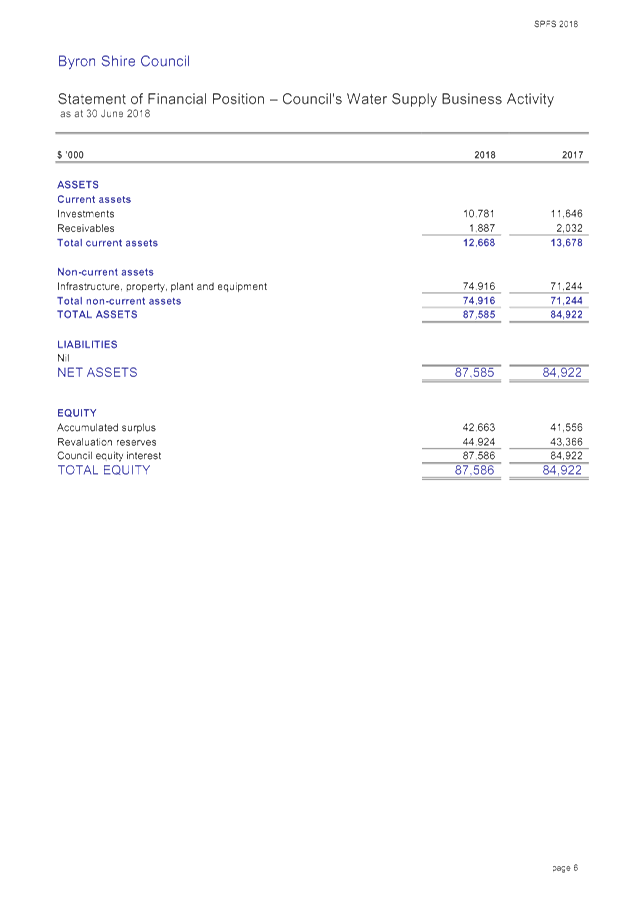
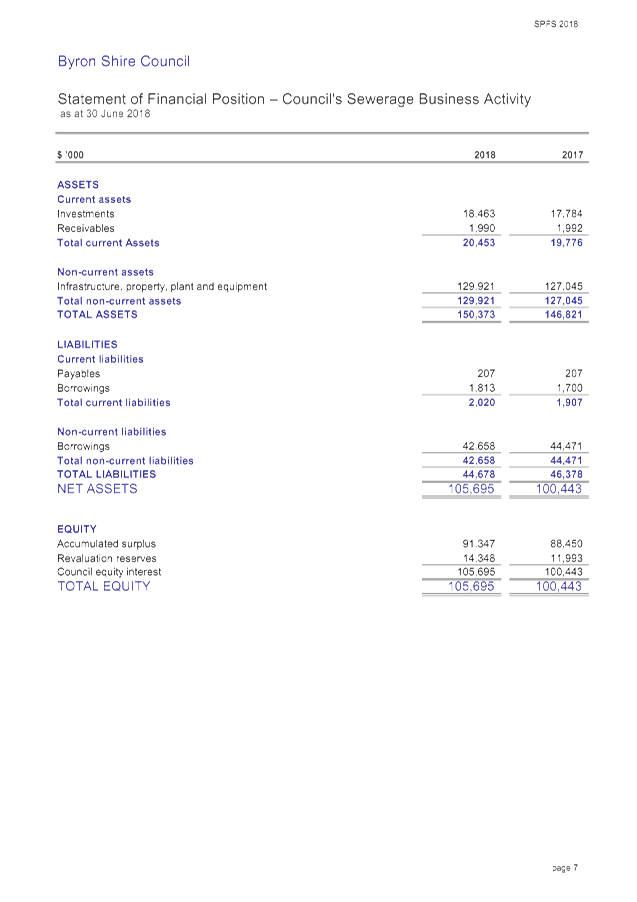
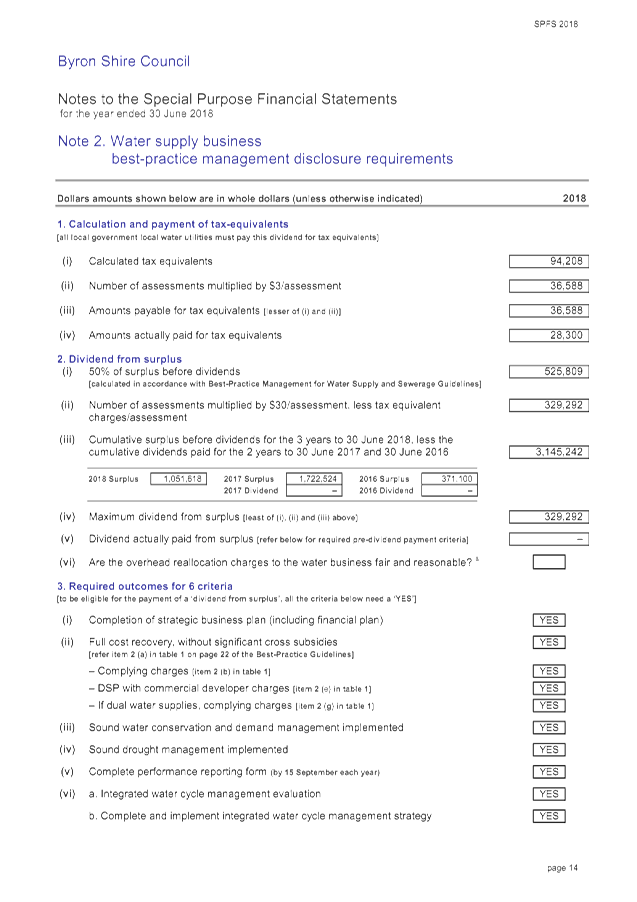
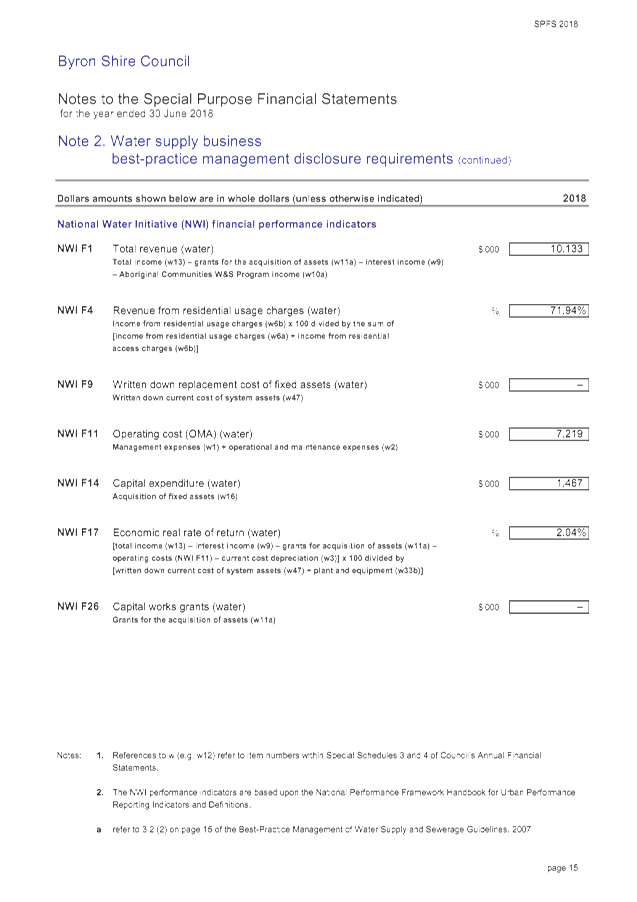
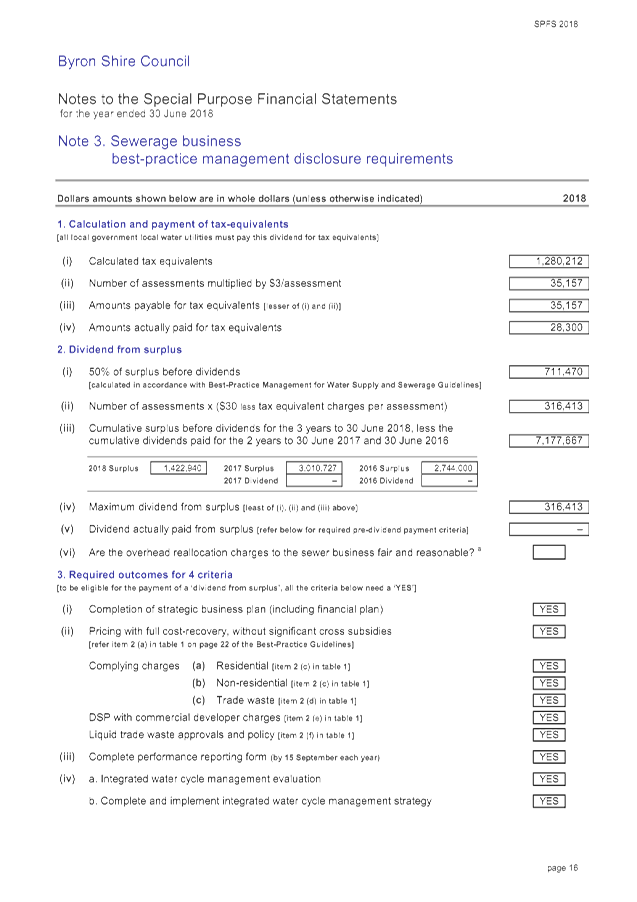
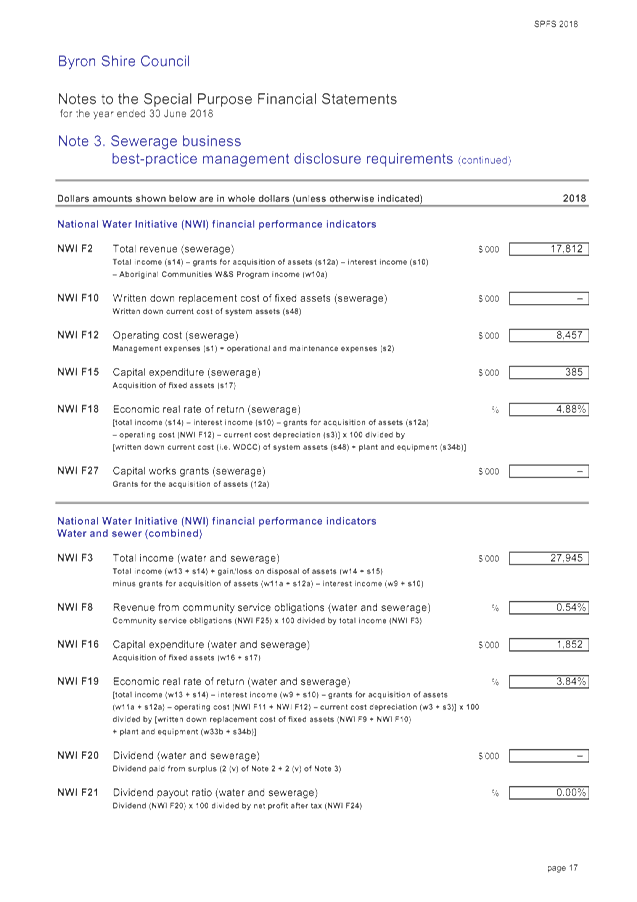
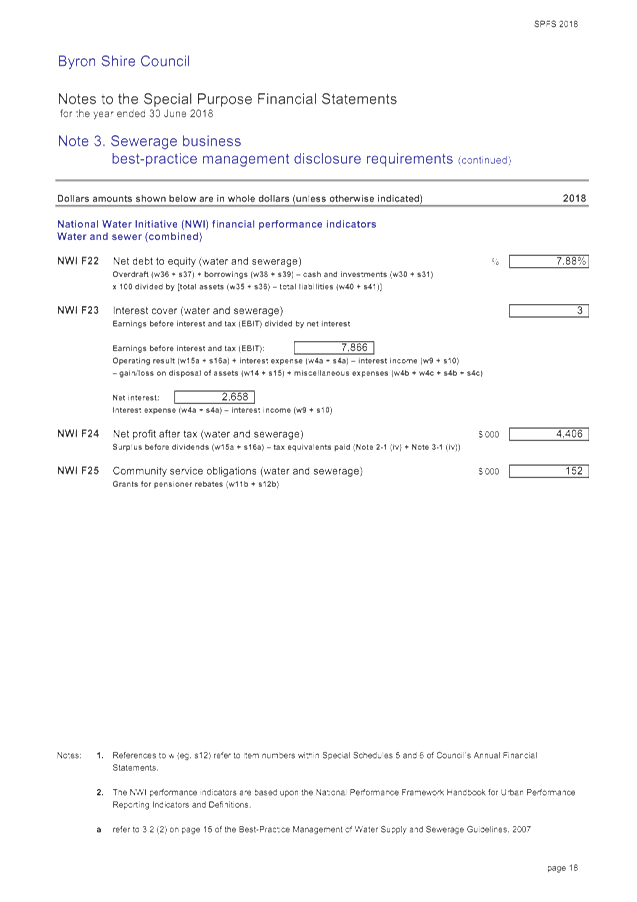
Special Purpose Financial Statements
These Statements are a result of the implementation of the National
Competition Policy and relate to those aspects of Council’s operations
that are business orientated and compete with other businesses with similar
operations outside the Council. Mandatory disclosures in the Special Purpose
Financial Reports are Water and Sewerage. Additional disclosure relates
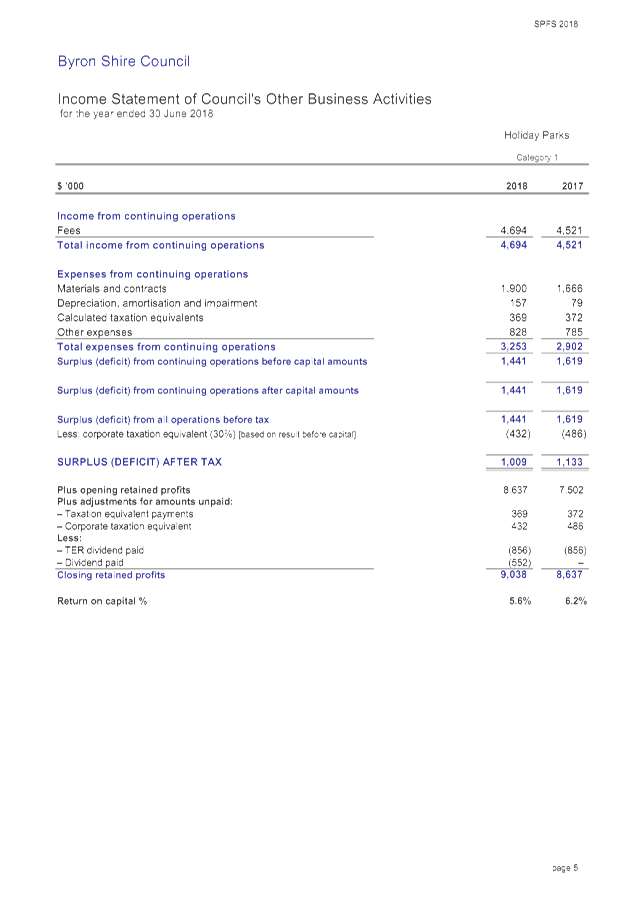
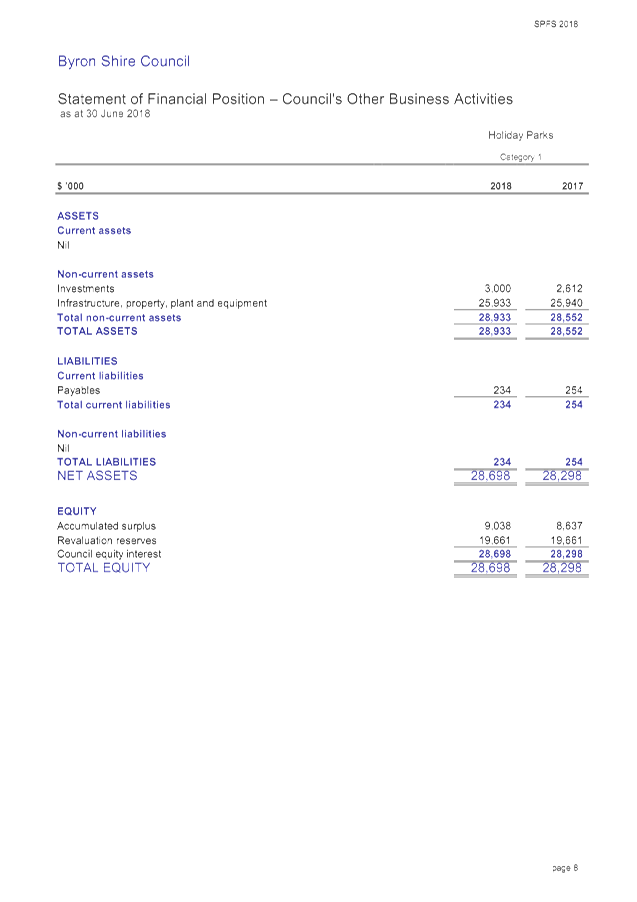
to Council business units that Council deems ‘commercial’. In
this regard Council has traditionally reported its Caravan Park Operations
being Suffolk Beachfront Holiday Park and First Sun Holiday Park on a combined
basis. These financial reports must also classify business units in the
following categories:
· Category 1 – operating turnover is greater than $2million
· Category 2 – operating turnover is less than $2million
All of Council’s business units are classed as Category 1 with all having operating turnover greater than $2 million.
Another feature of the Special Purpose Financial Reports is to build in taxes and charges where not physically incurred into the financial results to measure the results in the sense of a level playing field with other organisations operating similar businesses, who are required to pay these additional taxes and charges. These taxes and charges include:
· Land tax – Council is normally exempt from this tax so notional land tax is applied.
· Income tax – Council is exempt from income tax and in regard to these reports, company tax. Any surplus generated has a notional company tax applied to it.
· Debt guarantee fees – Generally due to the low credit risk associated with Councils, Councils can often borrow loan funds at lower interest rates then the private sector. A debt guarantee fee inflates the borrowing costs by incorporating a notional cost between interest payable on loans at the interest rate borrowed by Council and one that would apply commercially.
In regard to the Special Purpose Financial Reports, these are prepared on a non consolidated basis or in other words grossed up to include any internal transactions with the General Fund.
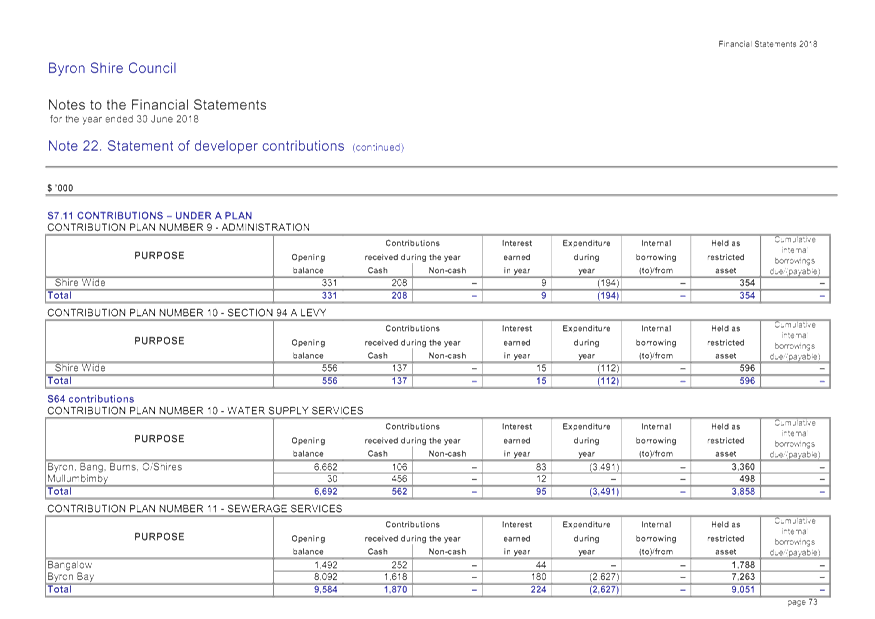
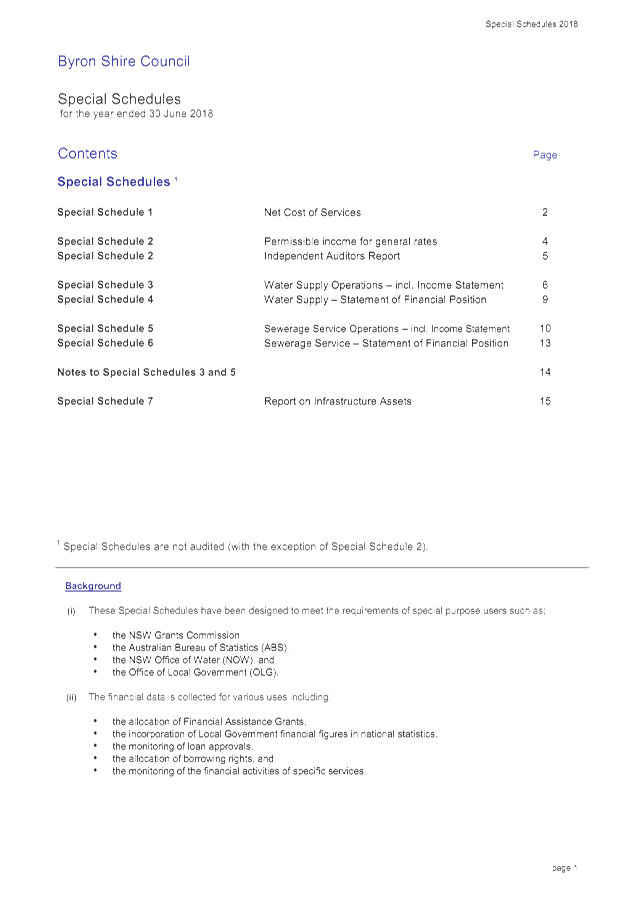
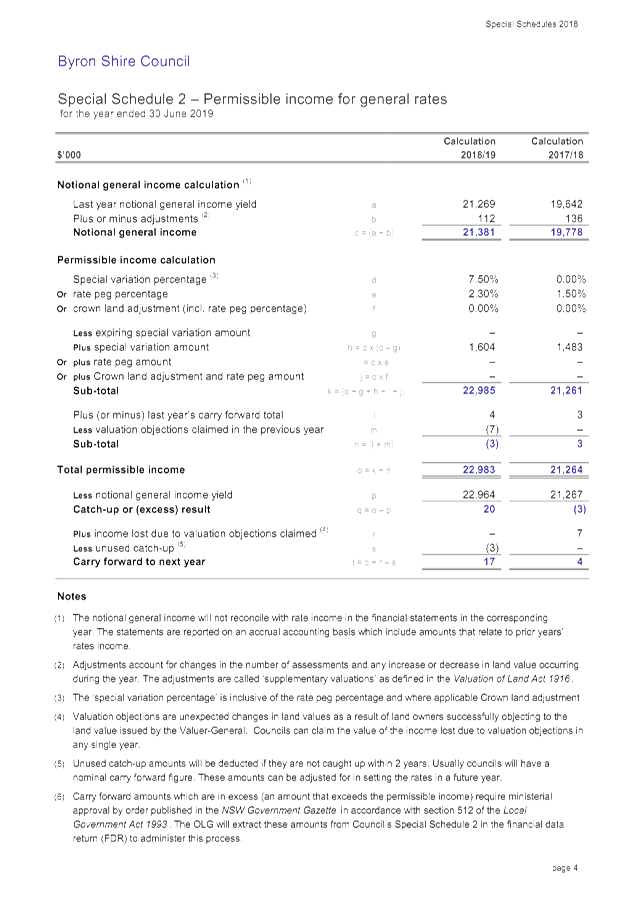
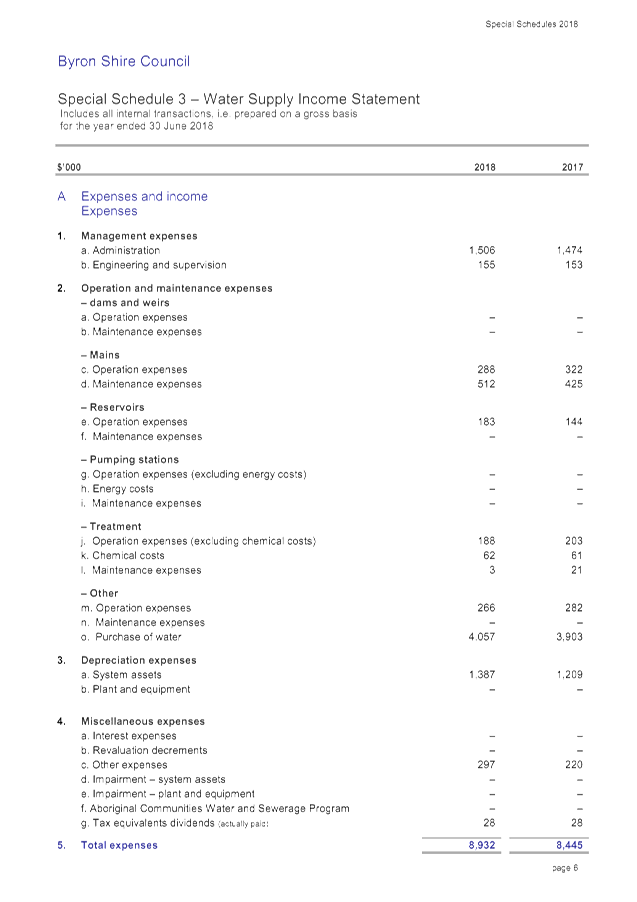
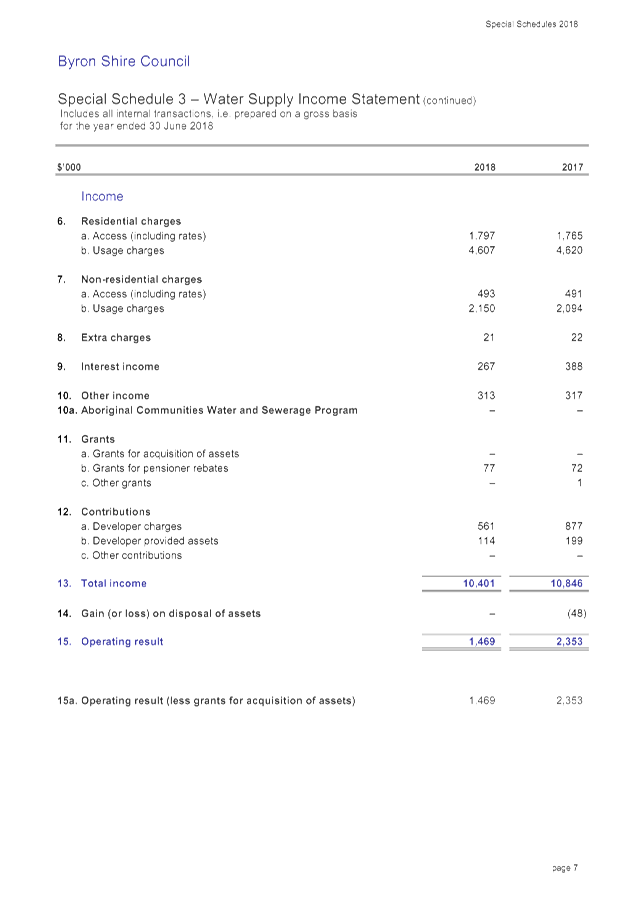
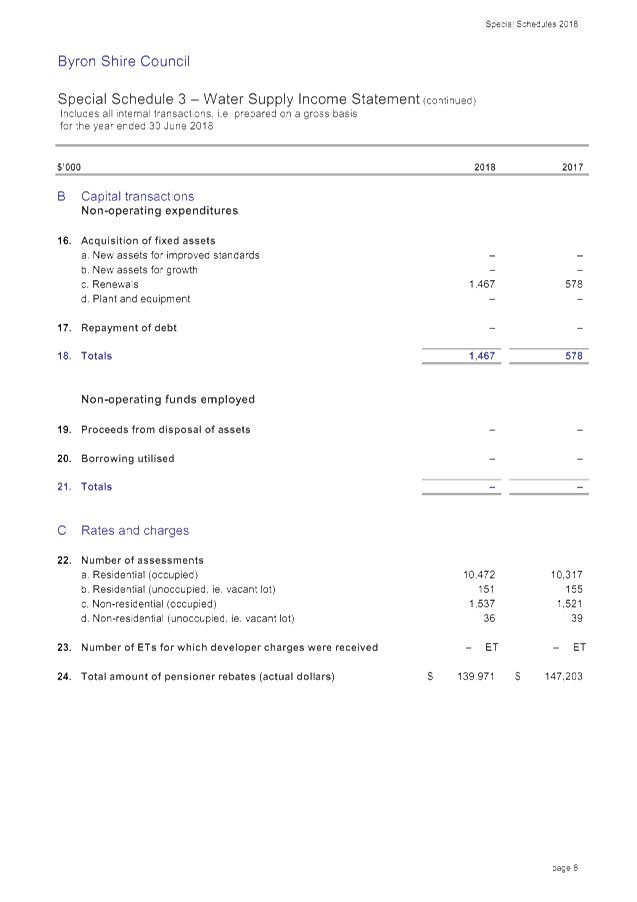
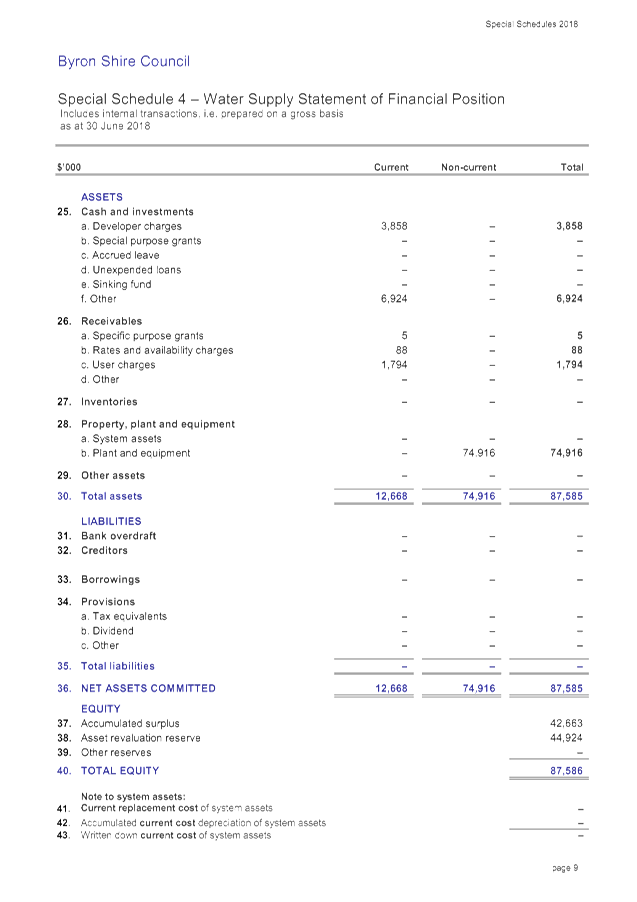
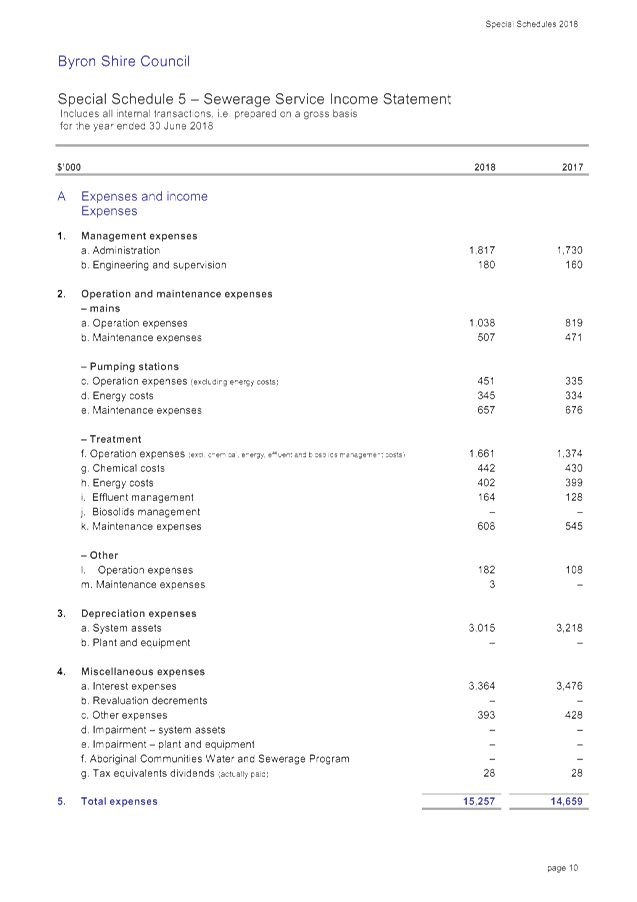
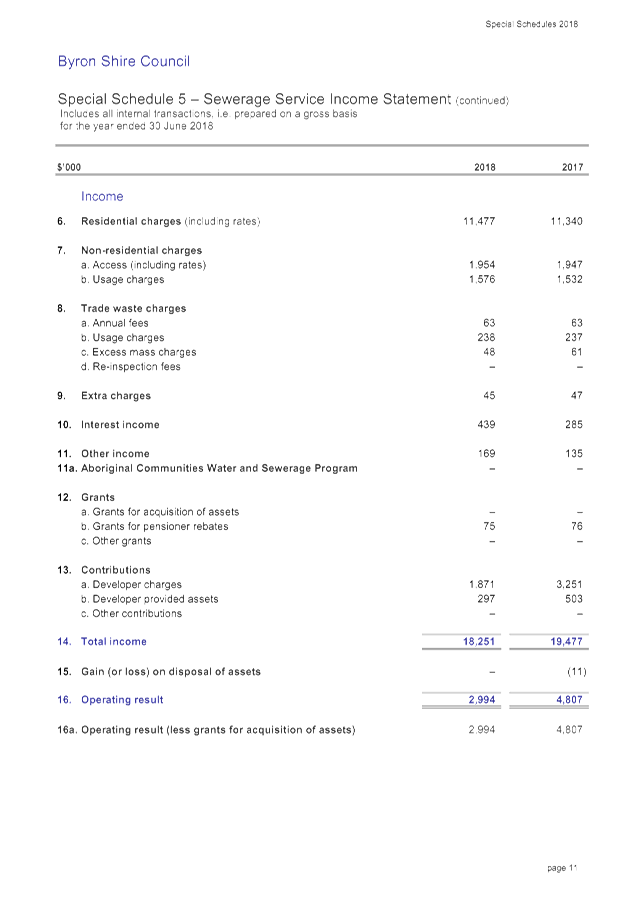
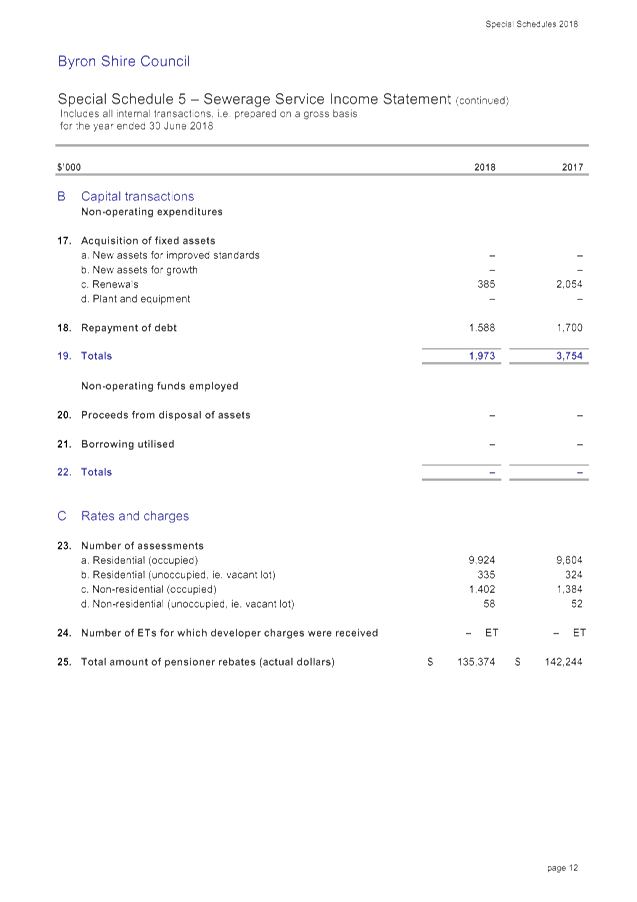
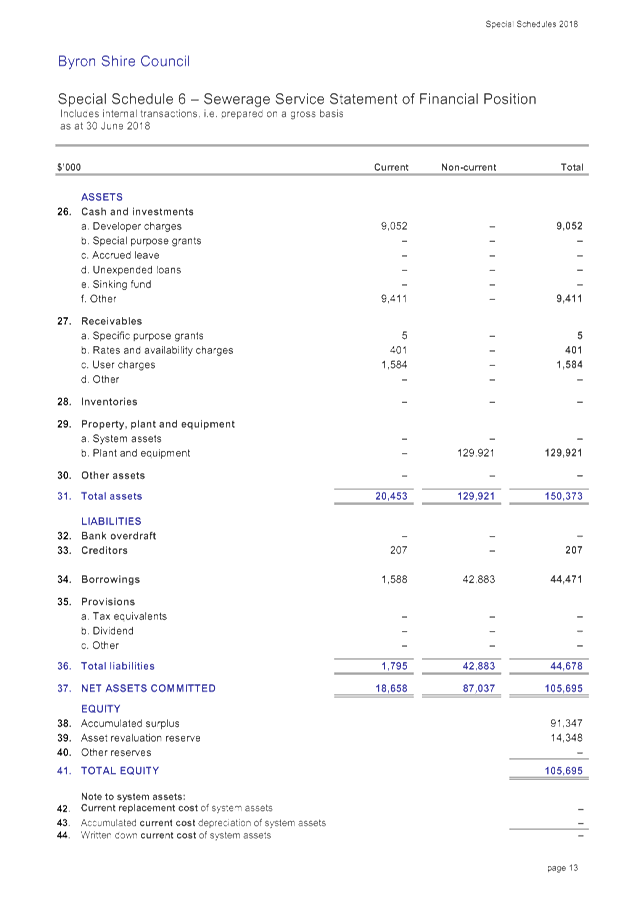
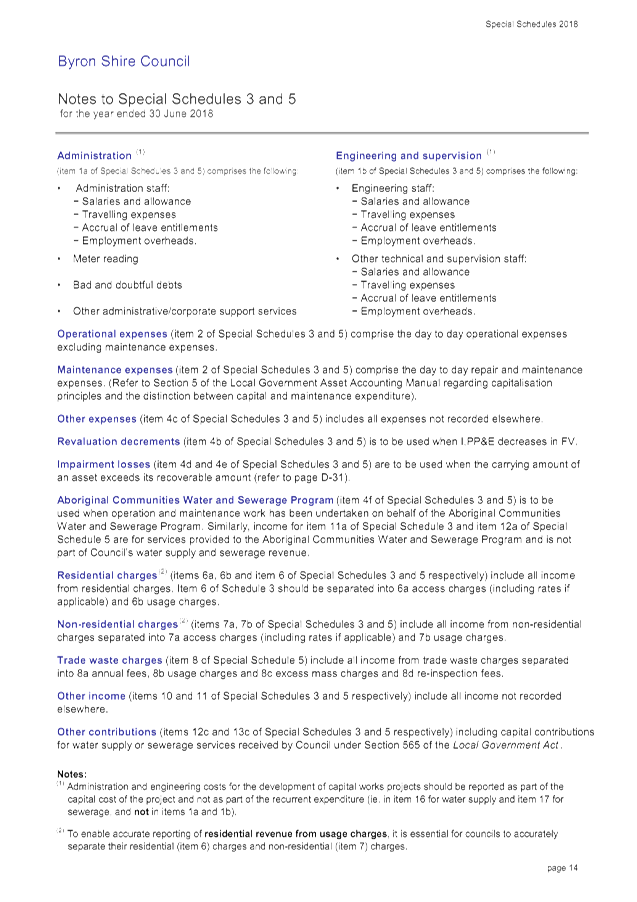
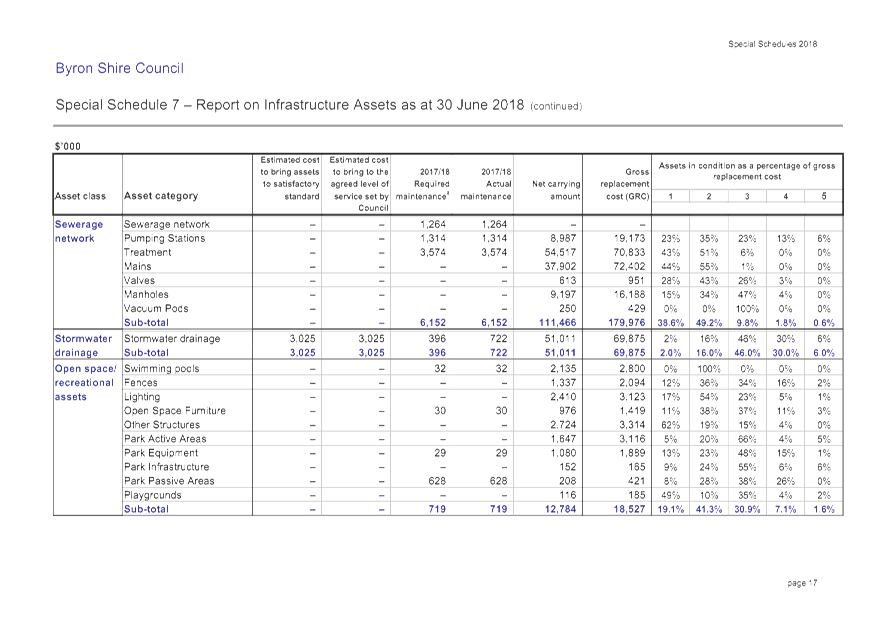
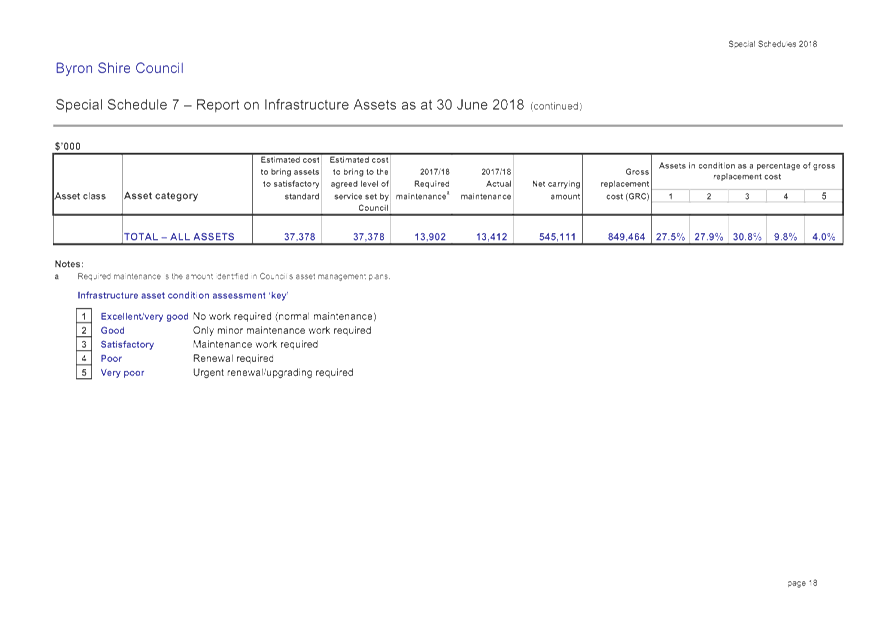
Special Schedules
These schedules are prepared essentially for use by the Australian Bureau
of Statistics, the NSW Grants Commission, the Office of Local Government, and
are primarily used to gather information for comparative purposes. Special
Schedules 3 to 6 are also used by the Department of Primary Industries (NSW
Office of Water) in analysing the performance of the Water and Sewer Funds and are
also non consolidated and grossed up including internal transactions. Special
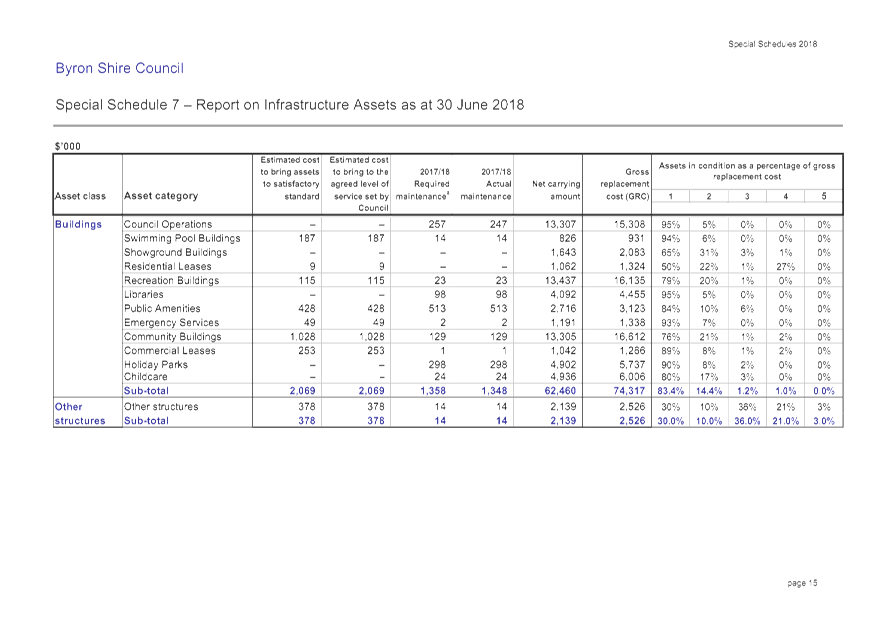
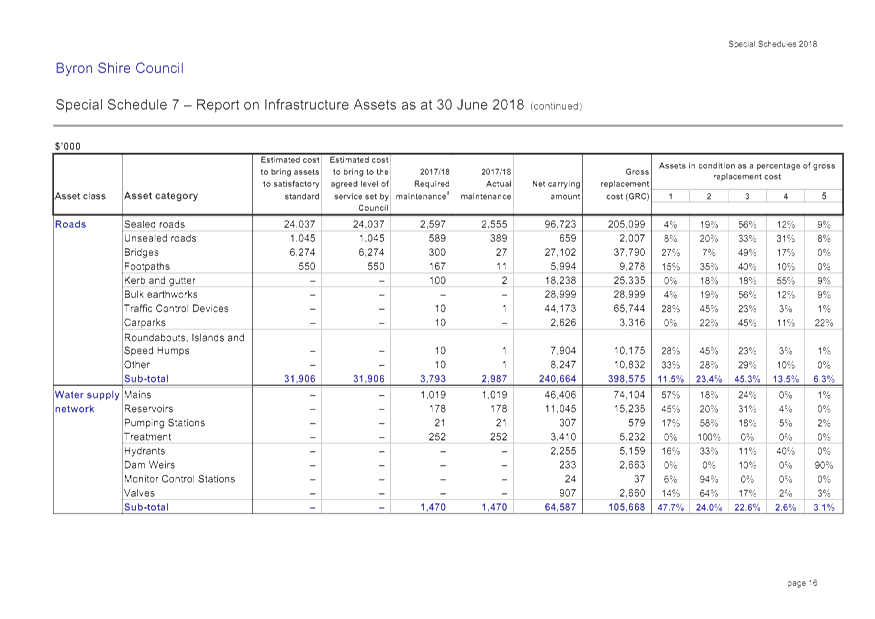
Schedule 7 provides an approximate value of what funds are needed for the
maintenance and renewal of Council assets in comparison to what is currently
allocated in the budget. Special Schedule 2 is also included, which is a
disclosure regarding Council’s compliance with General Rate revenue
raising and rate pegging. Special Schedule 2 is also subject to separate
external audit aside from the financial statements.
Auditors Report on the
Financial Statements
Council’s auditors, The Auditor General of NSW (NSW Audit Office) and
their representative firm Thomas Noble and Russell, have completed their audit
of the Draft 2017/2018 Financial Statements. All matters identified during the
audit have been adjusted and included in the Draft 2017/2018 Financial
Statements (if required) included at Attachments 1, 2 and 3. The Auditors
Report is to report on the following:
· A report on the conduct of the audit. This report states the financial statements have been audited with an opinion. For the year ended 30 June 2018 the opinion is expected to be unmodified. In addition, this report outlines significant audit issues and observations, and a analysis of the major aspects of the financial statements.
The Draft Auditors Report is included at Attachment 4.
Specific Items relating to 2017/2018 Draft Financial Statements
The Draft 2017/2018 Financial Statement results have been impacted by the following items that require explanation to Council:
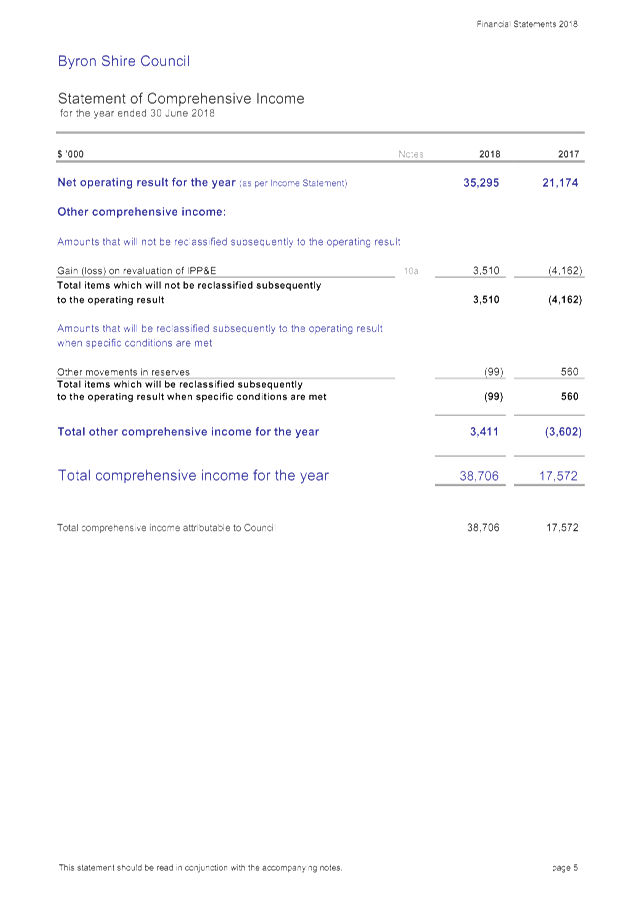
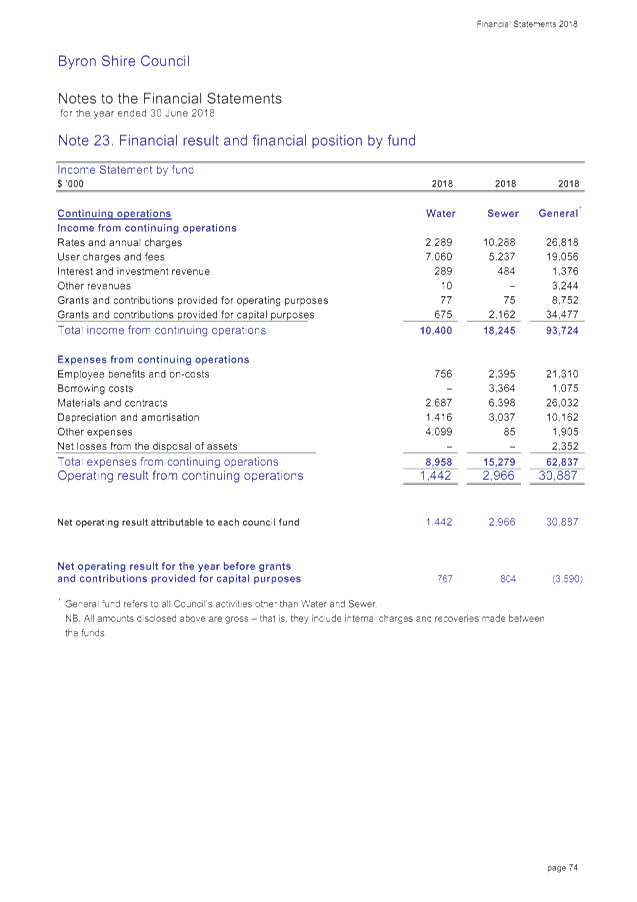
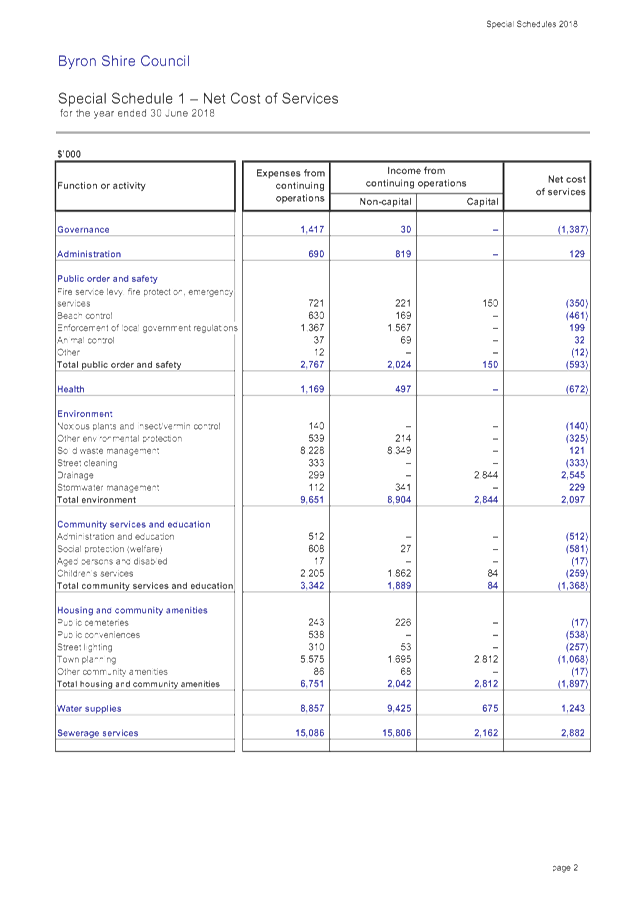
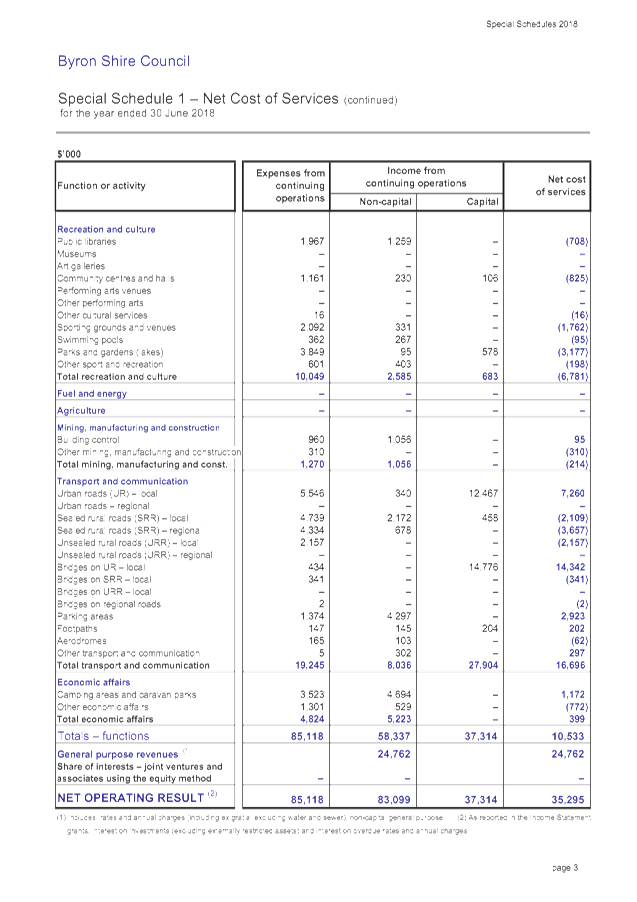
· Operating Result from Continuing Operations
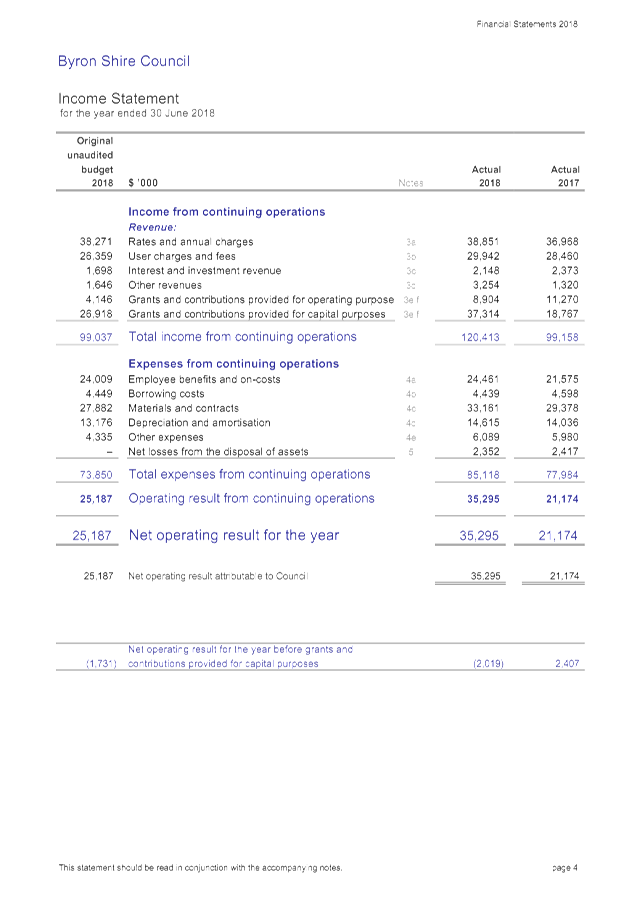
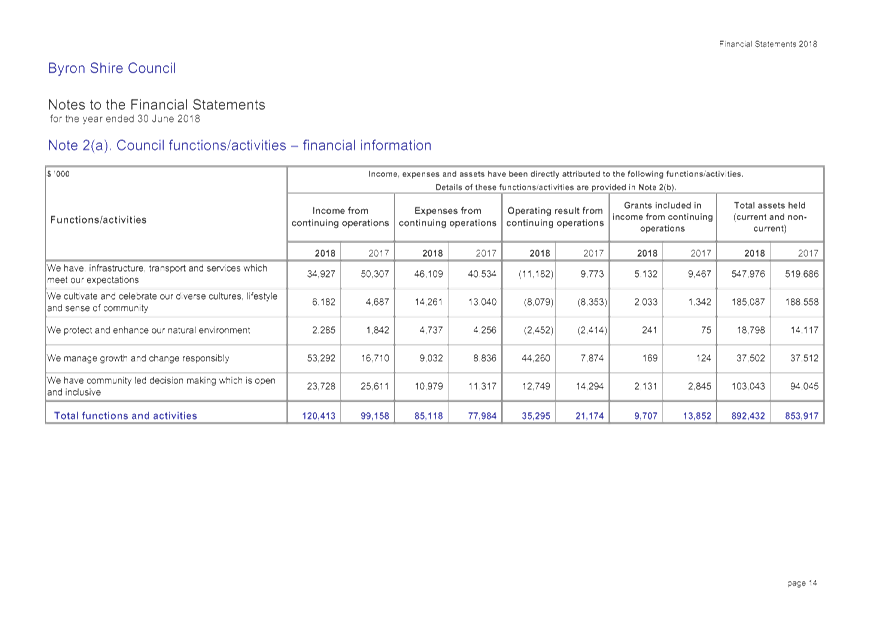
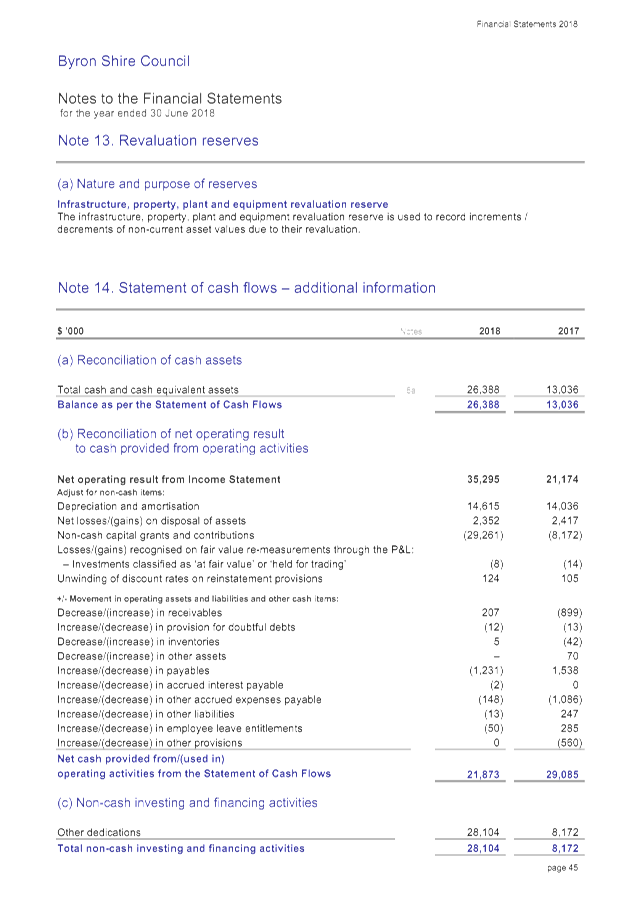
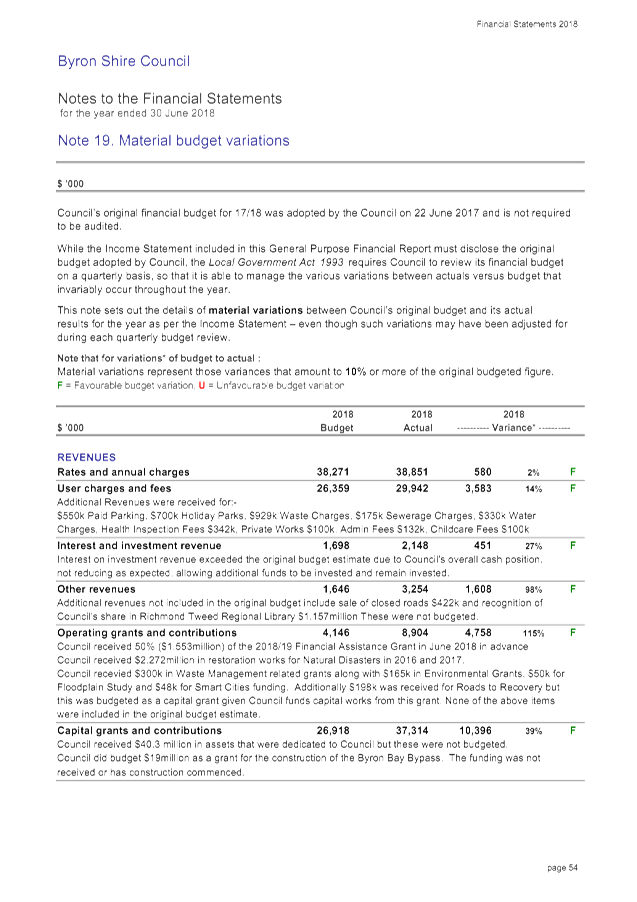
The 2017/2018 financial year has seen a further improvement in the overall financial result of Council. Overall Council recorded a $35.295million surplus compared to a $21.174million surplus in 2016/2017. This represents a positive change of $14.121million between financial years. This result incorporates the recognition of capital revenues such as capital grants and contributions for specific purposes and asset dedications including part of the Old Pacific Highway that amounted to $37.314million in 2017/2018 compared to $18.767million in 2016/2017.
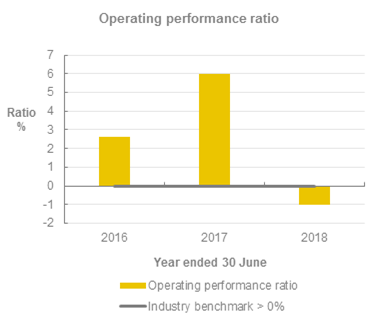
A more important indicator is the operating result before capital grants and contributions. This result for Council was a deficit of $2.019million in 2017/2018 compared to a surplus of $2.407million in 2016/2017 representing a decrease of $4.426million between financial years. This indicates Council’s operating expenditures exceeded its operating revenues. Whilst operating revenues excluding capital grants and contributions grew by $2.708million, overall operating expenses grew by $7.134million.
If reference is made to the Income Statement to the General Purpose Financial Reports included at Attachment 1, the following table indicates the major changes between 2017/2018 and 2016/2017 by line item:
|
Item |
Change between 2017/2018 and 2016/2017 $’000 |
Change Outcome |
Comment |
|
Income |
|
|
|
|
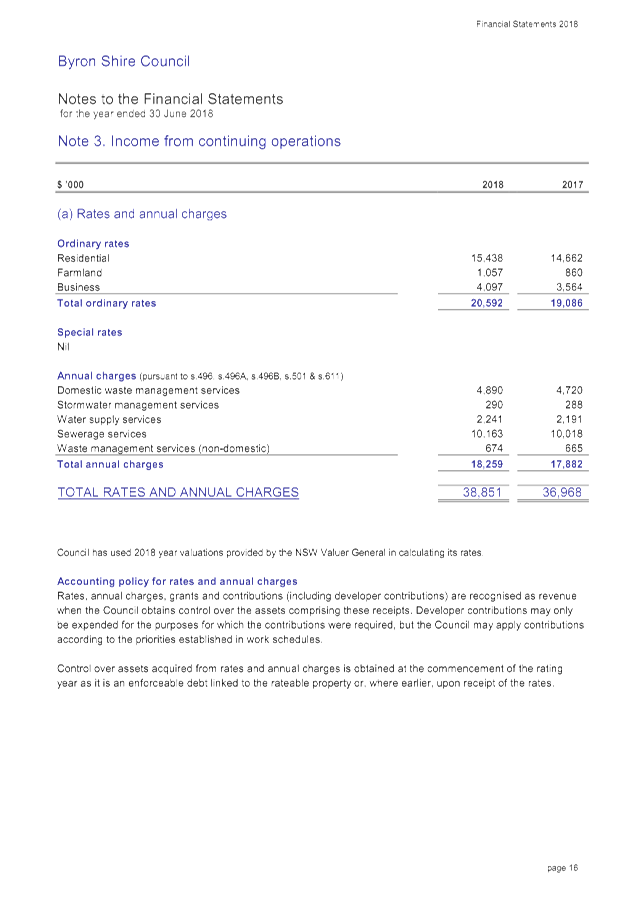
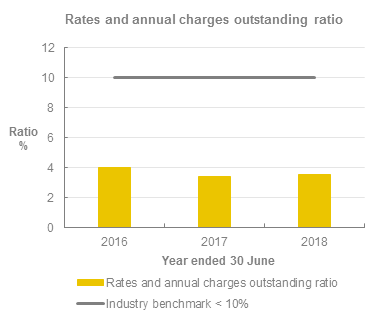
Rates & Annual Charges |
+$1,883 |
Increase |
Reflects imposition of the first year of the 7.50% Special Rate Variation and changes in annual charges from Council’s adopted 2017/2018 Revenue Policy |
|
User Charges and Fees |
+$1,482 |
Increase |
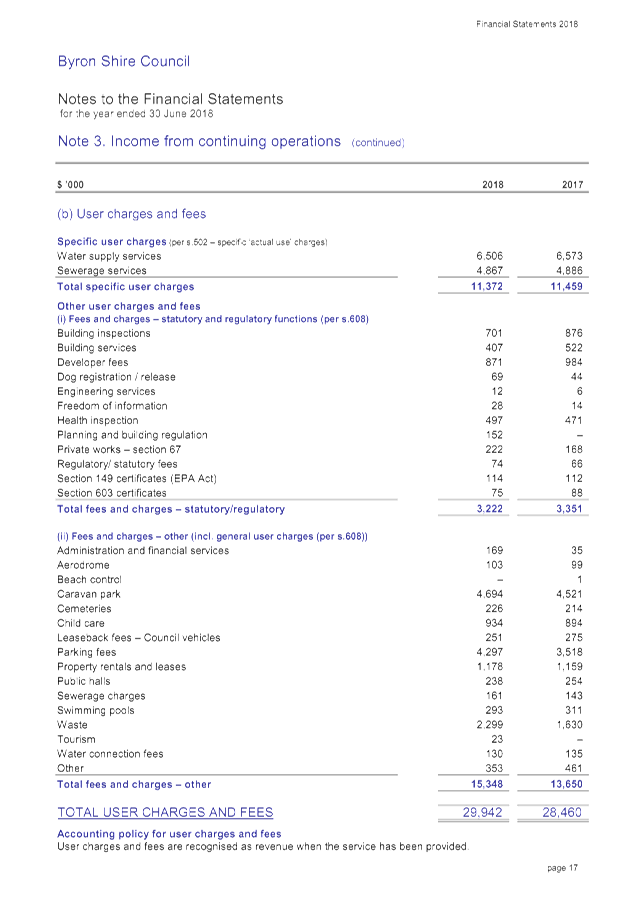
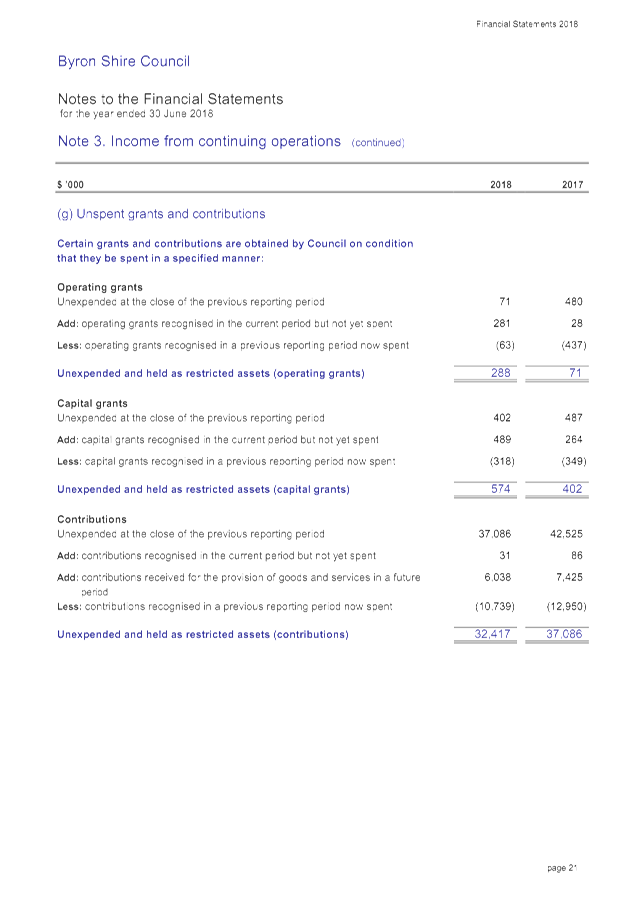
Major changes include additional $173k revenue for holiday parks, $779k increase in parking fees, and $669k in waste fees. Further information is available in Note 3(b) in Attachment 1. |
|
Interest and Investment Revenue |
-$225 |
Decrease |
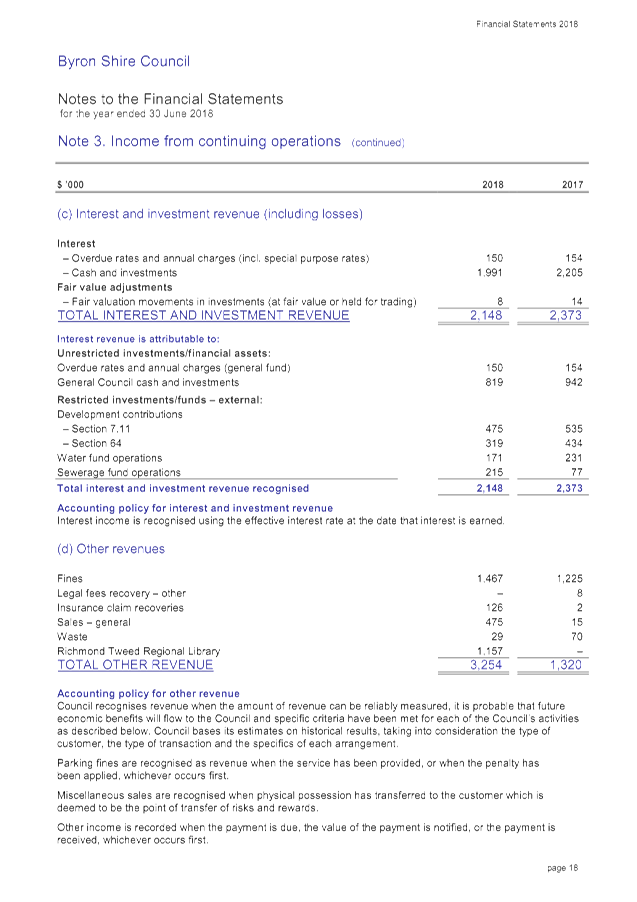
Decrease in revenues due to further decline in interest rates reflective of economic conditions. Council’s cash position though did not decrease as expected which enabled more funds to be invested which minimised the extent of the decline. |
|
Other Revenues |
+$1,934 |
Increase |
Increase of $242k for fines, sale of closed roads $422k and recognition of share in Richmond Tweed Regional Library $1,157k. |
|
Grants & Contributions – Operating |
-$2,366 |
Decrease |
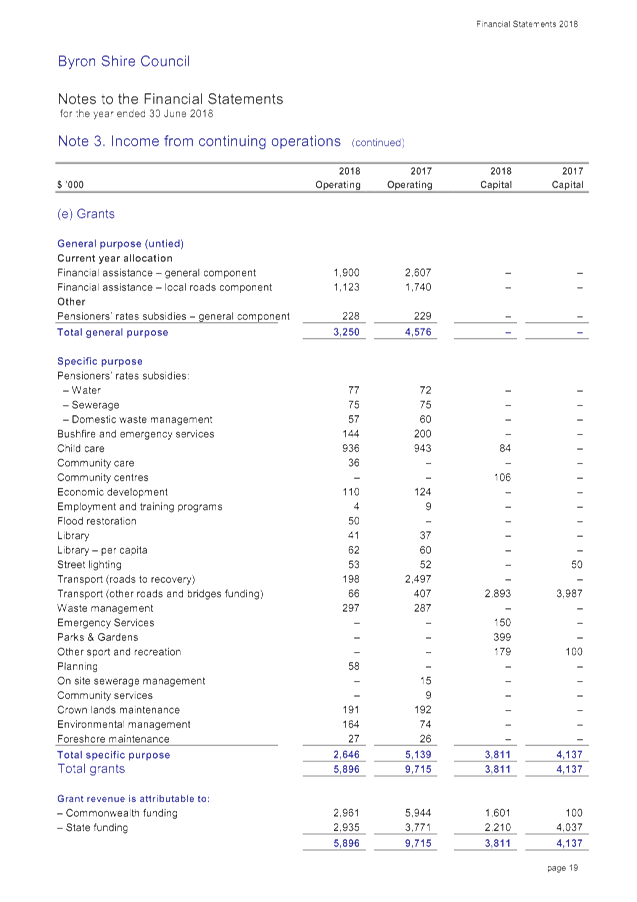
Decrease in financial assistance grant $1,326k as 2016/2017 received 1.5 years grant. Decrease of $2,299k Roads to Recovery Grant as Council spent current allocation by 2017/2018. $1,500k increase in Natural Disaster Revenue due to restoration works. |
|
Grants & Contributions – Capital |
+$18,547 |
Increase |
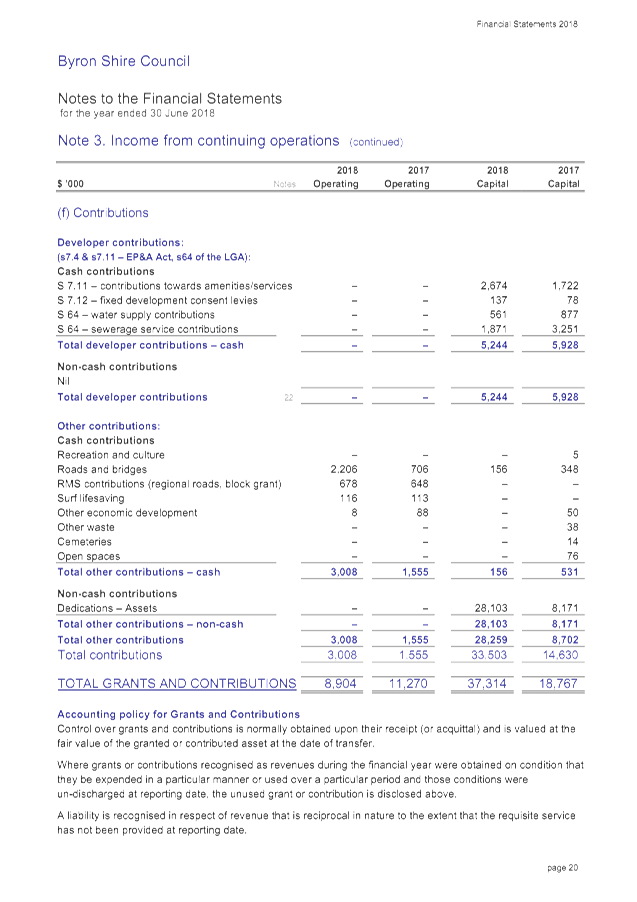
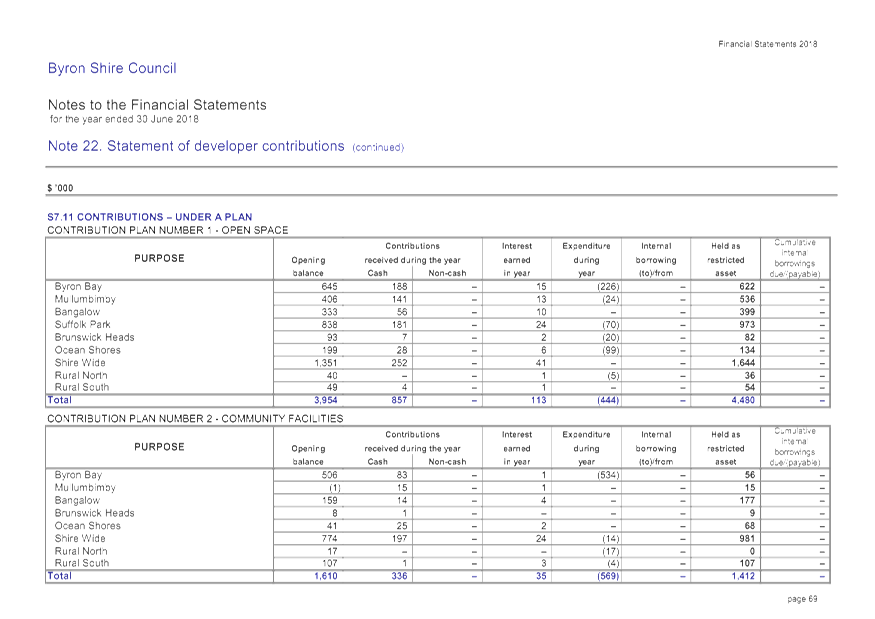
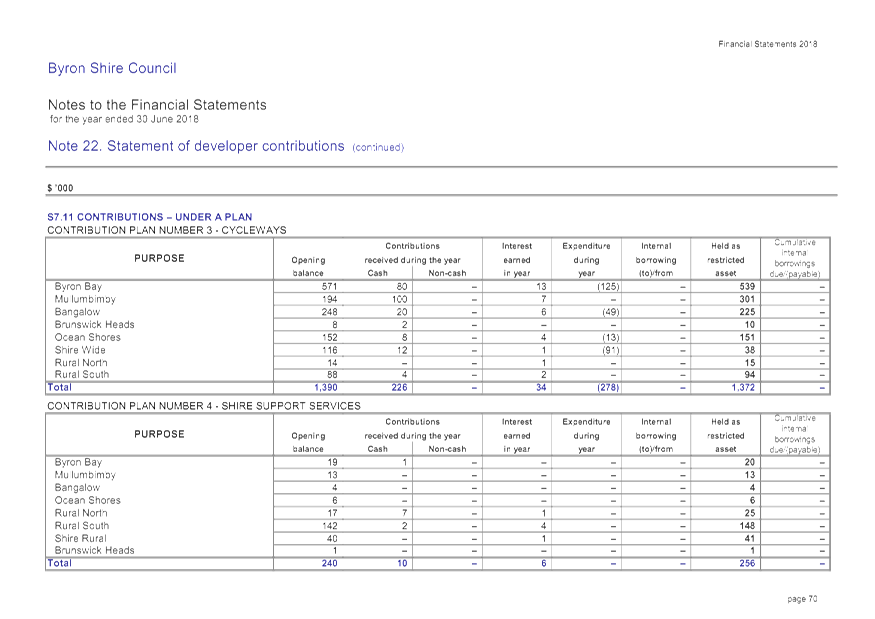
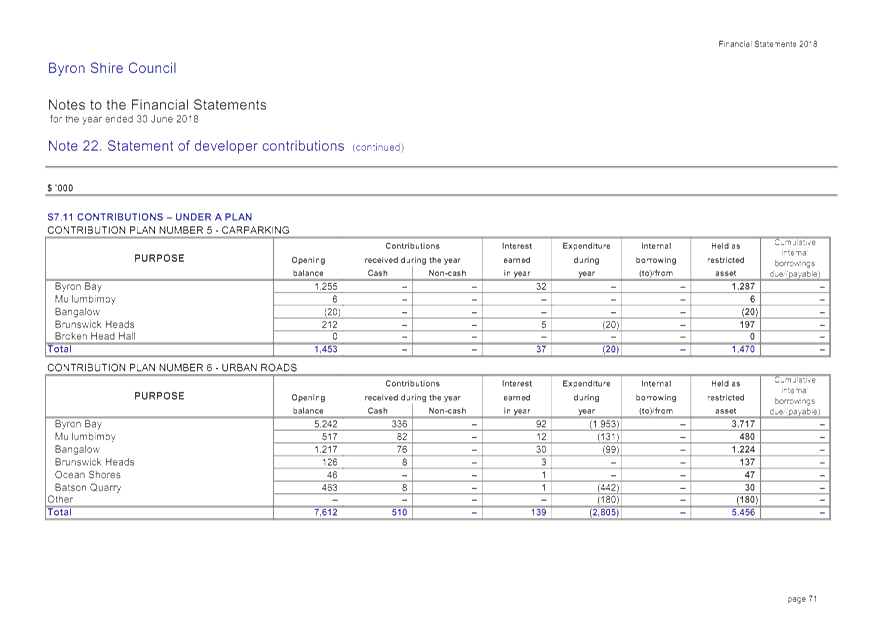
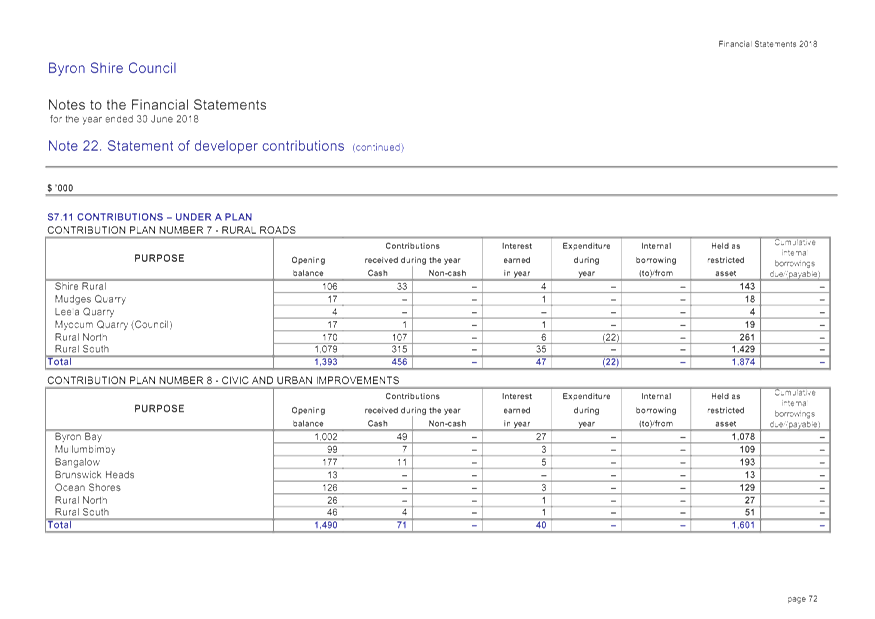
Decline of $684k in developer contribution revenue and $326k in capital grants but $19,392k increase in asset dedication revenue stemming mainly from former Pacific Highway assets. |
|
Total Income Change |
+$21,255 |
Increase |
|
|
|
|
|
|
|
Expenditure |
|
|
|
|
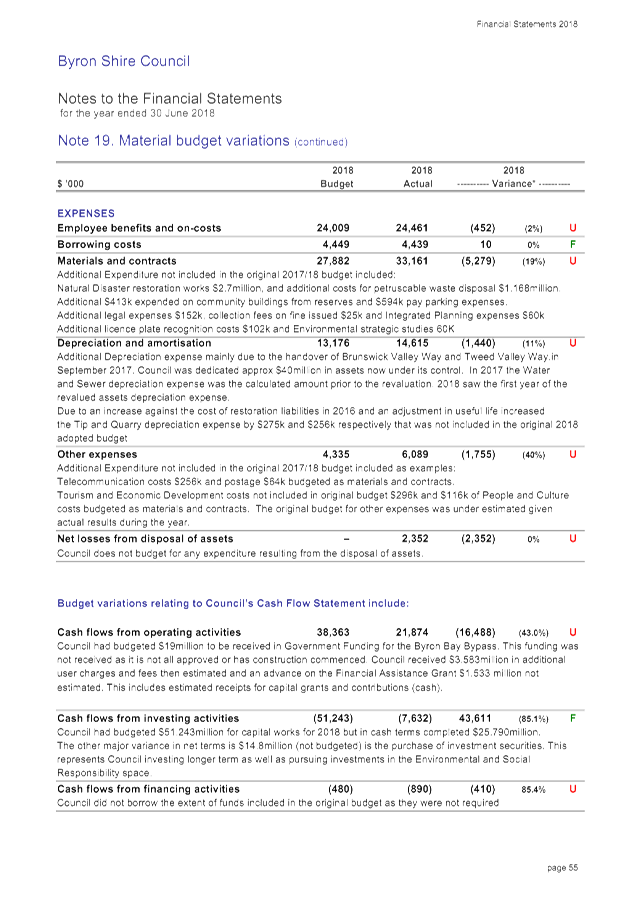
Employee Benefits and Oncosts |
+$2,886 |
Increase |
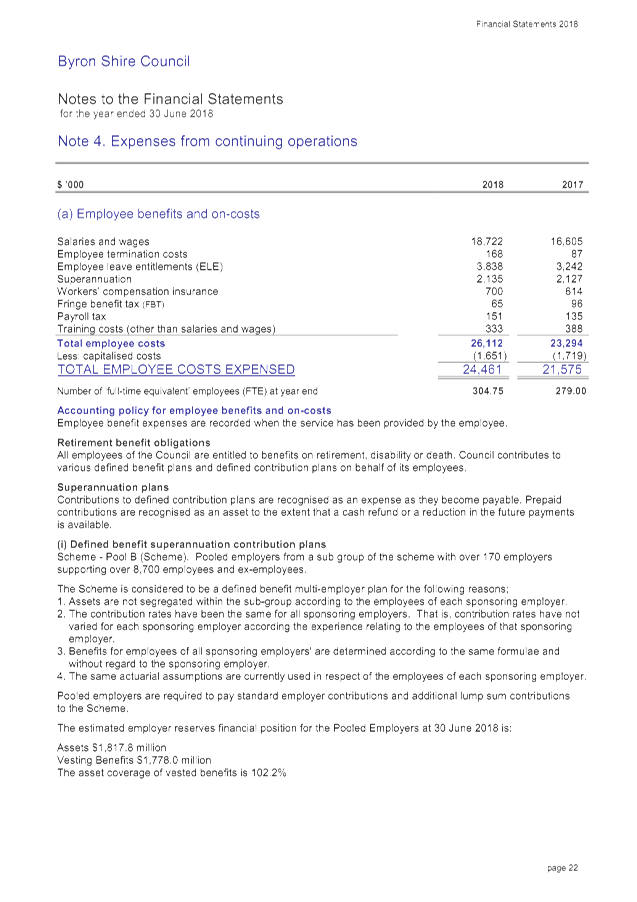
Increased salary and wages $2,117k including Award increase of 2.35% and additional staffing. Increased leave entitlement expenses of $626k and workers compensation insurance premium increase of $86k. There was a decrease of $68k of employee costs capitalised on capital works in 2017/2018 compared to 2016/2017. |
|
Borrowing Costs |
-$159 |
Decrease |
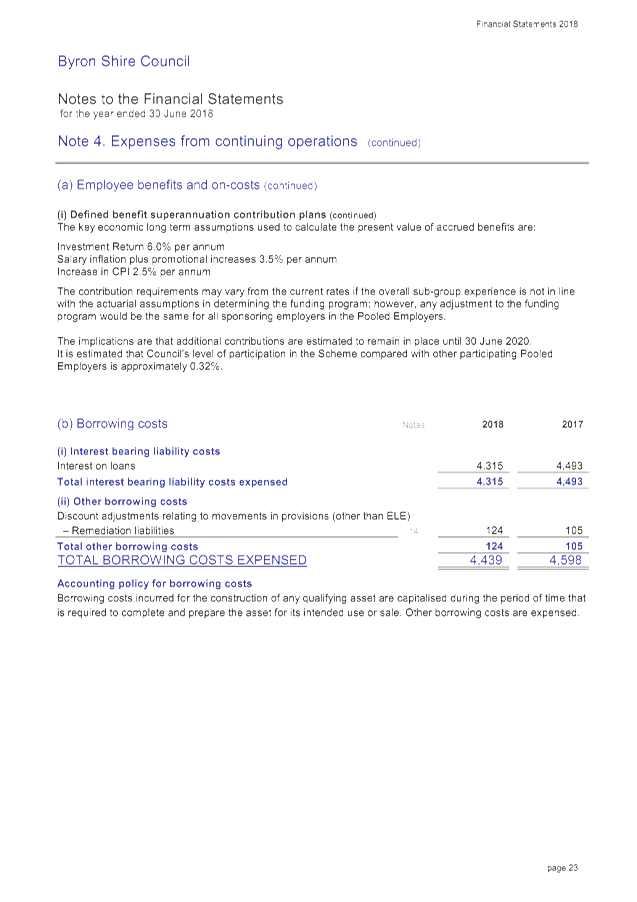
Results from Council gradually repaying loans and not borrowing significant new loans. New loan of $1.665million borrowed at end of 2017/2018 financial year. Interest impact of this loan will be realised commencing in 2018/2019. |
|
Materials & Contracts |
+$3,783 |
Increase |
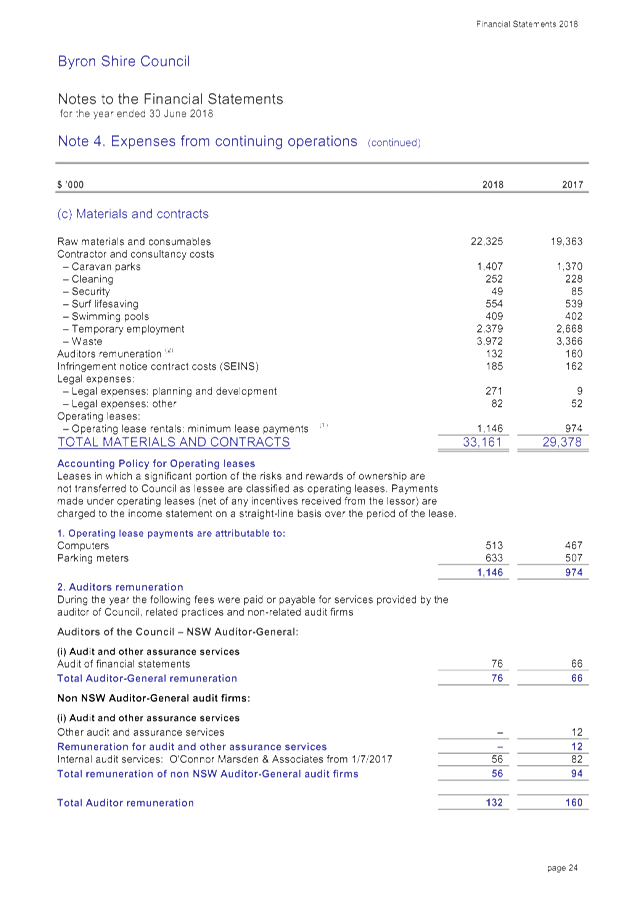
Raw materials and contracts increased of $2,962k. There were decrease in agency temporary staff of 289$k, increase in legal expenses $292k, operating lease expenses increased $172k mainly relating to parking meters, and waste contract $606k |
|
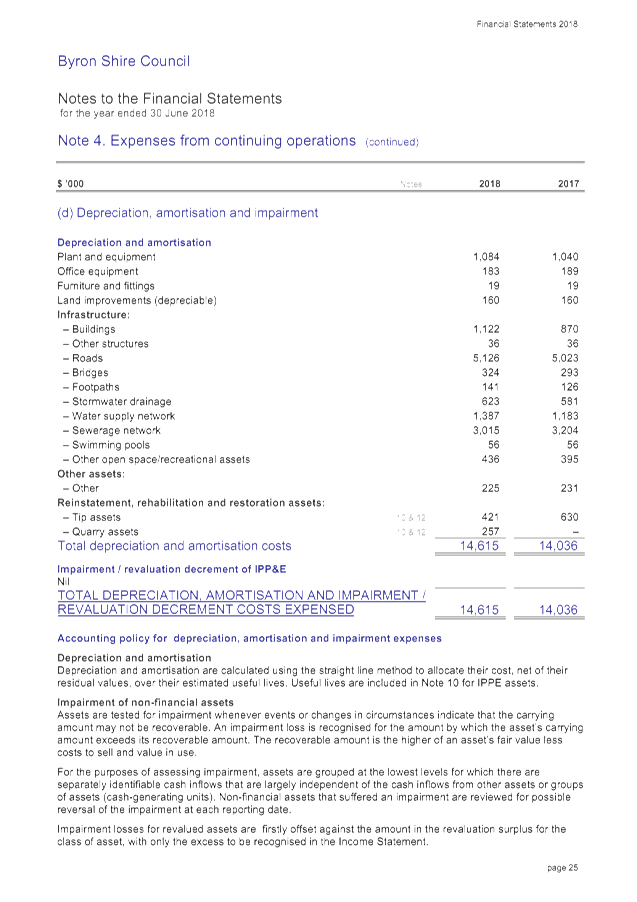
Depreciation |
+$579 |
Increase |
Major change is due to roads $103k increase, buildings $252k and increase of $204k for water infrastructure. |
|
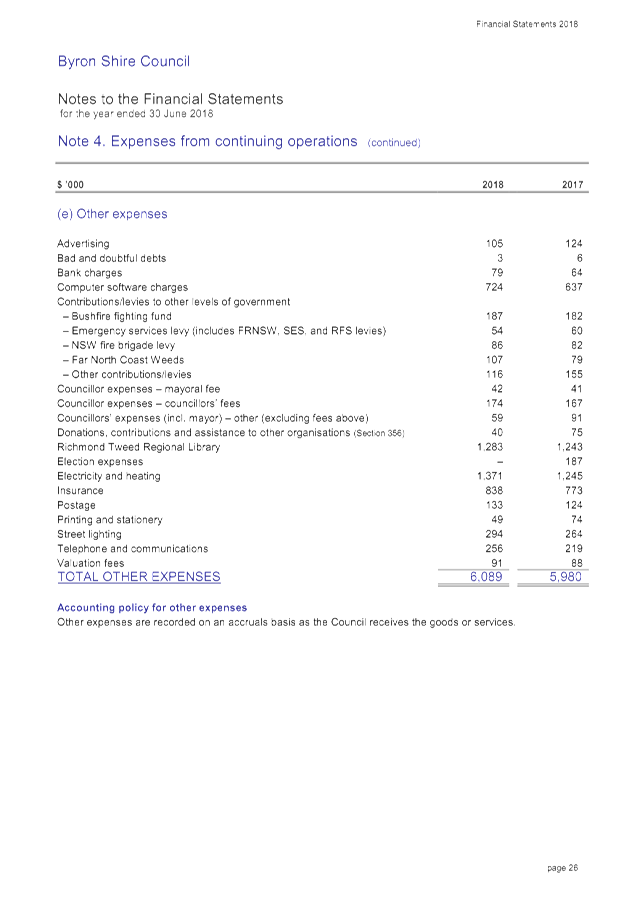
Other Expenses |
+$109 |
Increase |
Overall increase but there were variations in line items as disclosed at Note 4(e) in Attachment 1. Most significant item was electricity and heating $126k. |
|
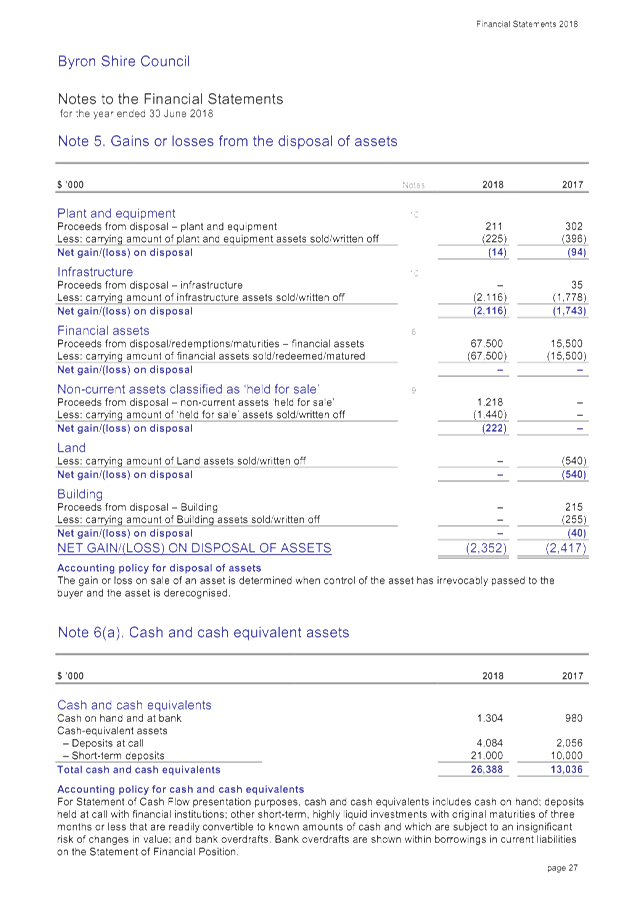
Net Losses from Disposal of Assets |
-$65 |
Increase |
Reflection of the written down value of assets disposed at the end of financial year and is contingent upon the extent of assets disposed and their written down value at the time of disposal which can vary. For 2017/2018, Council has more disposals than gains including the disposal of infrastructure $2,166k, plant and equipment $14k and loss on sale of land $222k. |
|
Total Expenditure Change |
+$7,134 |
Increase |
|
|
|
|
|
|
|
Change in Result |
+$14,121 |
Increase |
Increase in overall surplus between financial years. |
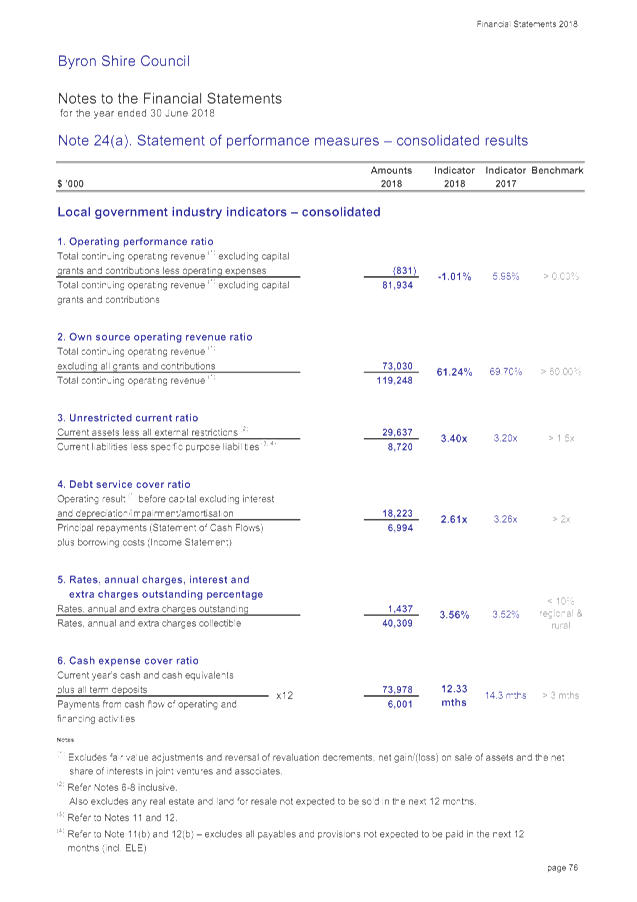
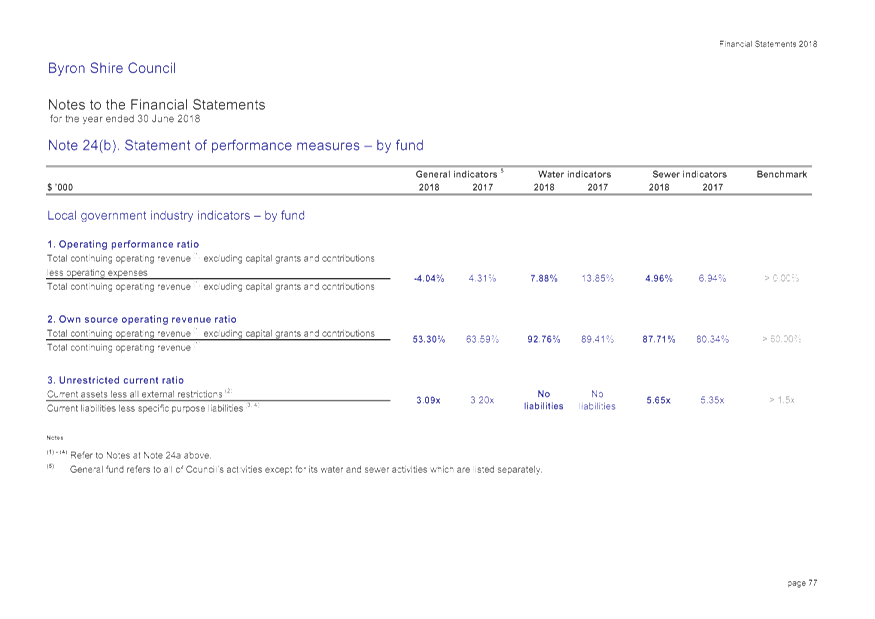
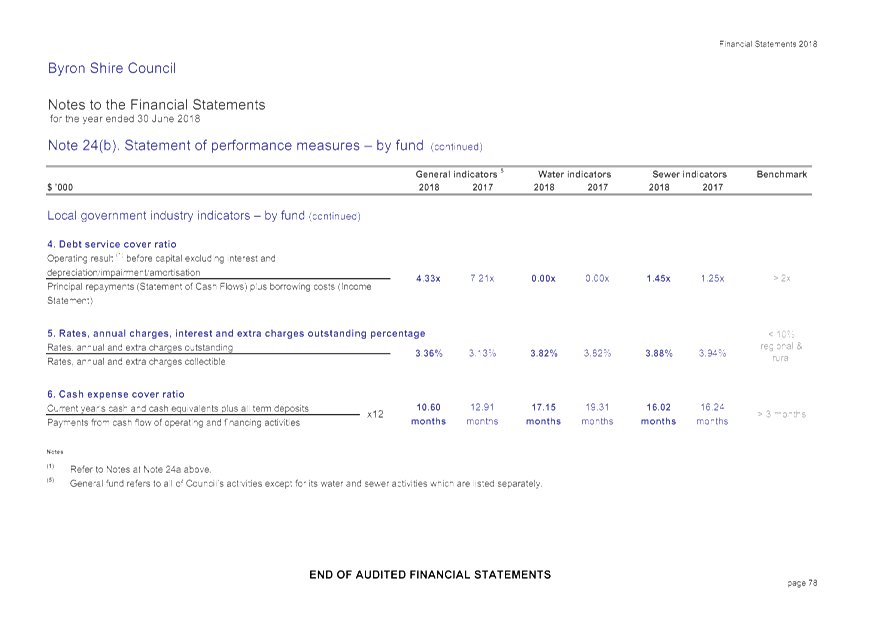
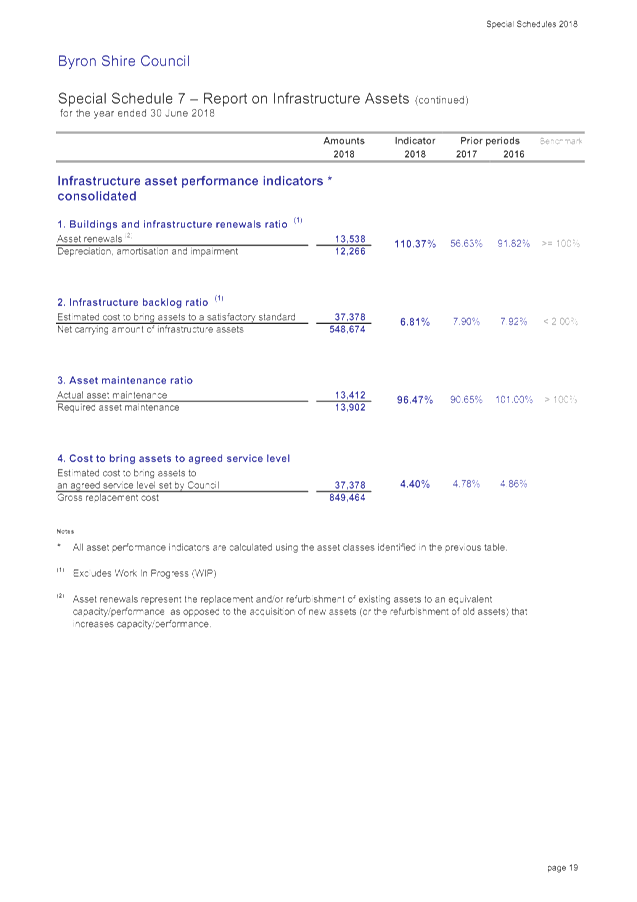
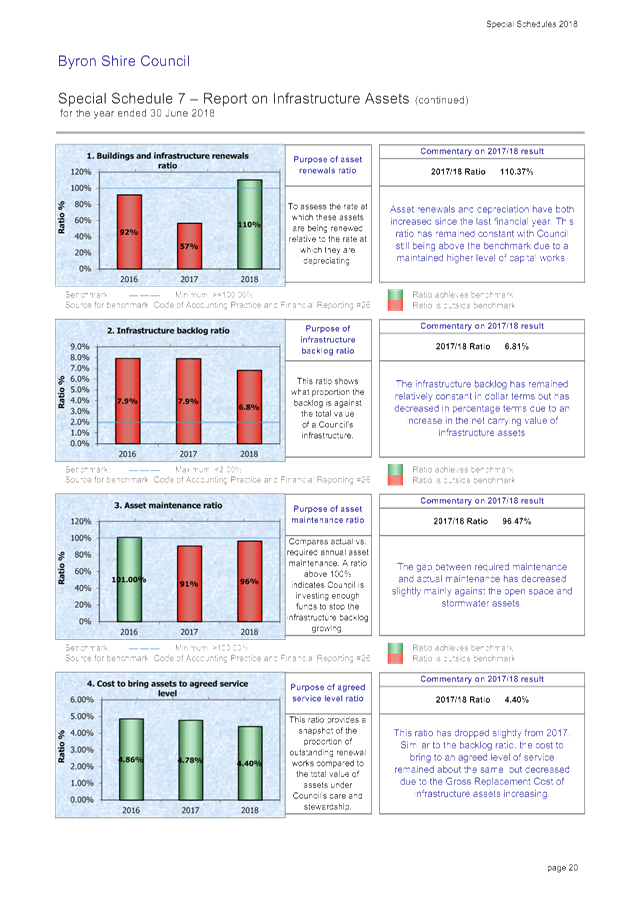
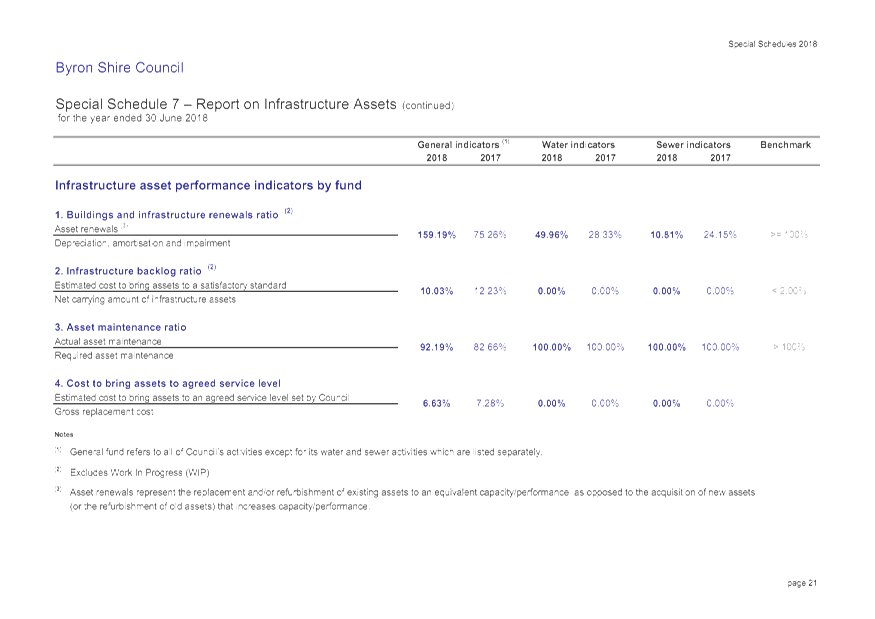
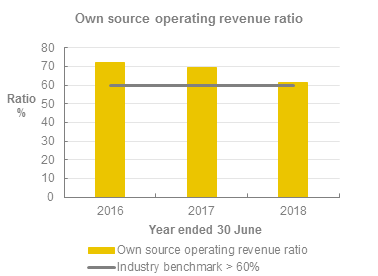
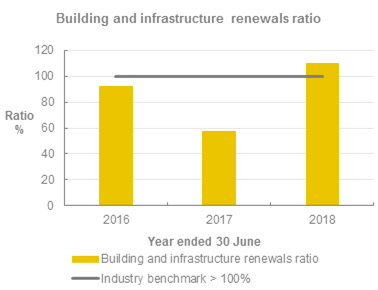
Following on from the operating results, there are performance ratios disclosed at note 24 to the General Purpose Financial Statements and in Special Schedule 7. These ratios have been derived following the financial assessments undertaken by NSW Treasury Corporation on all NSW Councils in 2012, and are now continued to be incorporated into the latest update to the Code of Accounting Practice and Financial Reporting that determines the content of Council’s Financial Statements. These ratios generally look to be presenting either a stable or improving result for Council in Note 24. Council though in relation to the ratios for Special Schedule 7 in terms of Asset Management, whilst showing some improvement generally, still has a ways to go to meet the required benchmarks.
It is also important to note that the ratios and benchmarks outlined in Note 24 to the General Purpose Financial Statements and Special Schedule 7 are on an annual basis. Whilst some of these ratios were also benchmarks in Council’s now historical ‘Fit for the Future’ response, these were reported as a three year average as required. Therefore direct comparison cannot be made based on these reported benchmarks.
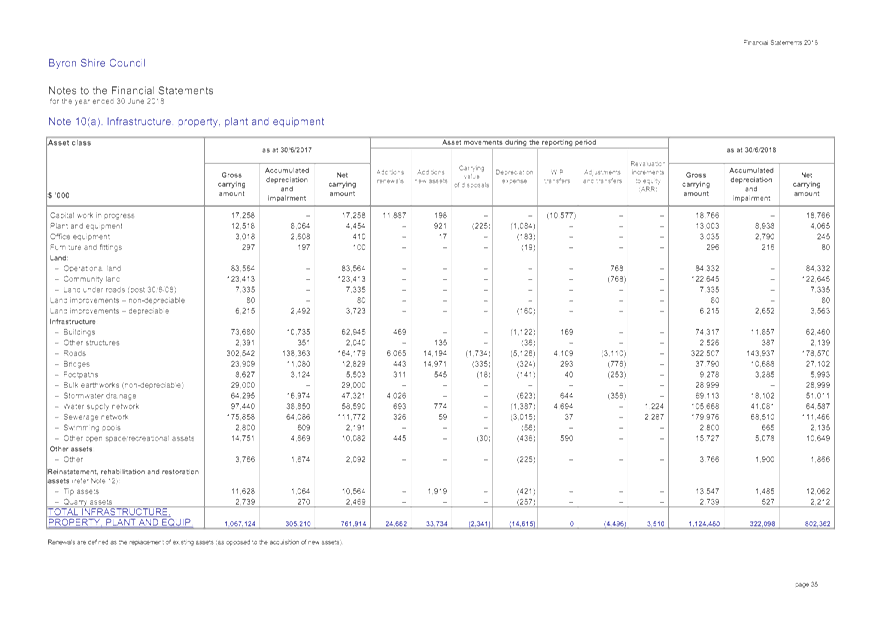
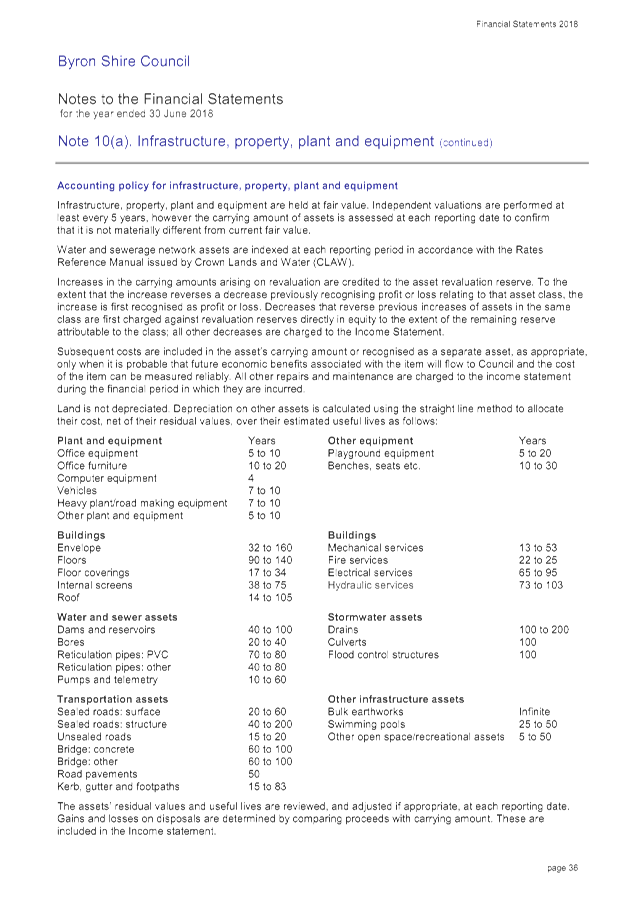
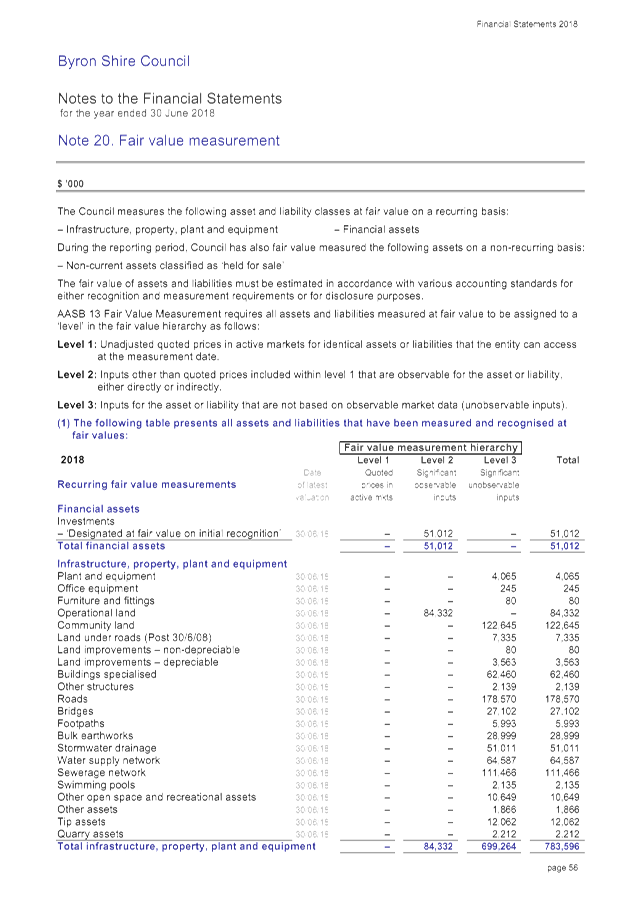
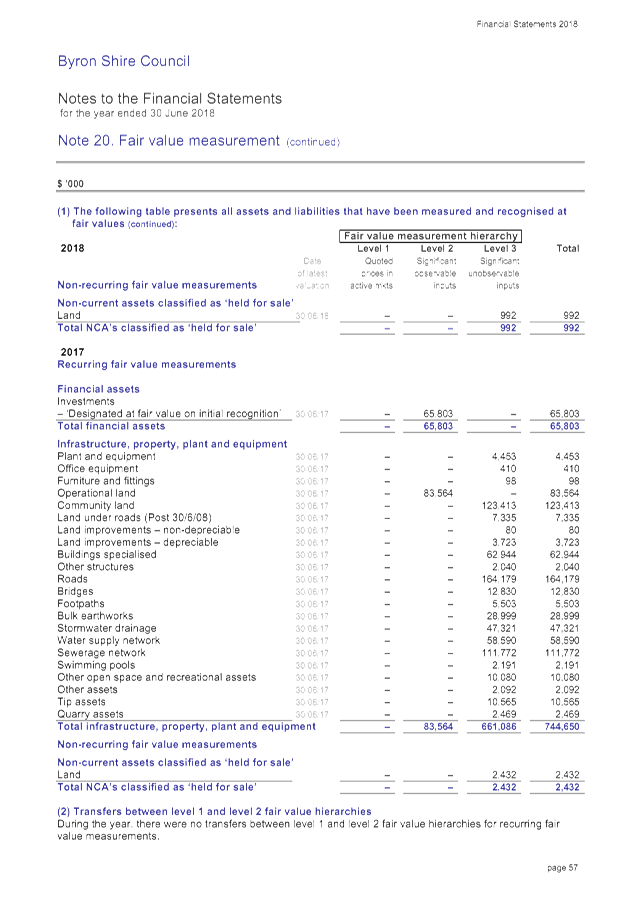
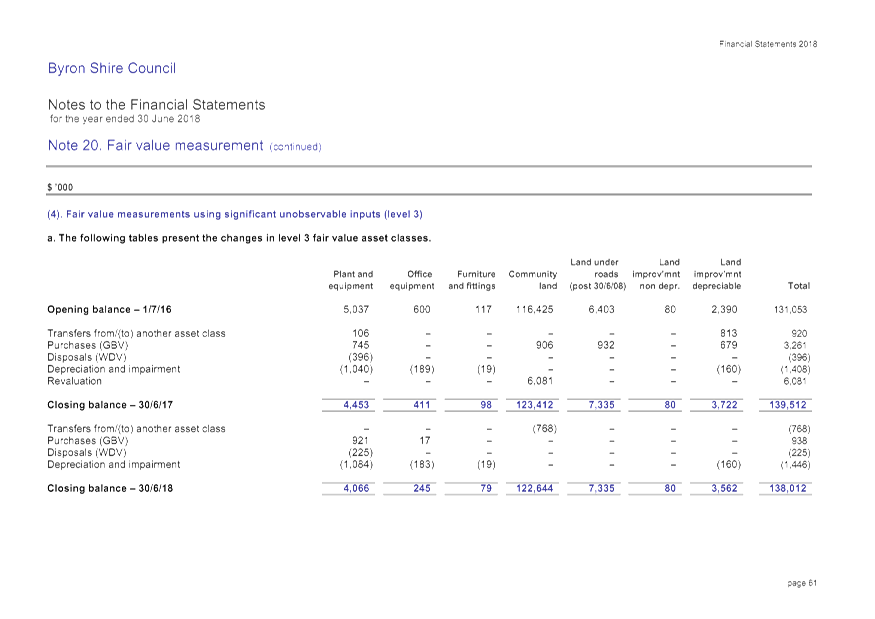
· Asset Revaluations
During 2017/2018, there was no revaluation of assets except for the indexation of Water and Sewerage Assets which is compulsory.
For the upcoming 2018/2019 financial year, Council will need to consider the revaluation of Roads and Drainage assets given these assets have not been revalued since 2015 and are becoming due. Council is conducting a condition assessment of the road network so it would be logical to link that to the revaluation.
· Asset Recognition
Council during the year recognised assets transferred to Council from Roads and Maritime Services relating to the former Pacific Highway in the Brunswick to Yelgun section of the Highway. These assets were under a maintenance agreement that has expired and are now the responsibility of Council. This caused the recognition of asset dedications amounting to just over $26million. This was the major contributor to the overall surplus Council achieved in 2017/2018. Council will now be responsible for the ongoing maintenance and eventual replacement of these assets.
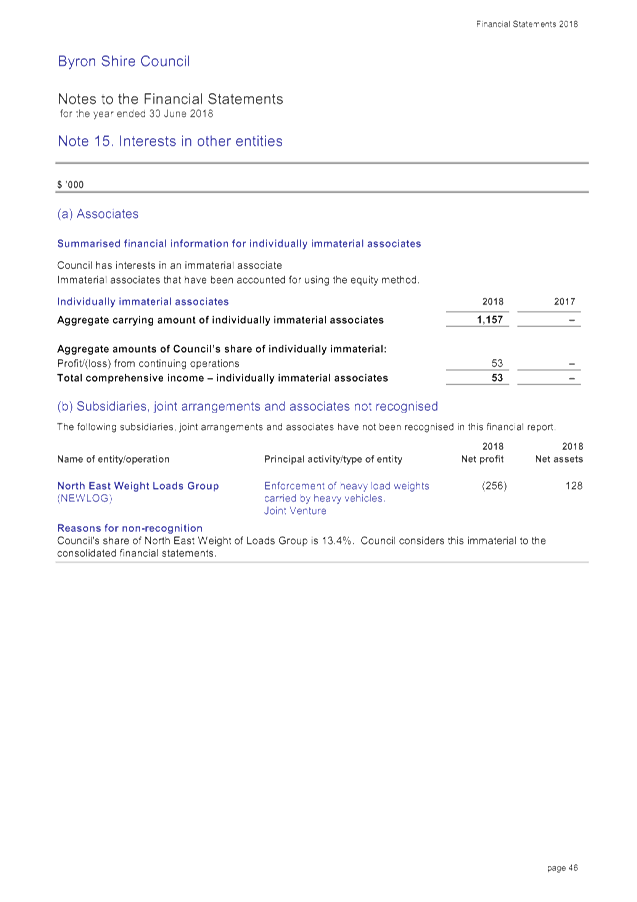
Council for the first time has also recognised a total $1.157million share in the financial statements relating to the Richmond Tweed Regional Library(RTRL). This recognition relates to Council’s 25% share of RTRL following sign off during the financial year of the RTRL agreement with the other member Councils.
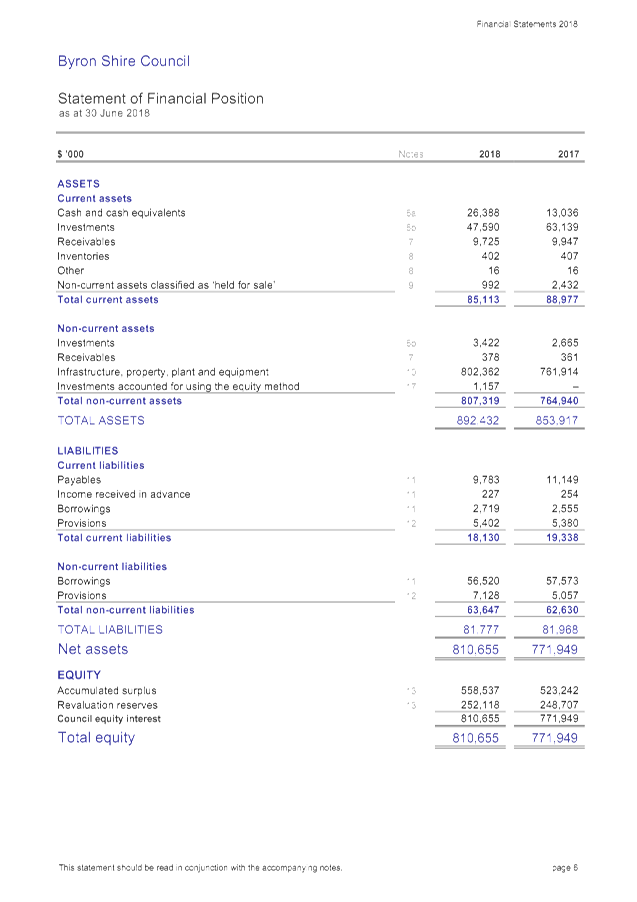
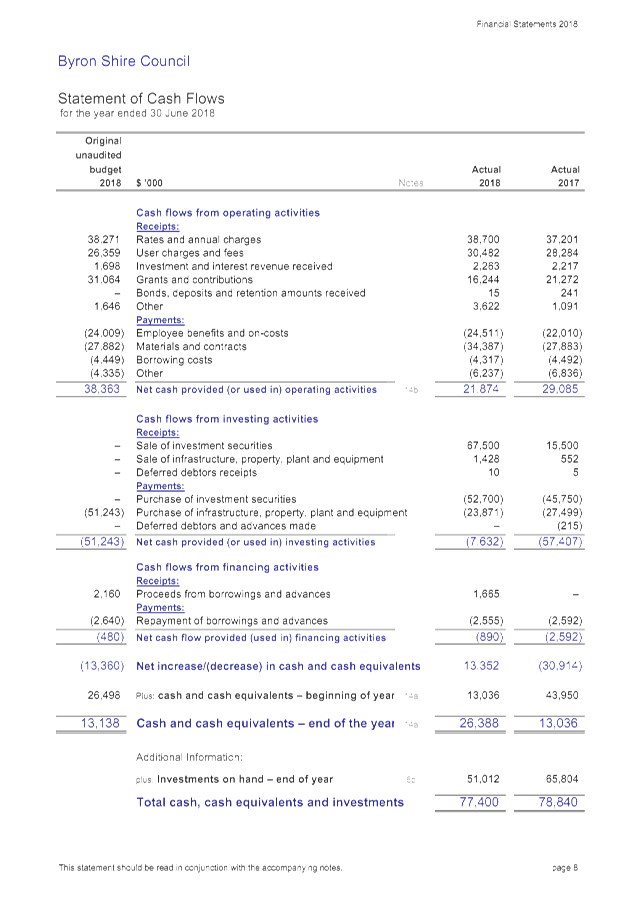
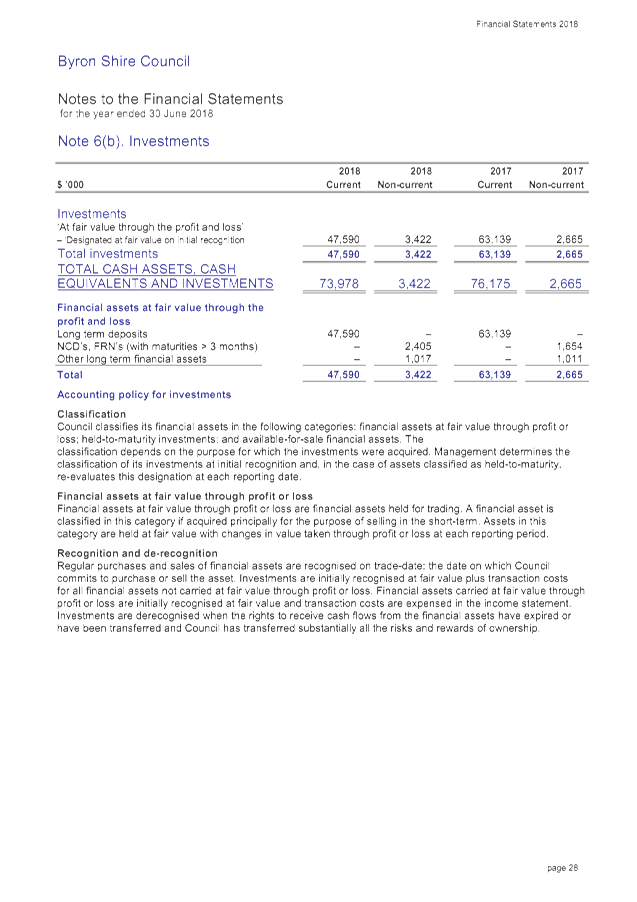
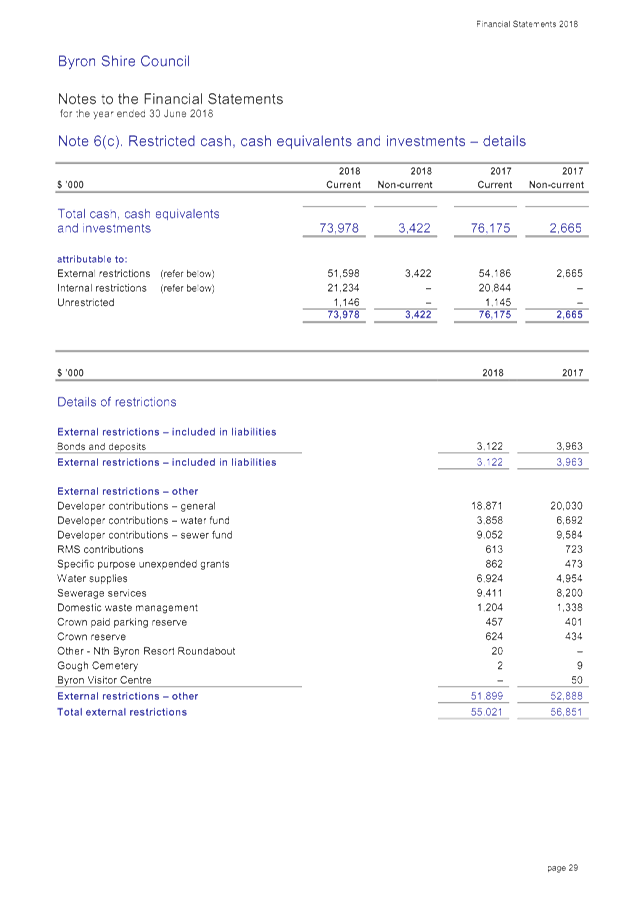
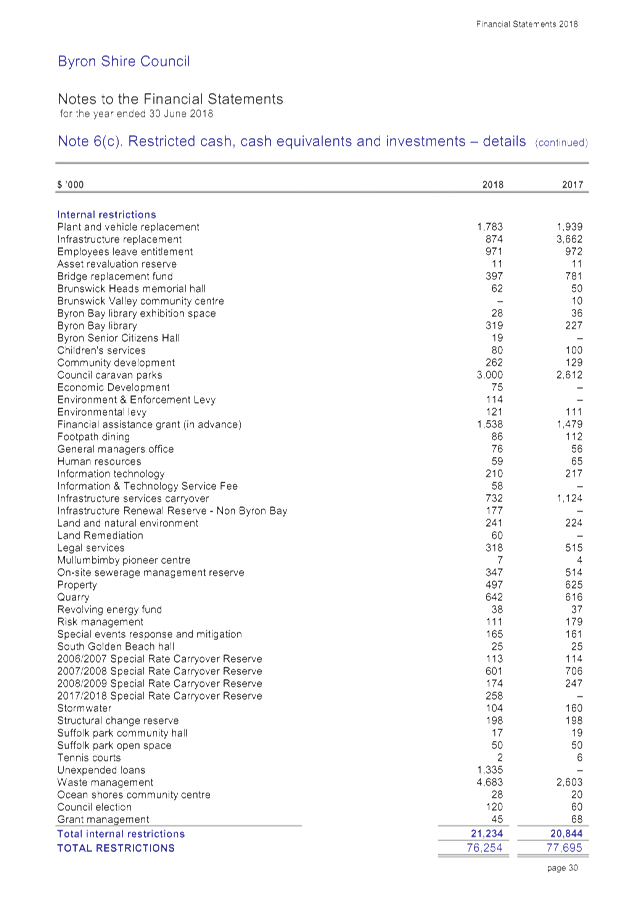
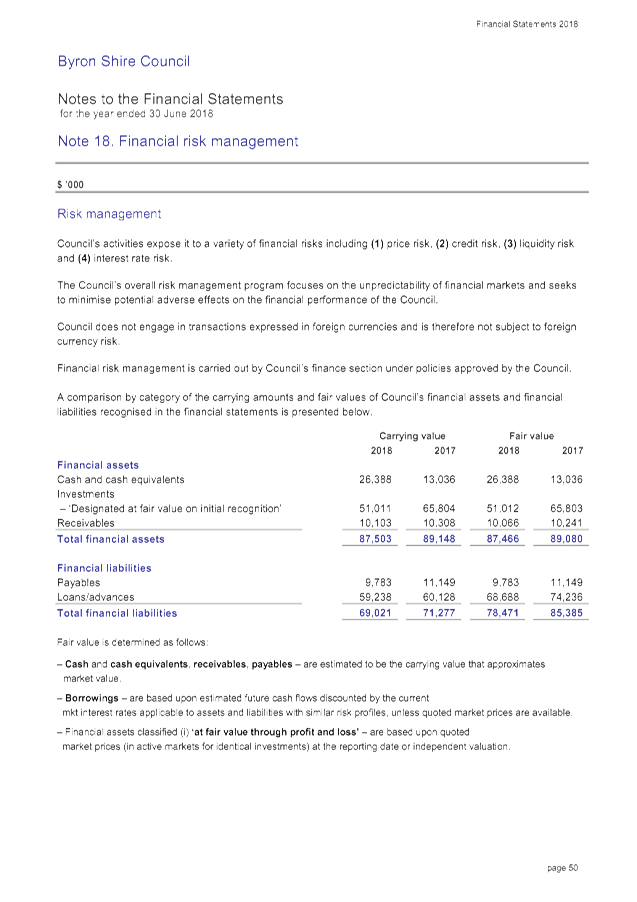
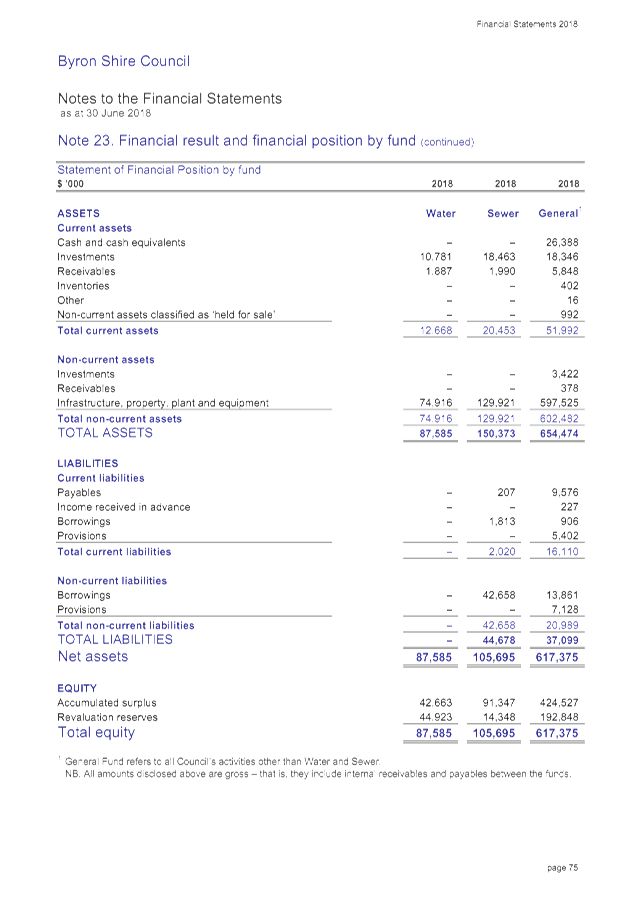
· Cash and Investments
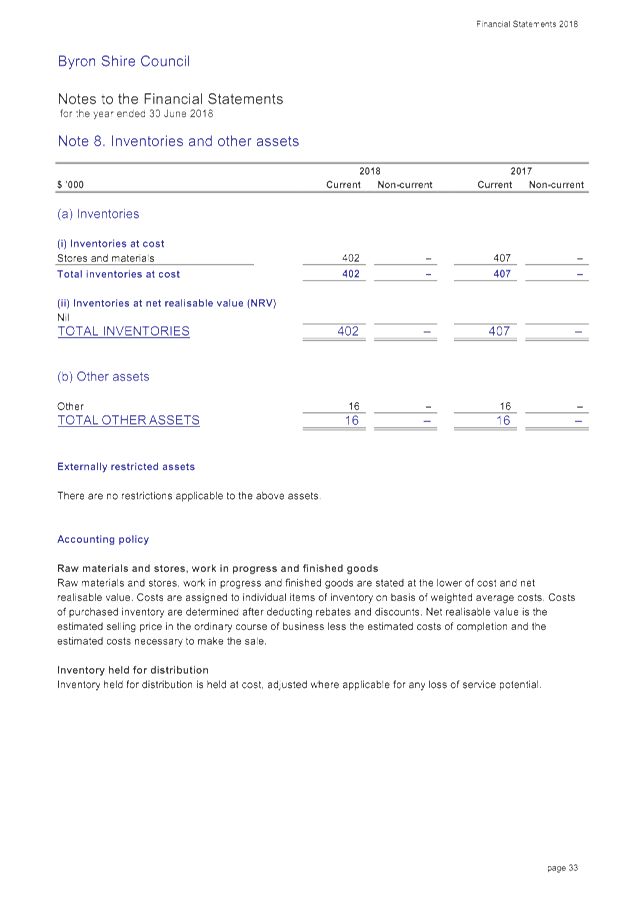
As at 30 June 2018, Council has maintained $1.145million in unrestricted cash and investments being the same level as 2017. This is an ongoing pleasing result and Council has been able to maintain another one of its short term financial goals of reaching unrestricted cash balance of $1million. All other cash and investments totalling $76.254million are restricted for specific purposes. Overall the cash and investment position of Council decreased by $1.440million during the year.
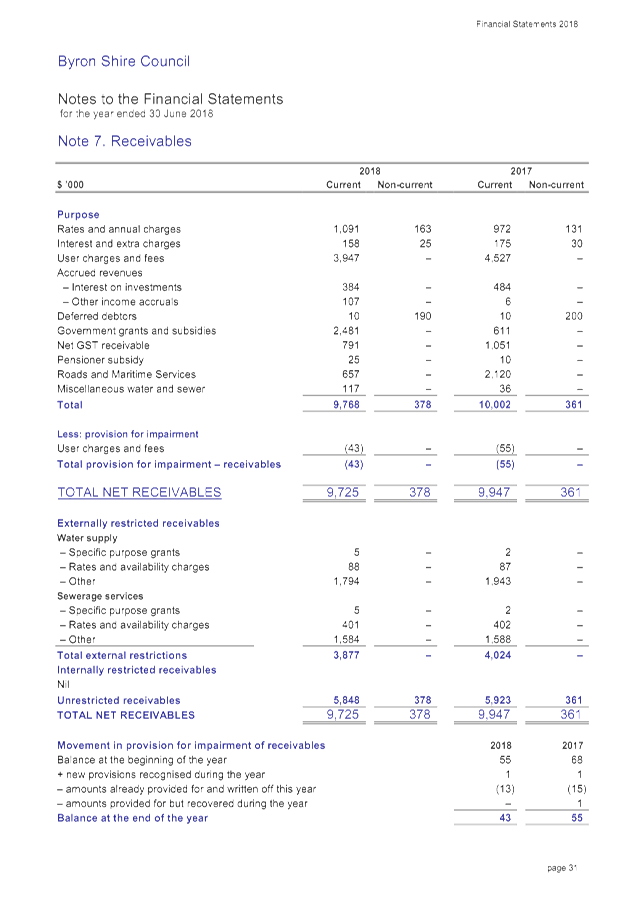
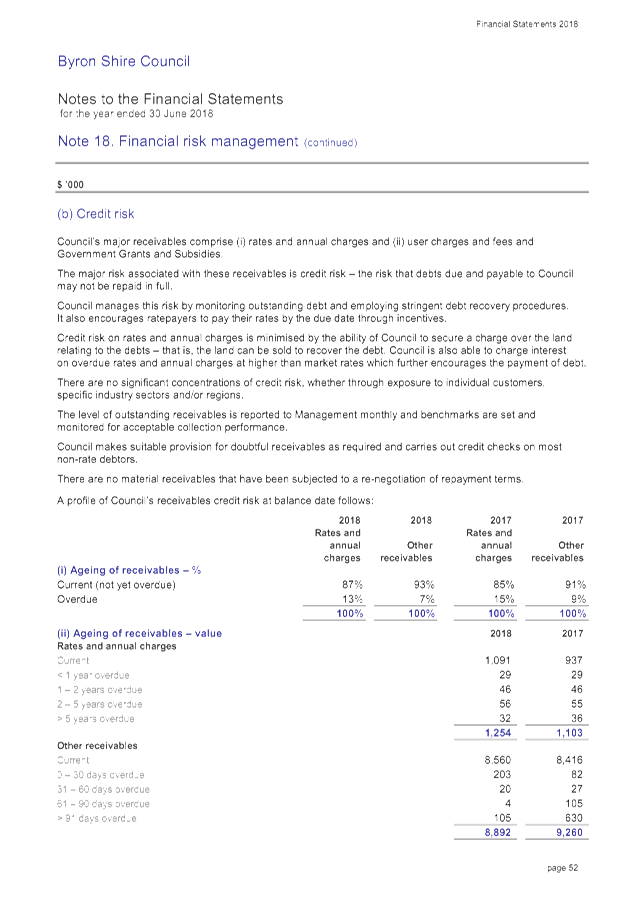
· Receivables
As at 30 June 2018, Council was due $10.103million in receivables. Of this amount $0.657million was due from Roads and Maritime Services for expenditure claims, $0.791million from the Commonwealth Government for Goods and Services Tax and $2.481million in Government grants and subsidies. Overall receivables decreased by $0.205million compared to the 2016/2017 financial year.
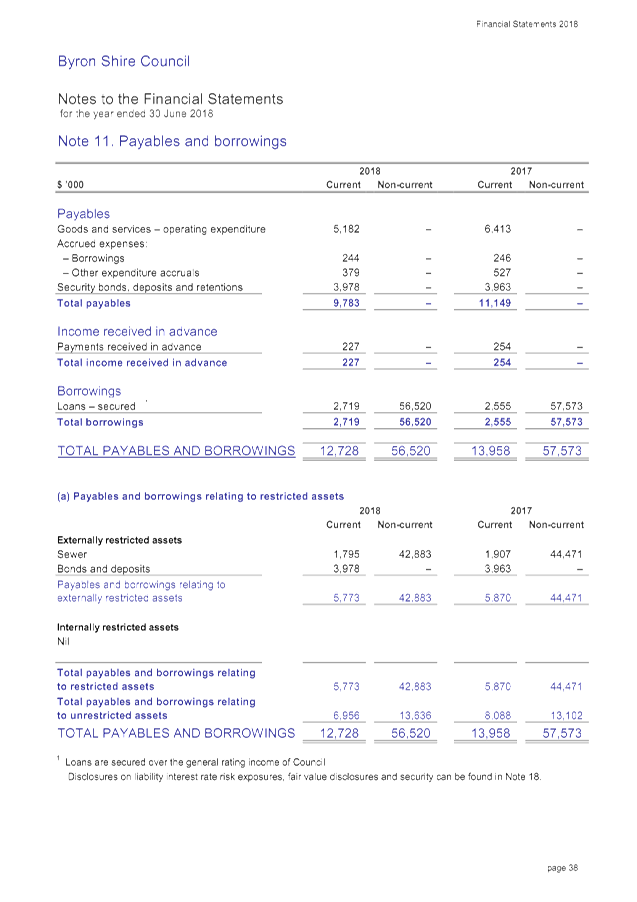
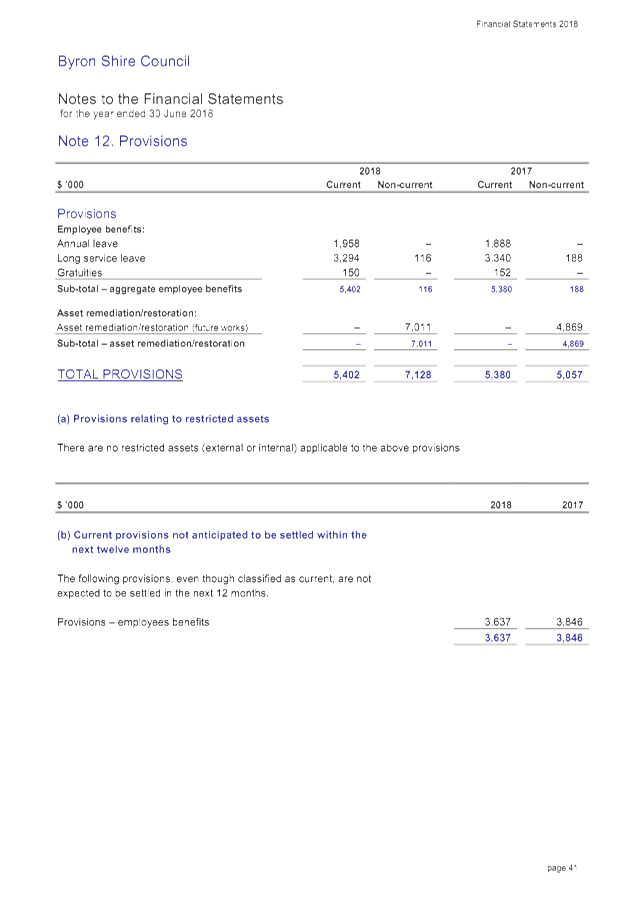
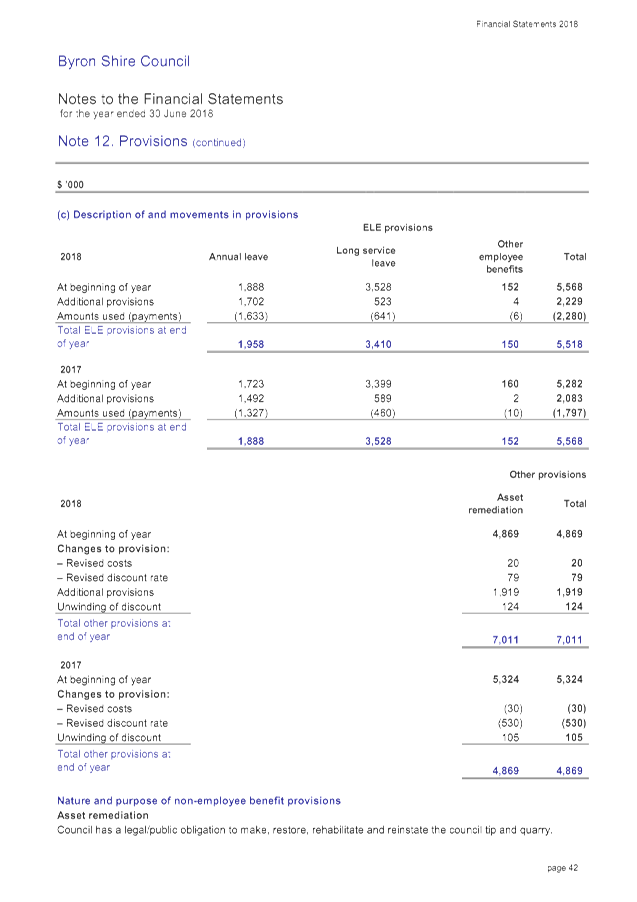
· Payables and Provisions
At 30 June 2018, total payables by Council were $10.010million including $4.204million held in security bonds, deposits, retentions, payments received in advance, $0.623million in accrued expenses and $5.182million payable to suppliers. In addition at 30 June 2018, Council has accrued employee leave entitlements valued at $5.518million. Specific employee leave entitlements include $1.958million for annual leave, $3.410million for long service leave and $0.150million for gratuities. In comparison to 2016/2017, total payables decreased $1.393million whereas total provisions for employee leave entitlements decreased $0.050million.
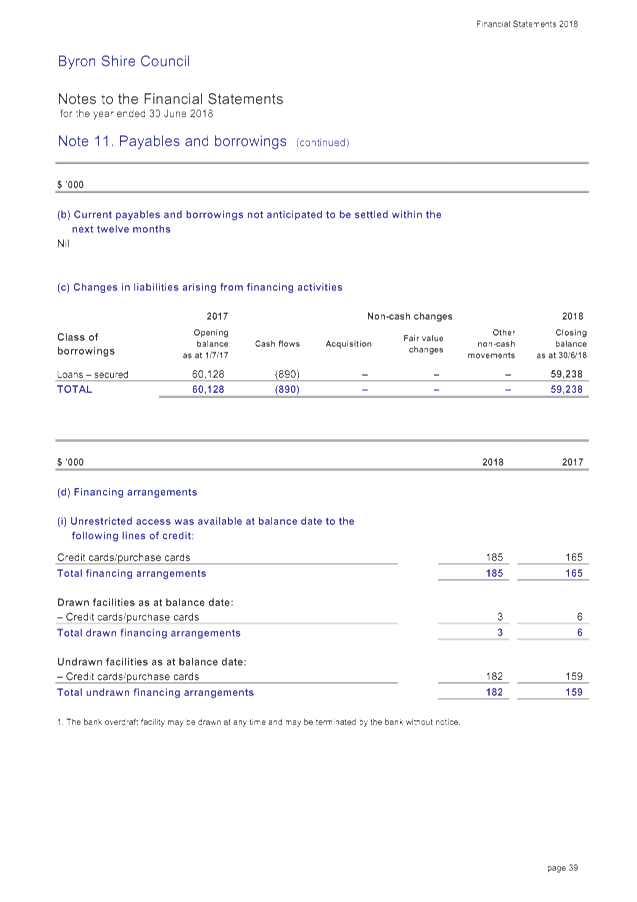
· Loan Borrowings
During 2017/2018 Council borrowed new loans of $1.665million and continued to make normal loan repayments.
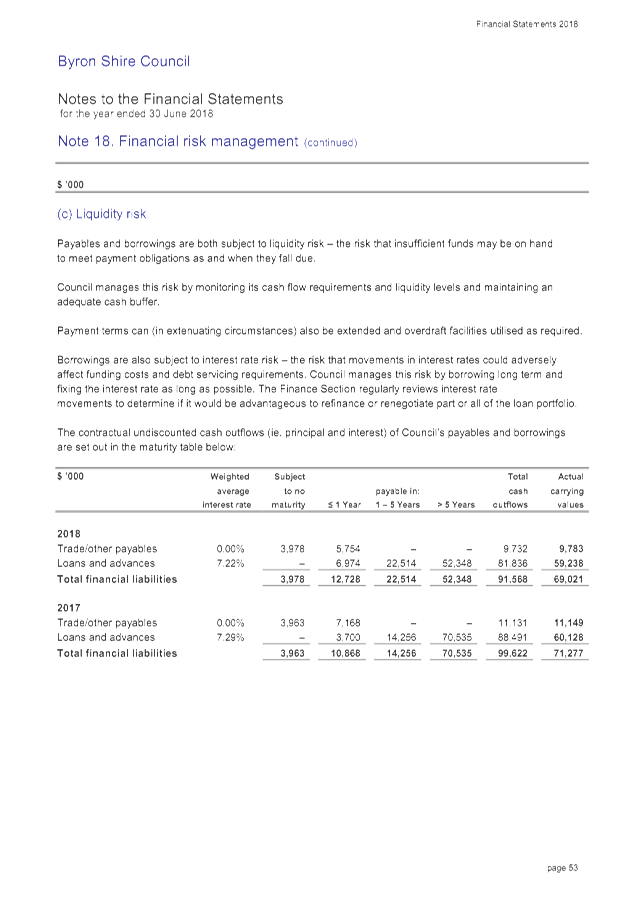
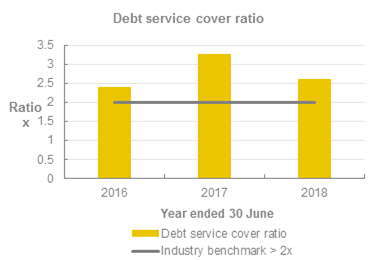
Council’s outstanding loans as at 30 June 2018 are $59.238million. Total loan expenditure for 2017/2018 included interest of $4.439million and principal payments of $2.555million. Total expenditure of Council in 2017/2018 related to loan repayments was $6.994million or 9.42% of Councils revenue excluding all grants and contributions.
Outstanding loans by Fund totalling $59.238million are as follows:
· General Fund $14.767million
· Water Fund $0 – Water Fund is debt free
· Sewerage Fund $44.471million
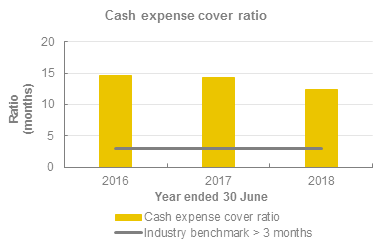
Liquidity
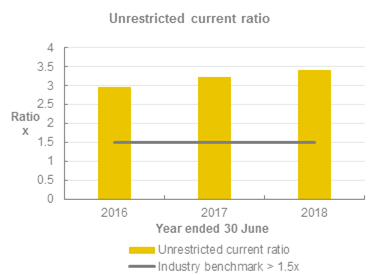
Council’s balance sheet indicates net current assets of $66.983million. It is on this basis in the opinion of the Responsible Accounting Officer that the short term financial position of Council remains in a satisfactory position and that Council can be confident it can meet its payment obligations as and when they fall due. That is, there is no uncertainty as to Council being considered as a ‘going concern’. In addition, Council’s cash expense cover ratio is at 12.33 months whereas the minimum benchmark is 3 months. Council exceeds this benchmark by four times.
Council’s Unrestricted Current Ratio has improved to 3.40 demonstrating Council has $3.40 in unrestricted current assets compared to every $1.00 of unrestricted current liabilities.
However, on a longer term basis Council will need to consider its financial position carefully but in isolation the financial results for 2017/2018 continue to present what could be described as a ‘stable’ financial position for Council.
Financial Implications
There are no direct financial implications associated with this report as the report does not involve any future expenditure of Council funds but it is a report advising the financial outcomes of Council during the 2017/2018 financial year which are identified in this report, Attachments 1 to 3 and the Auditors report to be circulated prior to the 18 October 2018 Ordinary Council Meeting
Statutory and Policy Compliance Implications
Section 413(2)(c) of the Local Government Act 1993 and Regulation 215 of the Local Government (General) Regulation 2005 requires Council to specifically form an opinion on the financial statements. Specifically Council needs to sign off an opinion on the Financial Statements regarding their preparation and content as follows:
In this regard the Financial Statements have been prepared in accordance with:
· The Local Government Act 1993 (as amended) and the Regulations made thereunder.
· The Australian Accounting Standards and professional pronouncements.
· The Local Government Code of Accounting Practice and Financial Reporting.
And the content to the best of knowledge and belief:
· Present fairly the Council’s operating result and financial position for the year.
· Accord with Council’s accounting and other records.
· Management is not aware of any matter that would render the Financial Statements false or misleading in any way.
Section 416(1) of the Local Government Act 1993, requires a Council’s annual Financial Statements to be prepared and audited within four (4) months of the end of that financial year ie on or before 31 October 2018.
Section 417(4) of the Local Government Act 1993 requires, as soon as practicable after completing the audit, the Auditor must send a copy of the Auditor’s Reports to the Departmental Chief Executive and to the Council.
Section 417(5) of the Local Government Act 1993 requires Council, as soon as practicable after receiving the Auditor’s Reports, to send a copy of the Auditor’s Reports on the Council’s Financial Statements, together with a copy of the Council’s audited Financial Statements, to the Departmental Chief Executive before 7 November 2018.
Section 418(1) of the Local Government Act 1993 requires Council to fix a date for the Meeting at which it proposes to present its audited Financial Statements, together with the Auditor’s Reports, to the public, and must give public notice of the date so fixed. This requirement must be completed within five weeks after Council has received the Auditors Reports ie prior to 5 December 2018.
Section 420 of the Local Government Act 1993 requires Council to provide the opportunity for the public to submit submissions on the Financial Statements. Submissions are to be submitted within seven days of the Financial Statements being presented to the public. In the case of the 2017/2018 Financial Statements, closing date for submissions will be 30 November 2018.