Transport and Infrastructure Advisory Committee Meeting
A Transport and Infrastructure Advisory
Committee Meeting of Byron Shire Council will be held as follows:
|
Venue
|
Conference Room, Station Street, Mullumbimby
|
|
Date
|
Thursday, 10 October 2019
|
|
Time
|
9.00am
|
Phillip
Holloway
Director Infrastucture Services I2019/1602
Distributed 03/10/19
What is a “Conflict of Interests” - A conflict of
interests can be of two types:
Pecuniary - an interest that a person has in a matter because of a reasonable
likelihood or expectation of appreciable financial gain or loss to the person
or another person with whom the person is associated.
Non-pecuniary – a private or personal interest that a Council
official has that does not amount to a pecuniary interest as defined in the Code
of Conduct for Councillors (eg. A friendship, membership of an association,
society or trade union or involvement or interest in an activity and may
include an interest of a financial nature).
Remoteness – a person does not have a pecuniary interest in a matter
if the interest is so remote or insignificant that it could not reasonably be
regarded as likely to influence any decision the person might make in relation
to a matter or if the interest is of a kind specified in the Code of Conduct
for Councillors.
Who has a Pecuniary Interest? - a person has a pecuniary interest in a
matter if the pecuniary interest is the interest of the person, or another
person with whom the person is associated (see below).
Relatives, Partners - a person is taken to have a pecuniary interest in a
matter if:
§ The person’s
spouse or de facto partner or a relative of the person has a pecuniary interest
in the matter, or
§ The person, or a
nominee, partners or employer of the person, is a member of a company or other
body that has a pecuniary interest in the matter.
N.B. “Relative”, in relation to a person means any of the
following:
(a) the
parent, grandparent, brother, sister, uncle, aunt, nephew, niece, lineal
descends or adopted child of the person or of the person’s spouse;
(b) the
spouse or de facto partners of the person or of a person referred to in
paragraph (a)
No Interest in the Matter - however, a person is not taken to have a
pecuniary interest in a matter:
§ If the person is
unaware of the relevant pecuniary interest of the spouse, de facto partner,
relative or company or other body, or
§ Just because the
person is a member of, or is employed by, the Council.
§ Just because the
person is a member of, or a delegate of the Council to, a company or other body
that has a pecuniary interest in the matter provided that the person has no
beneficial interest in any shares of the company or body.
Disclosure and participation in meetings
§ A Councillor or a
member of a Council Committee who has a pecuniary interest in any matter with
which the Council is concerned and who is present at a meeting of the Council
or Committee at which the matter is being considered must disclose the nature
of the interest to the meeting as soon as practicable.
§ The Councillor or
member must not be present at, or in sight of, the meeting of the Council or
Committee:
(a) at any
time during which the matter is being considered or discussed by the Council or
Committee, or
(b) at any
time during which the Council or Committee is voting on any question in
relation to the matter.
No Knowledge - a person does not breach this Clause if the person did
not know and could not reasonably be expected to have known that the matter
under consideration at the meeting was a matter in which he or she had a
pecuniary interest.
Non-pecuniary Interests - Must be disclosed in meetings.
There are a broad range of options available for managing conflicts &
the option chosen will depend on an assessment of the circumstances of the
matter, the nature of the interest and the significance of the issue being
dealt with. Non-pecuniary conflicts of interests must be dealt with in at
least one of the following ways:
§ It may be appropriate
that no action be taken where the potential for conflict is minimal.
However, Councillors should consider providing an explanation of why they
consider a conflict does not exist.
§ Limit involvement if
practical (eg. Participate in discussion but not in decision making or
vice-versa). Care needs to be taken when exercising this option.
§ Remove the source of
the conflict (eg. Relinquishing or divesting the personal interest that creates
the conflict)
§ Have no involvement by
absenting yourself from and not taking part in any debate or voting on the
issue as of the provisions in the Code of Conduct (particularly if you have a significant
non-pecuniary interest)
RECORDING OF VOTING ON PLANNING MATTERS
Clause 375A of the Local Government Act 1993
– Recording of voting on planning matters
(1) In this section, planning
decision means a decision made in the exercise of a function of a council
under the Environmental Planning and Assessment Act 1979:
(a) including a decision
relating to a development application, an environmental planning instrument, a
development control plan or a development contribution plan under that Act, but
(b) not including the making of
an order under that Act.
(2) The general manager is
required to keep a register containing, for each planning decision made at a
meeting of the council or a council committee, the names of the councillors who
supported the decision and the names of any councillors who opposed (or are
taken to have opposed) the decision.
(3) For the purpose of maintaining
the register, a division is required to be called whenever a motion for a
planning decision is put at a meeting of the council or a council committee.
(4) Each decision recorded in
the register is to be described in the register or identified in a manner that
enables the description to be obtained from another publicly available
document, and is to include the information required by the regulations.
(5) This section extends to a
meeting that is closed to the public.
Transport and Infrastructure Advisory
Committee Meeting
BUSINESS OF MEETING
1. Apologies
2. Declarations of Interest
– Pecuniary and Non-Pecuniary
3. Adoption of Minutes from
Previous Meetings
3.1 Transport
and Infrastructure Advisory Committee Meeting held on 13 June 2019
3.2 Extraordinary
Transport and Infrastructure Advisory Committee Meeting held on 1 October 2019
4. Staff Reports
Infrastructure Services
4.1 Building
Asset Management Plan..................................................................................... 4
4.2 Sealed
Road Condition Survey update and Road Revaluation progress..................... 136
Staff Reports - Infrastructure Services 4.1
Staff Reports - Infrastructure Services
Report No. 4.1 Building
Asset Management Plan
Directorate: Infrastructure
Services
Report
Author: Craig
Purdy, Asset Engineer
File No: I2019/1413
Summary:
Council has completed a full audit and condition assessment
of all council buildings. From this data a draft Buildings Asset
Management Plan has been created for general fund buildings.
|
RECOMMENDATION:
That the Transport and Infrastructure Advisory
Committee (TIAC) recommend that the draft Buildings Asset Management Plan be
adopted by Council.
|
Attachments:
1 Draft
Buildings Asset Management Plan 2019 to 2029 General Fund (excluding Caravan
Parks), E2019/37319 , page 7⇩ 
2 Buildings
Asset Management Plan Community Levels of Service Report 2019, E2019/39855 ,
page 107⇩
3 Buildings
Asset Management Plan Customer Levels of Service Infographic, E2019/39854 ,
page 133⇩
Background:
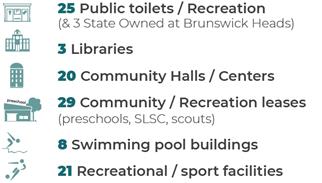
The Buildings
Asset Management Plan (E2019/37319) includes 166 buildings from the
general fund assets class (this excludes Caravan Parks where funds are
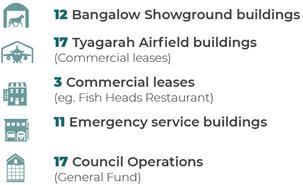
restricted and 3 State owned toilets at Brunswick Heads[1]). These include: public toilets, libraries,
community halls, community / recreation leases, swimming pool, recreation,
Bangalow showgrounds, Tyagarah airfield, commercial leases, emergency services
and Council operation buildings.
A
condition and defect audit was conducted in 2018/19 where 1,600 defects were
identified to prepare a Maintenance Plan and over 12,000 components were
condition assessed and modelled to develop an optimised Capital Works Plan.

|
Our
present funding levels are insufficient to continue to provide existing
services at current levels in the medium term. This conclusion is made
from predictive modelling the current Long Term Financial Plan. Asset
modelling has established an annual capital
renewal gap of $185,567 and annual maintenance target of $1.1M.
There is a once off defect maintenance gap of $1.9M.
|
|
The
community were engaged and rated the ‘quality’ of the public
toilets at 3.6 and community buildings at 2.2 (1 excellent – 5 very
poor). The average ‘technical condition’ of the public toilets is
3.0 and the community buildings 3.3. There are 30% of the buildings in
a poor to very poor condition.
|
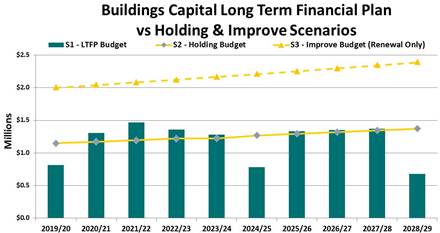
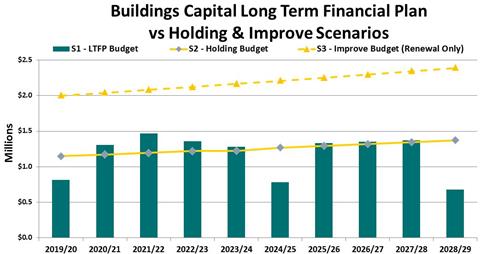
Three funding scenarios were modelled:
Scenario
1 – “Deteriorate” current Long Term Financial Plan
Scenario
2 – “Holding” budget
Scenario
3 – “Improve” budget
The
identified financial gaps indicate building condition and associated service
levels are already falling. This is evident with 30% of buildings in a
poor condition. For example, 1 statutory, 57 safety/
environmental/security defects and 94 structural defects identified. The
funding gaps, whilst challenging, are comparatively small relative to the gap
in roads funding.
Consultation:
The community have been engaged to measure the performance
and importance of the public toilets and community buildings via an online
survey from 8 March to 12 April 2019. The Community Buildings Customer
Levels of Service Survey results can be found in E2019/39855 and E2019/39854.
Staff Reports - Infrastructure Services 4.1 - Attachment 1
 Byron Shire Council
Buildings
 Asset
Asset
Management
Plan
October
2019
Table of contents
Summary. 5
1. Executive Summary. 6
The
Purpose of the Plan. 6
Asset
Description. 6
Levels
of Service. 6
Future
Demand. 7
Lifecycle
Management Plan. 7
Financial
Summary. 7
Asset
Management Practices. 9
Monitoring
and Improvement Program.. 9
2. Purpose. 11
What
is Asset Management?. 11
Objective
of Asset Management 11
Benefit
of Asset Management 11
Related
Council Documents. 12
3. Current Position. 13
Building
Asset Stock. 13
Building
licenses and leases. 14
Emergency
Services (Rural Fire Services and SES) 14
Sports
Facility Buildings. 14
Swimming
Pool Buildings. 14
Tyagarah
Airfield. 14
Section
355 Committees. 15
Public
Toilets. 16
Replacement
Cost of Council’s Buildings Assets. 17
Present
Condition of Council’s Building Assets. 17
Building
Hierarchy. 19
4. Levels of Service. 21
Technical
Levels of Service. 21
Community
Levels of Service. 22
Community
Levels of Service Survey Key Findings. 23
Community
Hall Utilisation. 24
Levels
of Service Summary. 24
5. Future Demand. 27
Demand
Forecast 27
Demand
Management Plan. 27
New
Assets from Growth. 28
6. Asset Management Practices. 29
Financial
Systems. 29
Inspection
Processes. 29
Asset
Management Systems. 29
Changes
in Technology. 29
Accounting
Framework. 30
Standards
and Guidelines. 31
Risk
Management 31
7. Lifecycle Management Plan. 31
Asset
Capacity and Performance. 32
Useful
Lives and Unit Rates. 32
Asset
Valuations. 33
Asset
Condition. 33
8. Maintenance Plan. 33
Maintenance
and Inspection Program.. 34
Public
Toilet Future Maintenance Expenses. 35
Maintenance
Challenges. 36
9. Renewal Plan. 37
Renewal
Prioritisation. 37
Impact
of Deferring Renewal Works. 39
Managing
the Risks and Renewal Challenges. 40
Asbestos. 40
10. New and Upgrade Plan. 41
Selection
Criteria. 41
Developer
Contributions. 41
Forecast
Upgrade/New Expenditure. 41
11. Disposal of Assets. 42
Critical
assets. 42
12. Financial Summary. 43
Funding
Strategy. 43
Financial
Challenges and Gaps. 45
Financial
Useful lives. 45
13. Improvement Plan. 50
Glossary. 52
14. APPENDIX A Special Schedule 7 –
Buildings at 30 June 2018. 56
15. APPENDIX B – Licences & Leases. 57
16. APPENDIX C – Overall Building
Condition. 58
17. APPENDIX D – Capital Works Plan (3
years only) 59
18. APPENDIX E – Asset Levels of Service
Community Engagement 63
19. References. 90
Figures
Figure
1 Asset Management simplified. 11
Figure
2 Building Asset Stock. 13
Figure
3 Overall breakdown of depreciated replacement cost for Building Assets. 17
Figure
4 Building Assets by condition. 18
Figure
5 Building overall condition. 18
Figure
6 Customer & Technical Rating Comparison. 22
Figure
7 Public Toilet Technical Condition vs Customer Quality. 23
Figure
8 Customer Levels of Service Quality Ratings. 23
Figure
9 Community Hall Monthly Utilisation. 24
Figure
10 Top 3 Community Priorities (BSC Survey, 2016) 27
Figure
11 Asset Management Systems and Elements. 30
Figure
12 Asset life cycle stages. 31
Figure
13 Useful life consumption from financial register 32
Figure
14 Asset condition over useful life. 33
Figure
15 Buildings Operations & Maintenance Actuals 2017/18. 36
Figure
16 Capital Modelling Scenarios Compared. 38
Figure
17 Modelling Scenario 10 Year Condition Comparisons. 39
Figure
18 Building Deterioration and Maintenance Curve. 39
Figure
19 Maintenance & Capital Long Term Financial Plan (LTFP) 43
Figure
20 Useful Lives vs Capital Value Record. 45
Figure
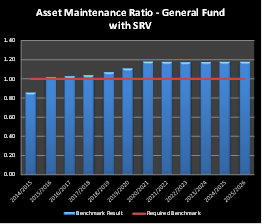
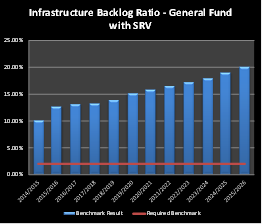
21 Asset Maintenance Ratio General Fund SS7. 49
Figure
22 Infrastructure Backlog Ratio General Fund SS7. 49
Tables
Table
1 Related Council Documents. 12
Table
2 Public Toilet – Customer Levels of Service. 16
Table
3 Condition Grading Model 18
Table
4 Level of Service by Asset Category. 21
Table
5 Buildings Levels of Service – Community & Technical 25
Table
6 NSW population projections regional LG data. 27
Table
7 Demand management plan summary. 28
Table
8 Building Assets useful lives. 32
Table
9 Building asset valuation data (SS7 30 June 18) 33
Table
10 Maintenance & Inspection Program.. 34
Table
11 Public Toilet Operational and Maintenance over 3 years. 35
Table
12 Public toilet Operational and Maintenance tasks. 35
Table
13 Asset Predictor© Modelling Buildings. 38
Table
14 Critical Assets and Service Level Objectives. 42
Table
15 Capital Funding Assetic Predictor© Scenario 1 Deteriorate. 44
Table
16 Maintenance Funding LTFP vs Predictor© Modelling. 44
Table
17 Financial Gaps. 45
Table
18 Asset Consumption Ratios. 46
Table
19 Asset Sustainability Ratio Figures. 47
Table
20 Asset Renewal Funding Ratio Figures. 48
Table
21 Improvement actions summary. 50
 Summary
The Buildings
Asset Management Plan (BAMP) includes 166 building from the general fund
assets class (this excludes Caravan Parks which funds are restricted and 3
State owned toilets at Brunswick Heads[2]).
They are: public toilets, libraries, community halls, community / recreation
leases, swimming pool, recreation, Bangalow showgrounds, Tyagarah airfield,
commercial leases, emergency services and Council operation buildings.
A
condition and defect audit was conducted in 2018/19 where 1,600 defects were
identified to prepare a Maintenance Plan and 12,000 components were condition
assessed and modelled to develop an optimised Capital Works Plan.
Our
present funding levels are insufficient to continue to provide existing
services at current levels in the medium term. This conclusion is made from
predictive modelling the current Long Term Financial Plan. Asset modelling has established an annual capital renewal gap of $185,567
and annual maintenance target of $1.1M. There is a once off defect
maintenance gap of $1.9M.
 The community were engaged and rated the
‘quality’ of the public toilets at 3.6 and community buildings at
2.2 (1 excellent – 5 very poor). The average ‘technical
condition’ of the public toilets is 3.0 and the community buildings 3.3.
There are 30% of the buildings in a poor to very poor condition.
The community were engaged and rated the
‘quality’ of the public toilets at 3.6 and community buildings at
2.2 (1 excellent – 5 very poor). The average ‘technical
condition’ of the public toilets is 3.0 and the community buildings 3.3.
There are 30% of the buildings in a poor to very poor condition.
Three
scenarios were modelled:
Scenario
1 – “Deteriorate” current Long Term Financial Plan
Scenario
2 – “Holding” budget
 Scenario 3 – “Improve” budget
Financial
gap indicates service levels are already falling. This is evident with 30 %
buildings in a poor condition. For example, 1 statutory, 57 safety/
environmental/security defects and 94 structural defects identified.
The
next step is to work on the improvement plan which will focus on:
· prioritise asset renewals over new or building upgrades
· address missing maintenance and inspection gaps such as
gutter maintenance
· plan public toilet renewals over the next 10 years with
consistent effort utilising the technical condition reports and community engagement
feedback
· utilise the optimised capital works plan
· address lease and licence gaps
· improve clarity of inspection and maintenance
responsibilities internally and externally
· optimise operational expenditures to increase available
funds for maintenance
1. Executive Summary
The Purpose of the Plan
Asset management planning is a comprehensive process to
ensure delivery of services from infrastructure is provided in a financially
sustainable manner.
This asset management plan details information about
infrastructure assets including actions required to provide an agreed level of
service in the most cost effective manner while outlining associated risks. The
plan defines the services to be provided, how the services are provided and
what funds are required to provide the services over a 10-year planning period.
The purpose of this Buildings Asset Management Plans is to inform the Byron
Shire Council’s Long Term Financial Plan.
Asset Description
Byron Shire
Council’s (BSC) building assets enable the community to access and enjoy
a range of services and facilities that Byron has to offer. It has an asset
replacement value of $74.3 million for buildings, as at 30 June 18. The
efficient management of the building assets is vital to the community. Buildings
are defined as being a roof structure with walls; they do not include shelter
or shade structures. This Buildings Asset Management Plan (BAMP) includes the
following 166 building categories from the general fund assets class
(this excludes Caravan Parks which funds are restricted and 3 State owned
toilets at Brunswick Heads[3]):
Levels of Service
Our present
funding levels are insufficient to continue to provide existing services at
current levels in the medium term. This conclusion is made from predictive
modelling the current Long Term Financial Plan (Refer to 1.6 Financial
Summary).
The main
services consequences are:
è Public toilets maintenance service will not improve to a
standard that the community expect.
è Public toilet capital renewal is possible over the long
term if current toilets are replaced with low cost kit style toilets and not
expensive self-cleaning toilets like those in Byron Main Beach Park.
è Community buildings have insufficient funds to accommodate
renewal requirements and no new or upgrading of facilities.
è Some building categories have no dedicated funds for
maintenance or capital renewals e.g. Bangalow Showground, Tyagarah Airfield,
and Emergency Services.
è Upgrades and new assets will rely upon grant funding.
Future Demand
The main demands
for new services are created by:
è Population growth
è Changing community expectations
è Development
è Changes in demographic
è Strategic network extensions and upgrades
These will be
managed through a combination of managing existing assets, upgrading of
existing assets and providing new assets to meet demand and demand management.
Demand management practices include non-asset solutions, insuring against risks
and managing failures.
è Fund priority works by seeking grant funding and
implementing the Developer Contributions Plan
è Educate the community on the costs associated with
maintaining current service levels and increased costs required with increased
assets
è Consult with community on options and funding requirements.
è Inform community and manage expectations. Communicate
levels of service and financial capacity to balance infrastructure priorities
with what the community is prepared to fund.
è Monitor and manage development controls.
è Undertake infrastructure planning taking into account land
use changes.
Lifecycle Management Plan
What does it Cost?
The
projected outlays necessary to provide the services covered by this Asset
Management Plan (AMP) includes operations, maintenance, renewal, upgrade and
new assets over the 10-year planning period is $2,589,760 on average per
year.
Financial Summary
What
we will do?
In the
financial year of 2017/18 Council spent $409,534 on maintenance, $1,708,000
on operational activities. It spent $1,543,790 on capital renewals
and upgrades for building assets. Based on the Assetic Predictor©
modelling for capital renewals only needs average at $1.3M over
10 years to hold / maintain the overall condition of the building portfolio.
This work is for capital renewal of assets only and does not account for new or
upgrades to building assets.
Estimated
available funding for this period is $1,074,650 annually in the long
term financial plan. This is insufficient to sustain the current level of
service.
The
infrastructure reality is that what is funded in the long term financial plan
is not going to hold / maintain the assets and overall the condition will
decline with current funding. The emphasis of the Asset Management Plan is to
communicate the consequences that this will have on the service provided and
risks, so that decision making is “informed”. The modelling scenarios
in this plan needs to inform the Council’s Long Term Financial Plan.
The
allocated funding leaves a shortfall of $185,567 on average per year of the projected expenditure required
to provide services in this plan compared with planned expenditure currently
included in the Long Term Financial Plan (LTFP).
A complete audit of the buildings and has identified 1,600 identified defects
to bring assets to a satisfactory standard. This is estimated at $1.9
million and is currently unfunded[4].
This is shown in the Projected Maintenance /
Operational and Capital Expenditure and the Financial Gaps figures over the
page with the maintenance gap illustrated in the first year.

Projected Maintenance
/ Operating and Capital Expenditure

Financial
gap indicates service levels are already falling. This is evident with 30 %
buildings in a poor condition. For example, 1 statutory, 57
safety/environmental/security defects and 94 structural defects
identified.
We plan to provide Building services for the following:
è Operation, maintenance and renewal of buildings to meet
service levels set by in annual budgets.
è In 2019/20 Council has allocated $60,000 to the Brunswick
Memorial Hall for a commercial kitchen upgrade. This is the only capital
upgrade within the 10-year planning period.
What we cannot do?
We currently do not
allocate enough funding to sustain these services at the desired standard or to
provide all new services being sought. Works and services that cannot be
provided under present funding levels are:
è Upgrade or provide new buildings
Managing the Risks?
Our present
funding levels are insufficient to continue to manage risks in the medium term.
The main risk
consequences are:
è Gutters and downpipe replacement is not being addressed
when needed resulting in water damage to the internal and or external walls.
è Roof replacement not complete when needed resulting in
water damage to the ceiling, fitout and fittings, and carpets. This can cause
mould damage and require relocation of users until addressed e.g. Mullumbimby
Administration Building.
è Programmed asbestos replacement to comply with Australian
Standards e.g. replacing internal wall sheeting, soffits, eaves, and flooring
in community Halls etc. (Marvel Hall)
è Closing of buildings such as public toilets that become
unsafe for use.
è Air condition systems requiring replacement increase
reactive maintenance and operational costs e.g. Mullumbimby Administration
Building
è Public toilets that are reaching overall poor condition are
still operational, however, the community are very dissatisfied with the level
of service. This is a perceived public perception is a risk.
è Budgets are not allocated to building categories as defined
in this plan. As such deferred renewals are likely and maintenance issues not
being addressed.
We will
endeavour to manage these risks within available funding by:
è Maintaining an asbestos register
è Amend leases and licences to ensure general maintenance
e.g. gutters cleaning is detailed
è Review brining forward air condition renewals at
Mullumbimby Administration Building
è Provide high risk defects for maintenance repairs
Asset Management Practices
Our systems to
manage assets include:
è Authority Asset Register, Capital Value Record Module and
Work Orders
è Asbestos Register
è Geographical Information Systems to identify and map all
buildings
è A contracted centralised Fire Protection web services
è Predictor© Modelling to inform the long term capital
works program
è Reflect mobile solutions to inspect assets
Since the 2019
asset inspection assets requiring renewal/replacement are identified from
defect repairs in the Building Maintenance Plan and 10 year capital from the
modelling software. This is to improve the process and apply a planned asset
management response.
Monitoring
and Improvement Program
The next steps resulting
from this asset management plan to improve asset management practices are:
è Specialised inspections as required e.g. asbestos, pest
extermination
è Further refine renewal forecasts based on condition audits
using Assetic Predictor© to provide continuous improvement
è Council approval/endorsement of this Plan to communicate
levels of service and a commitment to process improvement
è Develop unit rates to calculate required maintenance for
all asset sub-types e.g. gutters, roof, carpet, roller doors etc.
è Formalise the new, renewal and disposal policies,
è Test current levels of service to determine if
they’re achievable
It should be
noted that this Asset Management Plan is not a stand-alone document and is
closely related to Council’s Strategic Asset Management Plan and other
significant Council documents. Council will measure the effectiveness and
application of the asset management plan through:
è Stakeholder consultation
è Regular condition and maintenance inspections
è Continued use of Assetic Predictor© to predict renewal
requirements
è Continuous review and improvement to asset management
practices
è Key Performance Indicators (KPI) monitoring and recording
of customer levels of service
Key Findings
The financial challenge is to address the one off defect
maintenance gap of $1.9M.
Asset modelling has established an annual capital renewal gap of $185,567 &
annual maintenance target of $1.1M.
To “hold / maintain” the overall building portfolio
condition
the average capital renewal needs to be $1.3M annually.
The actual maintenance budget averages at $410,000 (excluding operational costs).

The buildings had an operational cost of $1,708,000 in 2017/18.
Asset Management needs to balance Levels
of Service & whole of life cycle costs.
30% of buildings are in a poor condition.
The community rated the quality of
Public toilets 3.6 & community buildings 2.2.
The technical condition of public
toilets 3.0 & community buildings 3.3
(1 Excellent and 5 Very Poor)
The community expectation of Public
Toilets is higher than what
current budgets can afford over the Long Term Financial Plan.
Asset management systems are well
established & integrated,
however, work is required in the Work
Order system to improve splits between maintenance and operational costings.
Byron leads asset management with the
latest technology and innovation.
The average ‘useful life’ is lower than industry standard
due to deferred renewals and reduced
preventative maintenance.
Spending on building upgrades reduces
the ability to optimise on required capital renewals, this results in deferring on renewals
and will result in higher future capital expenditure.
There are 19 items identified in the Improvement Plan.
2.
Purpose
What is Asset Management?
Asset
management is the planning, acquisition, operation, maintenance, renewal and
disposal of assets. In simple terms, asset management is about the way in which
assets are looked after, both on a day-to-day basis (i.e. maintenance and
operations) and in the medium to long-term (i.e. capital renewal and forward
planning). Asset management ensures that Council’s assets are capable of
providing services, of an agreed quality, in a sustainable manner, for present
and future communities.
This
asset management plan is prepared to meet legislative and organisational
requirements for sustainable service delivery and to inform long term financial
planning and reporting.
Objective of Asset Management
Good
asset management takes a proactive approach to asset maintenance and planning
in order to avoid costly and dangerous asset failure.
This
asset management plan aims to meet the required levels of service in the most
cost-effective way for present and future communities (Figure 1).
Asset Management needs to balance Levels of Service
and
whole of life cycle costs.
Figure 1 Asset Management
simplified
Benefit of Asset Management
Asset
management delivers benefits in improved accountability, sustainable service
delivery, risk reduction and financial management and forecasting.
Improving
Council’s asset management practices will enable optimised spending by
doing more with less through knowing what assets we own, what condition
they’re in and by monitoring the effect of our actions.
Doing more with less.
Related
Council Documents
This
Buildings Asset Management Plan sets out the implementation of Council’s
Asset Management Strategy for the long-term management of its building assets
in a financially responsible manner. It determines recommended service levels,
inspection regimes and proactive maintenance routines to keep the building
assets in safe and serviceable conditions. In order to do this effectively,
other Council policies, strategies and plans have been considered to determine
their impact on this Asset Management Plan and ensure overall alignment.
Table 1 Related Council Documents
|
Key
Council Documents
|
Relationship
|
|
Strategic
Asset Management Plan (SAMP) - E2016/100839
|
Outlines
the framework for the management of Byron Bay Council’s General Fund
Infrastructure assets to deliver Council’s Vision.
|
|
Halls
and Venues Guidelines for S355 Committees and Boards (E2016/79739)
|
Outlies
the guidelines for hall volunteers maintenance responsibilities etc.
|
|
Byron
Shire Developer Contribution Plan 2012 (Section 94) - E2015/540
|
Links
to Future Demand, Section 6.
|
|
IPART
Determination of Council’s Application for Special Variation for
2017-18 – E2017/54521
|
Links
to the Financial Statement Projections and Funding Strategy, Section 13.
|
|
IPART
Application of Councils Special Variation for 2017-18 – E2017/15274
|
Links
to the Customer Levels of Service tables, Section 5.
|
|
Workforce
Plan 2017-2021 – E2017/19709
|
Links
to Renewal, New and Upgrade Plan.
|
|
Long
Term Financial Plan 2016-2026 – E2017/8695
|
Links
to the Financial Statement Projections and Funding Strategy, Section 13.
|
|
Transport
and Infrastructure Advisory Committee
|
Defines
the adopted sealed roads levels of service
|
|
Community
Consultation and Engagement Report – Funding our Future - E2017/80803
|
Document
that relays the key findings of the communities’ expectations of
council, it was created for the community engagement and awareness strategy
for the Special Rate Variation.
|
|
Final
Published Byron Shire Council Financial Statements 30 June 2018 (E2018/85029)
|
Useful
Lives
|
|
Buildings
Maintenance Plan 2019 (E2019/20878).
|
Building
Maintenance Plan Section 8.
|
|
Community
Buildings Customer Levels of Service Survey E2019/39855 and E2019/39854
|
Customer
Levels of Service Section 4
|
3.
Current Position
Building Asset Stock
Byron
Council manages 166 general fund buildings. This Asset Management Plan takes
into consideration all Council building assets as follows and excludes 3
toilets that are State Owned at Brunswick Heads[5].
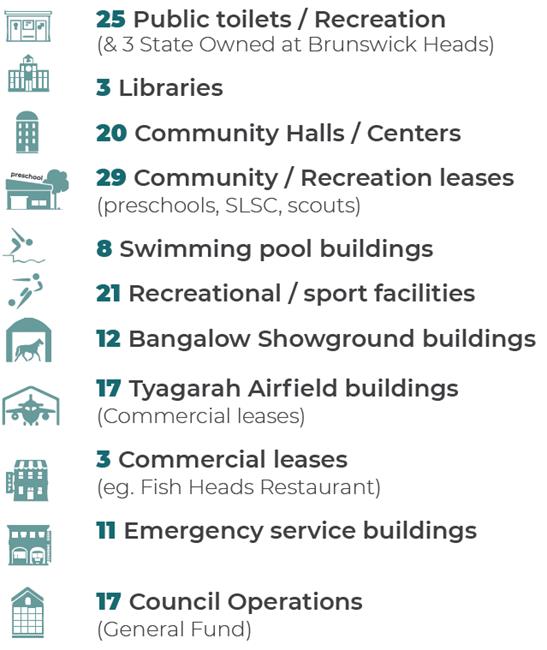
Figure 2 Building Asset Stock
Building licenses and leases
Council
has 5 licenses and 36 leases over sites that contain buildings (Appendix B). In
some cases there may be multiple leases for one building when rooms are
separately leased. Many of the leases are ‘holding over’ which
means they operate on a month to month basis.
For
lease buildings Council is responsible for the building structure. Prior to a
lease being prepared an inspection is carried out and a “dilapidation
report” prepared.
Council
holds a lease as a monthly tenant with the State Rail Authority for the Rural
Fire Service Fire Station Billinudgel. The terms of the lease require
Council to maintain and keep the premises in good and substantial condition and
repair, and fence appropriately.
Emergency Services (Rural Fire Services
and SES)
Council
has 11 Emergency Services buildings on its land and has management
responsibility for all 11 buildings. However, the maintenance responsibilities
are not defined by a lease or licenses which details these responsibilities, as
per the Maintenance Plan, Section 8.
Sports Facility Buildings
Council
has 20 individual sporting facility buildings across 10 sports fields. Council
does not issue leases or licences to users, however a Sports Field User
Agreement is signed at the change of seasons. In this document the ‘Facility’
means the change rooms, toilets, canteen, kiosk and clubhouse. The
Agreement detail users’ maintenance responsibilities and states that all
structural, electrical switchboards, roof harness and fire activities are the
responsibility of Council. As per the Maintenance Plan, Section 8 (Table 10), the
‘Sports Field User Agreement’ should define responsibilities for
the following maintenance activities:
· Window cleaning
· On site management systems & grease traps
· Painting
· Roller doors/gates
· Roof and gutter cleaning
· Back flow prevention devices
This
item has been added to the Improvement Plan, Section 13.
Swimming Pool Buildings
Council
has 2 swimming pool facilities located at Byron Bay and Mullumbimby. These
facilities operate under 3 year contracts. The responsibilities are defined as
per the Maintenance Plan, Section 8.
Tyagarah Airfield
Council
has 17 buildings at the airfield with 16 that have commercial leases and one
with a Hire Agreement (the Aero Club next to the disused hanger). These
commercial leases are all “holding over” until such time
that Council determines the long term strategic plan for the facility (Appendix
B Lease List).
Section 355 Committees
Thirteen
Council buildings are managed by Section 355 Committees with authority
delegated by Council under S377 of the Local Government Act. They manage
bookings, hiring, collection of hire fees and bonds, and undertake minor
maintenance. All finances are managed via a monthly reconciliation to Council.
The
buildings are:
1. Bangalow
A & I Hall
2. Bangalow
Showground
3. Brunswick
Heads Memorial Hall
4. Brunswick
Valley Community Centre
5. Durrumbul
Hall
6. Heritage
House Bangalow
7. Lone
Goat Gallery
8. Marvell
Hall
9. Mullumbimby
Civic Hall
10. Ocean
Shores Community Centre
11. South
Golden Beach Hall
12. Suffolk
Park Community Hall
13. Bangalow
Heritage House
General
Terms of Reference
· To maximise income and promote optimum usage of the
facility.
· To care for and maintain the facility, through responsible
day to day management.
· To ensure the safety of the patrons, contractors and
volunteers at the facility.
· To provide short and long-term strategic marketing
direction for the facility.
· To ensure compliance with Council policies and all relevant
legislation.
· To ensure compliance with Council's adopted fees and
charges, Work, Health and Safety and other legislation relevant to the
operations of the facility.
· To provide recommendations to Council for function
improvements and/or upgrades to the facilities.
· To source and secure grant funding opportunities for Council's
consideration.
· To plan and undertake fund raising activities as required.
· To develop procedures for equity of access to the
facilities for the local community.
· To ensure that negative impacts on the environment and
neighbours are minimised.
· To strive for a "break-even" or profitable annual
financial position (after all operational, short and long-term maintenance,
building insurance and other costs).
Asset
maintenance responsibilities are detailed in Section 8, of the Halls and Venues
Guidelines for S355 Committees and Boards (E2016/79739). Simply the committees
are responsible for general maintenance and Council is responsible for
structural long term capital renewals as well as health and safety
requirements, accessibility and inclusion, compliance matters, asset protection
(asset management planning e.g. re-roofing, external painting, structural
inspections etc., security, and regular fire equipment inspection).
Public Toilets
Council
has 28 public toilets. There are 3 Crown owned public toilets at Brunswick
Heads, Torikina, Banner Park and The Terrace. The community perceives these as
Council owned and managed toilets. However these toilets are only cleaned by
Council and long term capital renewal is the responsibility of the Reflections
Holiday Park Board. Associated issues have been noted in the Improvement Plan,
Section 13.
Management
of the Council public toilets is split across Council departments. Cleaning is
managed by Utilities Services, daily maintenance such as
hygiene/plumbing/vandalism etc. is managed by Social & Cultural Planning
and building ownership sits with Open Spaces. Responsibility for long term
capital management is not currently defined by the organisation. Customer
levels of service vary depending upon location and usage. Six public toilets
are not currently Disability Access Act (DDA) compliant. This is detailed in
Table 2 below.
Table 2 Public Toilet –
Customer Levels of Service
|
Toilet
|
Manual Cleaning Service Frequency
|
Hygiene Services Frequency
|
Level of Service (1-5)
|
DDA
|
|
Brunswick Heads Banner Park - CROWN OWNED
|
Daily,
twice daily in peek
|
Monthly
|
1
|
YES
|
|
Brunswick Heads Terrace Park - CROWN OWNED
|
Daily,
twice daily in peek
|
Monthly
|
1
|
YES
|
|
Brunswick Heads SLSC - CROWN BSC
|
Daily,
twice daily in peek
|
Monthly
|
1
|
NO
|
|
Byron Bay Clarkes Beach - CROWN BSC
|
Daily,
twice daily in peek
|
Monthly
|
1
|
YES
|
|
Brunswick Heads Torakina Park - CROWN OWNED
|
Daily,
twice daily in peek
|
Monthly
|
1
|
YES
|
|
Byron Bay Main Beach Carpark - CROWN BSC
|
Daily,
twice daily in peek
|
Monthly
|
1
|
YES
|
|
Byron Bay SLSC - CROWN BSC
|
Daily,
twice daily in peek
|
Monthly
|
1
|
YES
|
|
Byron Bay Apex Park/Main Beach - CROWN BSC (Exeloo self cleaning
every 500 uses)
|
Daily,
twice daily in peek
|
Twice Weekly
|
1
|
YES
|
|
Byron Bay Railway Park
(Exeloo self cleaning every 500 uses)
|
Daily,
twice daily in peek
|
Twice Weekly
|
1
|
YES
|
|
Byron Bay Apex Park/Main Beach - CROWN BSC (Exeloo self cleaning
every 500 uses)
|
Daily,
twice daily in peek
|
Twice Weekly
|
1
|
YES
|
|
Suffolk Park Gaggin Park
|
Daily
|
Monthly
|
2
|
YES
|
|
South Golden Beach
|
Daily
|
Monthly
|
2
|
YES
|
|
Bangalow Railway Park
|
Daily
|
Monthly
|
2
|
YES
|
|
Bangalow Pool / Weir
|
Daily
|
Monthly
|
2
|
YES
|
|
Mullumbimby Civic Hall Park
|
Daily
|
Monthly
|
2
|
YES
|
|
Byron Bay Recreation Grounds
|
Daily
|
Monthly
|
2
|
NO
|
|
Mullumbimby Rec Ground - CROWN BSC
|
Daily
|
Monthly
|
2
|
NO
|
|
Mullumbimby Station Street Carpark
|
Daily,
twice daily in peek
|
Monthly
|
2
|
YES
|
|
Bangalow Sports Fields - Community Land
|
Daily
|
Monthly
|
2
|
YES
|
|
New Brighton Sports Field
|
Daily
|
Monthly
|
2
|
YES
|
|
Ocean Shores Waterlily Park
|
Weekly
|
Monthly
|
3
|
YES
|
|
Mullumbimby Heritage Park Tennis Courts
|
Weekly
|
Monthly
|
3
|
YES
|
|
Brunswick Heads Recreation Grounds - CROWN BSC
|
Weekly
|
Monthly
|
3
|
YES
|
|
Federal Parklands - CROWN BSC
|
Weekly
|
Monthly
|
3
|
NO
|
|
Suffolk Park Sports Fields
|
Weekly
|
Monthly
|
3
|
YES
|
|
Tyagarah Airfield
|
Weekly
|
Monthly
|
3
|
NO
|
|
Byron Bay Butler Street Market Ground
|
Weekly
- Wednesdays
|
Monthly
|
3
|
NO
|
|
Cavanbah Centre (Sth Toilet Block)
|
Weekly
|
Monthly
|
3
|
YES
|
Replacement Cost of Council’s
Buildings Assets
The
replacement value of Council’s building asset portfolio is $74.3
million with a written down cost of $62.7 million. The annual
depreciation is $993,863 as at 30 June 2018. The break-up of
Council’s Building asset portfolio by replacement value is illustrated in
the following diagram.
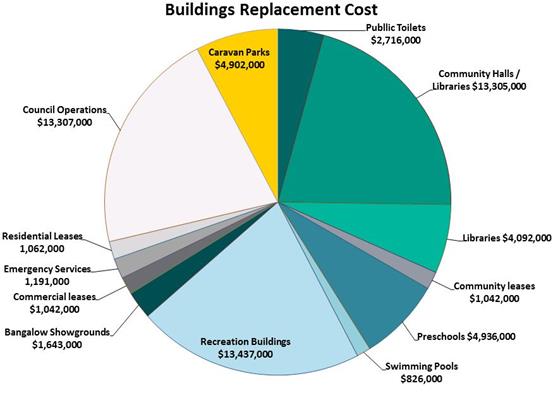
Figure 3 Overall breakdown of
depreciated replacement cost for Building Assets
Present Condition of Council’s
Building Assets
The
work undertaken to develop this Plan identified 1523 defects. By understanding
the condition of Council’s assets and the various types of impact that
affect them, Council is better placed to seek to maintain a level of service
that meets community expectations and minimise the risk of asset failure. Asset
failures can lead to legal liability if Council is found to have acted
unreasonably in the management of its assets.
There
are many reasons why assets fail/deteriorate to the point where they do not
meet performance standards and community expectations, including e.g. a lack of
maintenance. The following identify the asset criticality categories based on
the identified defects:
· Functional (874) e.g. clearing of gutters, water damage, rotting
timbers
· Aesthetics (497) e.g. water damage, mould, holes, graffiti,
cracked tiles
· Structural (94) e.g. beam corrosion, movement, column
cracks, timber rotting
· Safety/Environmental/Security (57) e.g. Disability access
non compliance, trip hazards, window locks not working, missing fire
extinguisher, exit not illuminated, asbestos
· Statutory (1) e.g. loose wires on Byron Surf Club veranda
Each
building element was individually condition assessed then an overall condition
was determined for each building using a complex weighted average condition
score. Refer to Appendix C for this formula calculation. Table 3 Condition
Grading Model, is a general condition grading model that explains each
description of condition using a 1 to 5 grading score that is consistent across
all asset types in Council.
Table 3 Condition Grading Model
|
Condition Grading
|
Description of Condition
|
|
1
|
Excellent: Asset in excellent condition. No maintenance required.
|
|
2
|
Good:
Asset is in good condition
with limited signs of wear. Only requires cyclic maintenance and is not
requiring special attention.
|
|
3
|
Fair:
Asset is in useable
condition with extensive signs of wear. Asset requires some attention
to prevent further deterioration and to return it to a condition so that it requires
only cyclic maintenance.
|
|
4
|
Poor:
Asset is in poor condition
or is faulty. It needs urgent attention to return it to a useable condition
and or significant renewal/rehabilitation is required to reduce risk.
|
|
5
|
Very Poor: Asset has
failed or is at the end of its life or is physically unsound or poses
significant risk. It requires replacement and is beyond rehabilitation.
|
A
simplified model derived from Table 3 is set out in Figure 4 below. Condition
Excellent (1) and Good (2) have been combined into GOOD, and Poor (4) and Very
Poor (5) into POOR.
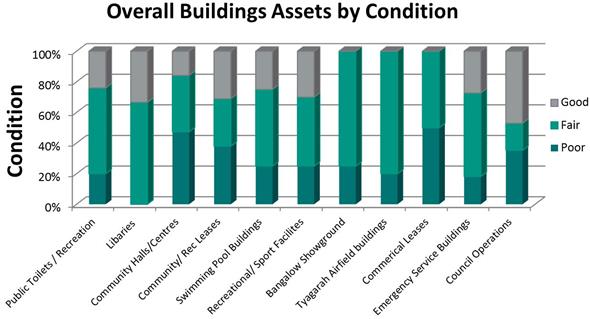
Figure 4 Building Assets by
condition
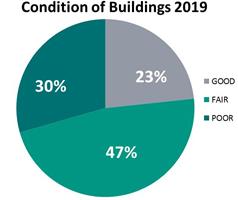
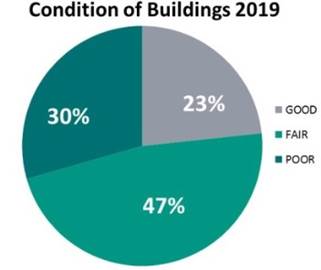
Figure 5 Building overall condition
Overall
23% of Council’s buildings are in Good condition, 47% in Fair condition
and 30% in Poor condition (Figure 5). It is recommended that Council’s
strategic focus over the next 10 years should be on reducing the percentage in
poor condition.
30 % of buildings are in poor condition
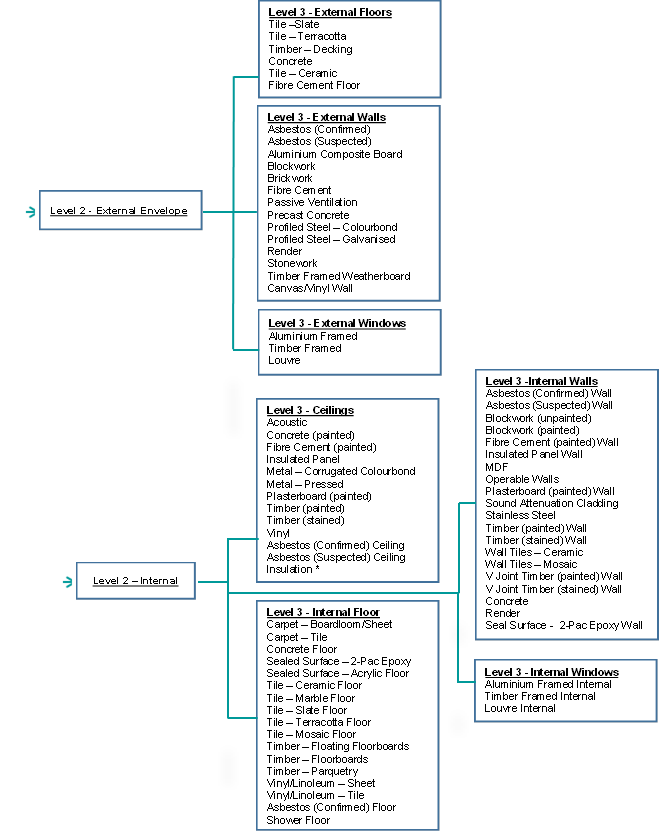
Building Hierarchy
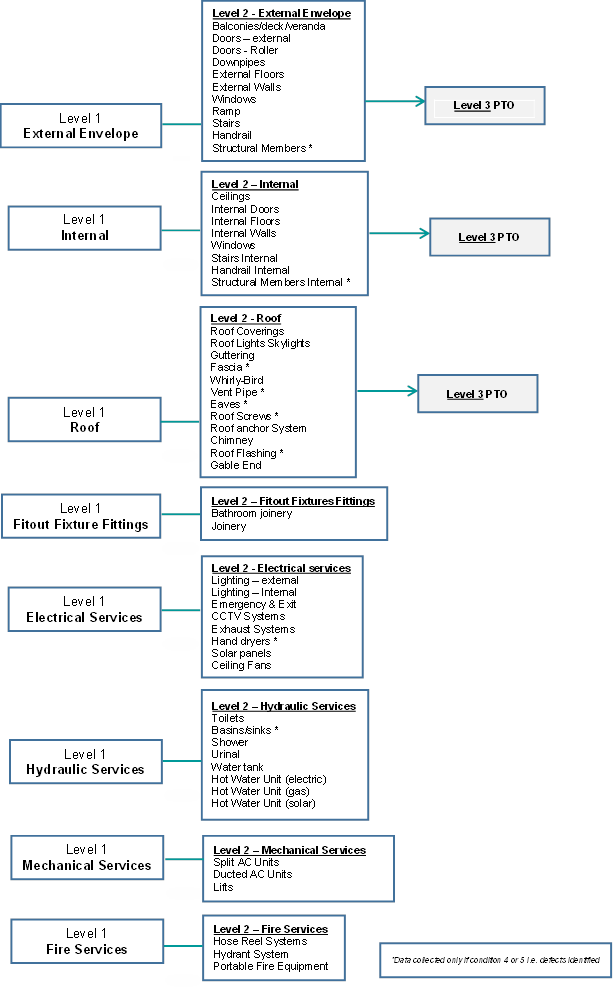 Buildings are categorised into
the
following 3 levels. As the useful
lives
of elements differ, this
has
asset and financial implications.
4. Levels
of Service
A key
objective of this Asset Management Plan is to identify the current
‘Levels of Service’ (LoS) provided by Council’s asset
portfolio. The levels of service defined in this section will be used to:
· Clarify the level of service that our customers should
expect.
· Identify works required to meet these levels of service.
· Identify the costs and benefits of the services offered.
· Enable Council and customers to discuss and assess the
suitability, affordability and equality of the existing service level and to
determine the impact of increasing or decreasing this level in future.
The
levels of service for these Building Assets are based on legislative
requirements, customer research and expectations, and Council’s strategic
goals. There are two tiers of levels of service; Customer Levels of Service and
Technical Levels of Service.
Technical Levels of Service
Technical
Levels of Service are long term, tactical tools developed to measure, monitor
and manage functions of service over time with regard to quality of assets
managed, quantities of assets contributed or constructed, operational and
capital expenditure (Table 4 Level of Service by Asset Category).These
technical measures relate to the allocation of resources to service activities
that the organisation undertakes to best achieve the desired community outcomes
and demonstrate effective organisational performance. Legislative requirements,
infrastructure standards and industry guides combine to strongly influence
Technical Levels of Service. The following are also defined:
· New Assets, upgraded or reconstructed assets
· Maintenance – intervention points and responsiveness
Table 4 Level of Service by Asset Category
|
Level
Of Service
|
Importance Rating
|
Category
Primary Function / facility types
|
Score
|
|
1
|
High
|
Libraries
Child
care centres & preschools
Council
Administration Offices
Public
Toilet – Brunswick, Byron & Mullumbimby CBD’s
(cleaned daily & twice in peek periods)
|
>21
|
|
2
|
Medium High
|
Halls
(dependant on use)
Swimming
Pool Buildings
Public Toilets – High
visitation areas (cleaned daily)
|
10 - 15
|
|
3
|
Medium
|
Halls
(dependant on use)
Public
Toilets – moderate visitation (cleaned weekly)
Council
Operations - manned depots
Showground
Office Buildings
Tyagarah Airfield
|
5 - 9
|
|
4
|
Medium Low
|
Show
ground stalls, pavilions
Council
operations – unmanned
|
>1
|
|
5
|
Low
|
Storage
sheds & Garages
|
= 0
|
LoS =
(Development x Frequency) + Population (Refer to Appendix C for more detail).
Community Levels of Service
Community
Levels of Service are a reflection of the Technical Levels of Service being
delivered to the community. They are derived through community engagement
undertaken to better understand levels of satisfaction with service, service
utilisation and desired levels of service. Levels of Service may also be
derived from informal community feedback and complaints (see Table 5 on p 24).
Community
levels of service measures used in asset management planning are:
Quality How
good is the service?
Function Does
it meet users’ needs?
Capacity/Utilisation Is
the service usage appropriate to capacity?
A
Building Asset Management Survey was conducted to consult the community in
order to measure and rate the performance and importance of eight criteria
(Table 5). The Overall rating of toilets was 3.6 and community buildings
at 2.2 (1 Excellent to 5 Very Poor), indicating that generally the
community is satisfied with the community buildings. With respect to importance
the top three categories were:
è Cleanliness (Quality)
è Functionality
è Overall Condition (Quality)
The
public toilet average ratings were compared. The average customer quality was
rated at 3.6 and technical condition at 3.0, refer to Figure 6Error! Reference source not found.. This indicates that the community expects a higher level
of service than Council provides. This is also relevant in terms of the survey
feedback in which respondents listed many requirements including: no graffiti,
baby change tables, paper towels, hand dryers, soap, single sex toilets as
opposed to multi-use cubicles, and no stainless steel toilets without seats
that are unpleasant in winter. The responses indicate the community prioritises
renewed modern and clean toilets above more toilets.
Figure 6 Customer & Technical Rating Comparison
The
overall public toilet category has been ranked by condition and customer
quality into Good, Fair and Poor (Figure 7). Whilst results are similar, Figure
7 shows a mismatch between the Technical Levels of Service rating and the
customer quality rating.
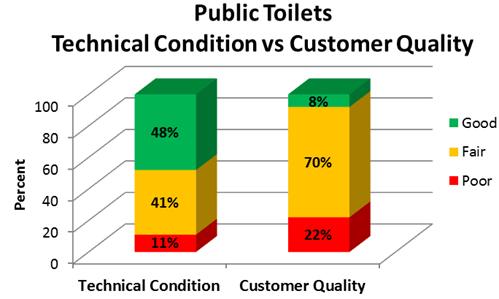
Figure 7 Public Toilet Technical Condition vs Customer Quality
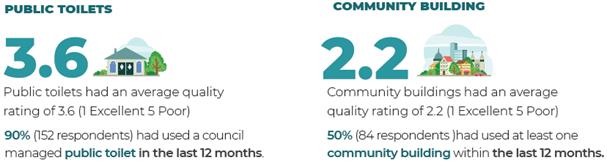
Figure 8 Customer Levels of Service Quality Ratings
The community rated the quality of public toilets 3.6 and community buildings 2.2
The technical condition rating of public toilets 3.0 and community buildings 3.3
(1 Excellent and 5 Very Poor)
Community Levels of Service Survey Key
Findings
è Public toilet maintenance and cleaning is the key area of
public dissatisfaction.
è A third of people who provided a response on public toilets
felt there were adequate toilet facilities or preferred a focus on renewing or
upgrading existing facilities over provision of new facilities. Public safety
should be given priority e.g. locks on doors and lighting.
è Brunswick Heads attracted a lot of negative comments and is
the location of the 3 state owned public toilets in the Shire.
è The public appears to be generally satisfied with community
buildings with a quality rating of 2.2 (other than public toilets). Upgrades
were sought to improve disability access.
è In the general comments section the majority of comments
related to public toilets.
è There were a number of negative comments on the new
self-cleaning unisex toilets. There does not appear to be a high level of
satisfaction with these facilities.
è A number of respondents made unfavourable comparison with
facilities on the Gold Coast.
Refer
to Appendix E for the full Community
Engagement Report & Infographics
document.
Community Hall Utilisation
Use of the community halls and centres has been analysed
over both summer and winter months using sample data from the online calendar
booking system. Figure 9 below clearly indicates that the Brunswick Valley
Community centre is being fully utilised with an average of 253 hours per month
with the Durrumbul Hall at the lowest with just 56 hours per month. When it
comes to measuring Customer Levels of Service, use of facilities is one of the
key criteria. This is a point in time snapshot and can be remeasured to assist
with Future Demand planning.
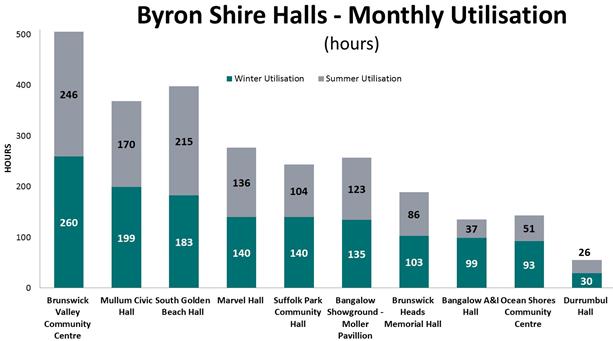
Figure 9 Community Hall Monthly Utilisation
(E2019/28051)
Together
the Community and Technical Levels of Service
provide detail on service performance, cost and whether service levels are
likely to stay the same, improve or deteriorate. Council’s current and
projected levels of service are documented below. These Key Performance
Indicators (KPI’s) for Levels of Service have been developed using the
following tools:
è Council’s Customer Request Management System
è Surveys – community satisfaction survey
è Focus Groups – Infrastructure and Transport Advisory
Committee
è Facebook feedback
è Inspections and condition assessments
The community expectation for Public Toilet service
levels is higher than
current budgets can accommodate in the medium term.
Levels of Service Summary
Council’s
present funding levels are insufficient to continue to provide existing
services at current levels in the medium term. This conclusion is made from
predictive modelling in the current Long Term Financial Plan (Refer Financial
Summary, Section 12). Funding levels therefore need to be reconsidered.
Table 5 Buildings Levels of Service – Community & Technical
|
COMMUNITY LEVELS OF SERVICE – PUBLIC TOILETS
|
|
Key
Performance Measure
|
Level
of Service
|
Performance
Measure Process
|
Performance
Target
|
Current
Performance
|
|
Performance rating
overall condition 1 to 5 (1 excellent – 5 very poor)
|
|
Quality
|
Satisfactory and suitable
public toilets
|
Customer Requests for public
toilets
|
<80 customer requests per
year public toilets (cleaning, plumbing, graffiti etc. per year)
|
118 Customer Requests per
year (2017/18)
|
|
Quality
|
Performance rating overall
condition 1 to 5
(1 excellent to 5 very poor)
|
Customer Levels of
Service Survey[6]
|
Not achieved Condition 3 -
Fair
|
3.6[7]
|
|
Capacity
|
Provide public toilets at
regular intervals across the CBD and Open Spaces
|
Customer requests / consultation
feedback1
|
Where renewal is required
consider location closer to playgrounds & recreational facilities as per
community survey.
|
Sufficient supply public
toilets across the shire.
|
|
|
|
COMMUNITY LEVELS OF SERVICE – COMMUNITY BUILDINGS
|
|
Key
Performance Measure
|
Level
of Service
|
Performance
Measure Process
|
Performance
Target
|
Current
Performance
|
|
Quality
|
Overall condition - what
was the condition of floor coverings, lights, walls & ceilings?
|
Customer Levels of
Service Survey
|
Achieved Condition 3 - Fair
|
2.34 4
|
|
Quality
|
Overall cleanliness - was the
kitchen, toilets, change rooms clean?
|
Customer Levels of
Service Survey)
|
Achieved
Condition 3 – Fair
|
2.214
|
|
Quality
|
Cost - was the building value
for money, in your opinion?
|
Customer Levels of
Service Survey
|
Achieved Condition 3 –
Fair
|
1.844
|
|
Function
|
Functionality - did the
spaces (rooms & kitchens) serve your purpose?
|
Customer Levels of
Service Survey
|
Achieved Condition 3 –
Fair
|
2.244
|
|
Function/ Accessibility
|
Disability access - did it
have appropriate ramps, rails and toilets
|
Customer Levels of
Service Survey
|
Achieved Condition 3 –
Fair
|
2.394
|
|
Capacity
|
Capacity - did the building
cater to the number of users?
|
Customer Levels of
Service Survey
|
Achieved Condition 3 – Fair
|
2.184
|
|
Available
|
Availability - were there
lots of date options for you to choose from?
|
Customer Levels of
Service Survey
|
Achieved Condition 3 - Fair
|
2.04
|
|
Ave. Rating
|
|
|
|
2.2
|
|
TECHNICAL LEVELS OF SERVICE – PUBLIC TOILETS
& GENERAL FUND BUILDINGS
|
|
Performance
Measure
|
Level of Service
|
Performance Measure Process
|
Performance Target
(Agreed Sustainable Position [8])
|
Current Performance [9] 2018
|
|
Operations
|
Buildings meet user’s
needs
|
Condition & safety
inspections
|
As per Maintenance Plan
(E2019/20878) and Table 10 Maintenance & Inspection Program
|
To be reviewed. Added to
Improvement Plan.
|
|
Buildings are clean
*Other buildings (emergency
services, residential, showgrounds, Commercial leases, airfield, community
leases, council operations, swimming pool)
|
Cleaning
responsibility/frequency
|
Buildings cleaning
responsibility as per Maintenance Plan, Section 8. Public Toilets refer Table
2 Public Toilet – Customer Levels of Service
|
Buildings cleaning
responsibility as per Maintenance Plan, Section 8. Public Toilets refer Table
2 Public Toilet – Customer Levels of Service
|
|
Budget Council Administration
Building
|
Total
$ “To be determined”
|
$291,383
|
|
Budget Cavanbah Centre
|
Total
$ “To be determined”
|
$
7,819
|
|
Budget Libraries
|
Total
$ “To be determined”
|
$137,352
|
|
Budget Public Toilets
|
Total
$ “To be determined”
|
$460,140
|
|
Budget Community Halls /
Centres
|
Total
$ “To be determined”
|
$ 44,407
|
|
Budget Recreational
Facilities
|
Total
$ “To be determined”
|
$ 70,223
|
|
Budget *Other Buildings
|
Total
$ “To be determined”
|
$ 98,871
|
|
|
Total
$ “To be determined”
|
(R2019/36175)
TOTAL
$1,110,196
|
|
Maintenance
|
Buildings are suitable for
purpose
*Other buildings (emergency
services, residential, showgrounds, Commercial leases, airfield, community
leases, council operations, swimming pool)
|
Reactive service requests
completed to schedule
|
TBD % defects made safe
within 5 working days
(Defect = Statutory,
Environmental & Safety)
TBD % of repairs within 30
working days
|
TBD e.g.
below: < 80% of defects made safe within 5 working days<60% of repairs
in 30 working days
|
|
Planned maintenance
activities accomplished from Maintenance Plan (Defects)
|
85% of planned maintenance
activities completed to schedule in accordance with component hierarchy
priority on Statutory, Environmental & Safety
|
To be determined e.g.
below:
<90% completed
|
|
Number of recorded defects in
condition 4, or 5 (poor to very poor)
|
1600 defects identified in
2019
(estimated at $1.46million)
|
$214,197 actual in 2018 to address
defects
|
|
Maintenance Administration
Building
|
$
51,796
|
$111,298
|
|
Maintenance Budget Cavanbah
Centre
|
$229,881
|
$ 15,589
|
|
Maintenance Budget Libraries
|
$
31,468
|
$ 44,410
|
|
Maintenance Budget Public
Toilets
|
$111,204
|
$ 57,129
|
|
Maintenance Budget Community
Halls
|
$429,050
|
$ 34,920
|
|
Maintenance Budget Recreation
|
$210,971
|
$ 35,432
|
|
Maintenance *Other buildings
|
$835,903
|
$110,757
|
|
|
TOTAL
$1,900,006
|
(R2019/36175)
TOTAL
$409,534
|
|
Buildings meet relevant
legislative requirements
|
Planned maintenance and
inspection program complete
|
As per planned and unplanned
maintenance response times (Maintenance Plan, Section 8) and individual
cleaning schedules
|
Safety/Environmental/Security
(57) e.g. Disability access non compliance, trip hazards, window locks,
missing fire extinguisher, exit not illuminated, asbestos. Statutory (1) e.g.
loose wires Byron Surf Club
|
|
Buildings meet user’s
needs
|
Condition of buildings
|
20 % of buildings in
condition 4 and 5
|
29 % of buildings in
condition 4 and 5
|
|
Renewal
|
Buildings meet user’s
needs. No new buildings planned in the next 10 years
|
Budget allocation of
$1,257,217 spent on renewals only
|
$1,257,217
(Average Annual “Hold/Maintain”
Scenario 2)
|
$1,074,650
(Average Annual
“Hold/Maintain” Scenario 1)
|
|
Upgrade/New
|
Brunswick Memorial Hall
– Commercial kitchen upgrade
|
Budget 19/20 $60,000 from
Capital Renewals & $60,000 from Committee
|
$0
|
$60,000
|
.
5. Future Demand
This
section evaluates potential factors affecting demand such as:
è Population growth
è Changing community expectations
è Development
è Changes in demographics
è Strategic network extensions, upgrades and additions
These
factors will affect the renewal and upgrade of the existing network which in
turn impacts maintenance and operational resourcing and budgeting.
Demand Forecast
Population
trends can be used as a guide in determining future demand. Information from
NSW Planning & Environment below indicates that Byron Shire is currently
experiencing growth, which is expected to continue (Table 6).
Table 6 NSW population
projections regional LG data
|
Forecast
Year
|
Change
between 2011 and 2036
|
|
2011
|
2016
|
2021
|
2026
|
2031
|
2036
|
Total
Change
|
Total
Increase Rate
|
|
30,700
|
32,400
|
33,850
|
35,250
|
36,650
|
37,950
|
7,250
|
1.24
|
This
population growth may see an increase in maintenance requirements across the
Building Asset network along with capital renewals and upgrades.
There
is also potential for increased developer contributed assets that will
alleviate some of the strains placed by an increase in population and the
corresponding expectations and requirements. However, this will also bring with
it a need for increased maintenance expenditure and resourcing as the assets
begin to age.
Demand Management Plan
The
demand for building assets is expected to increase proportional to population
growth. This also aligns with the expectations from the community where public
toilets scored in the top 3 priorities (Figure 10).
Figure 10 Top 3 Community
Priorities (BSC Survey, 2016)
Managing
the demand for services will involve both asset and non-asset solutions.
Non-asset
solutions put emphasis on providing a level of service without making changes
to the current asset stock. This includes reducing the level of service,
reducing demand for the service and educating the community to accept
appropriate asset condition.
Asset
solutions include the renewal, upgrade and creation of assets.
Key
drivers for demand that have been identified are shown below (Table 7).
Table 7 Demand management plan
summary
|
Demand
Driver
|
Impact
on Services
|
Demand
Management Plan
|
|
Capacity
· Population growth
· Tourism
|
Requirement
to upgrade or expand public toilets, community halls and sporting facilities
|
· Fund priority works by seeking grant funding and
implementing the Developer Contributions Plan
· Educate the community on the costs associated with
holding/maintaining current service levels and that increased assets mean
increased costs
|
|
Capital
/ Maintenance Works
· Asset growth
· Aging asset stock
· Expectation from community for quality building portfolio
· Increased costs associated with capital renewal in the
region. Trade /contractor demands.
|
Requirement
to upgrade facilities
|
· Consult with community on options and funding
requirements
· Inform community and manage expectations. Communicate
levels of service and financial capacity, to balance infrastructure
priorities with what the community is prepared to fund.
|
|
Development
· Increased development to accommodate increased population
and demand
|
Additional
infrastructure required to cope with demand
|
· Monitor and manage development controls
· Undertake infrastructure planning taking into account
land use changes
|
New Assets from Growth
The
purpose of the Development Contributions Plan 2012 (Amendment 3) (the
Plan) is to enable Byron Shire Council to request contributions from
developers. These contributions are expected to provide services that are
likely to be required as a result of development throughout Byron Shire. The
Plan also outlines the programmed work to be completed as part of the
expenditure of contributions, and is available on Council’s website (http://www.byron.nsw.gov.au/developer-contributions-plans).
The
Plan requires the carrying out of works or the payment of contributions to go
towards the provision, extension or augmentation of services and facilities
that will, or are likely to be, required as a consequence of development in
Byron Shire.
6.
Asset Management Practices
This
section outlines the decision-making tools currently used to determine long
term maintenance, renewal and upgrade expenditure for building assets. As a
result of Council restructuring, an asset team was formed in 2015. This now
consists of 4 full time staff dedicated to strategically managing assets. This
has provided the opportunity to increase capacity and scale to improve asset
management systems and technologies and is detailed in Figure 11 Asset
Management Systems and Elements.
Financial Systems
Council
currently uses Authority as the financial management and accounting system.
Inspection Processes
Council
completed a comprehensive audit of all buildings in 2019. This identified 1,600
defects that need to be addressed to bring assets to a satisfactory condition
in accordance with the standards. This audit used a mobile solution called Reflect™.
All roof tops were visually inspected using Council’s drone which
enabled inspection that would not otherwise have been affordable and
highlighted the need for improvements to general gutter maintenance. All
defects were detailed and photographed. The inspections also included detailed
condition assessments to the component level and the data used in the
Predictor© modelling software for the capital works programming.
Asset Management Systems
Council
uses Authority as the asset management system. Authority Asset Register
contains details of all Council assets, their attribute and condition
information. At present 37,000 (July 19) assets are linked to Council’s
corporate GIS system, which is used to show asset locations spatially in
conjunction with cadastral, topographic and aerial information.
Assetic
Predictor© was used to perform the strategic modelling prediction analysis
to determine the future strategies and capital expenditure plans detailed in
the Financial Summary section (Figure 11).
Asset management systems are well
established and integrated,
however, work is required in the Work
Order system to improve splits between maintenance and operational costings.
Changes in Technology
Byron
Shire Council uses mobile Android and Trimble TDC100 handheld devices for
inspections, defects and electronic forms. It utilises Asset Edge Reflect™
which synchronises data to a cloud solution and information can be available
simultaneously in the office. Council does not use any paper systems to manage
Building Assets.
Council’s
drone is used for asset inspections, aerial photography and video. It provides
the ability to gain access to difficult sites that would not previously have
been inspected or would have required roof anchor systems. Examples include
roof top inspections.
Council
utilises in-house time lapse cameras and drone footage on construction of all
major projects. This is used to promote the investment into infrastructure
capital renewals.
Byron leads asset management with the latest technology
and innovation.
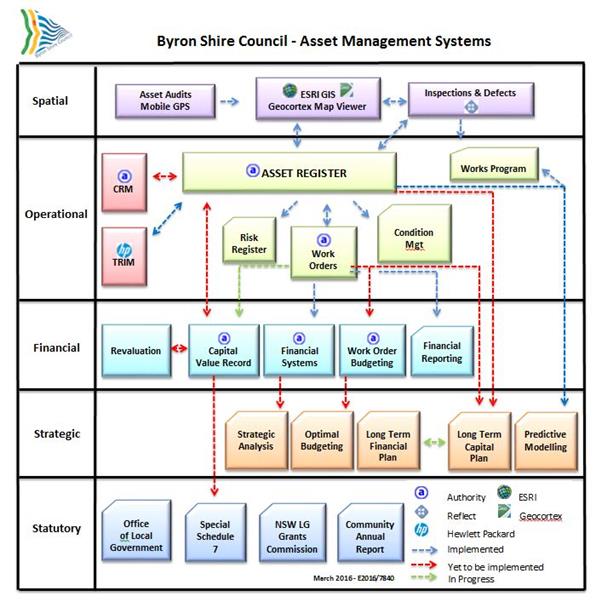
Figure 11 Asset Management Systems
and Elements
Accounting Framework
The
following Accounting Framework applies to local government in New South Wales:
· Local Government Code of Accounting Practice and Financial
Reporting
· AASB 13 Fair Value Measurement – prescribes fair
value measurement of assets
· AASB 116 Property, Plant & Equipment – prescribes
requirements for recognition and depreciation of property, plant and equipment
assets
· AASB 136 Impairment of Assets – aims to ensure that
assets are carried at amounts that are not in excess of their recoverable
amounts
· AASB 108 Accounting Policies – specifies the policies
that Council is to have for recognition of assets and depreciation
Standards and Guidelines
Asset
Management practices and processes are driven by a number of legislative
requirements and assisted various asset management guidelines:
è Australian Accounting Standards set out the financial asset
accounting reporting requirements on Local Governments.
è International Standard ISO55000
è International Infrastructure Management Manual developed by
IPWEA (Provides guidance and direction on asset management policy and plan
development).
è Australian Infrastructure Financial Management Guidelines
developed by IPWEA (Provides guidance and direction on asset accounting).
è Federal Disability and Discrimination Act (DDA) 1992.
Risk Management
Byron
Shire acknowledges that risk management is an essential part of best practice
asset management. The risk assessment process identifies credible risks, the
likelihood of the risk event occurring, the consequences should the event
occur, develops a risk rating, evaluates the risk and develops a risk treatment
plan for non-acceptable risks.
The Draft
Infrastructure Services Risk Management Procedure (E2015/23531), available
at Council offices, outlines the process of identifying and managing risks for
Council’s infrastructure assets.
7. Lifecycle
Management Plan
Life
cycle management is an integrated approach to optimising the asset life cycle
from the initial idea through to disposal (Figure 12). This section discusses
the identification of renewal, new, upgrade and maintenance works that are
required at each stage of the asset’s life.
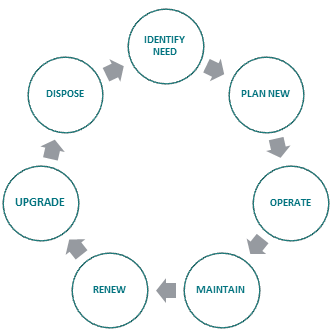
Figure 12 Asset life cycle stages
Asset Capacity and Performance
In
general, the capacity of the building infrastructure network is adequate
throughout most of the Shire. As previously described in Section 4, the
community was surveyed in 2019 and specifically asked to rate the performance
and importance of the public toilets and community buildings.
· The Public Toilets had an average rating of 3.6.
· The Community Buildings had an average rating of 2.2.
Council
will endeavour to improve the public toilet quality rating up to a rating of 3
- fair condition.
Useful Lives and Unit Rates
The
Byron Shire average actual life of building assets is compared to industry
average ‘useful life’ in Table 8. This information is based on the
revaluation of building assets in 2016.
Table 8 Building Assets useful
lives
|
Asset Type Component
|
Component
|
Industry Average
Useful Lives
|
Byron Shire
Average
Useful Lives
E2018/85029
|
|
Structure
|
Sub structure (Floor Structure)
|
40-150
|
109
|
|
Super structure (Building Envelope)
|
40-200
|
83
|
|
Roof
|
Roof cladding
|
30-40
|
68
|
|
Fitouts & fittings
|
Floor coverings carpet
|
15-45
|
13
|
|
Fixtures, fittings & screens
|
45-65
|
41
|
|
Services
|
Electrical
|
64-90
|
69
|
|
|
Hydraulic
|
70-100
|
77
|
|
|
Fire
|
15-20
|
20
|
|
|
Mechanical
|
10-60
|
12
|
|
|
Transport (lifts)
|
94
|
|
|
|
Security
|
10-20
|
|
Figure
13 represents the remaining life by asset category in the financial asset
register. The building assets have an average life of 12 years. On a network
basis Council’s assets have 85% of their useful life remaining. However
in comparing useful life data with overall condition and Predictor ©
useful life data, it is apparent that the data is not similar (Refer to Figure 20
in the Financial Summary). The useful life used in modelling goes to a
sub-component level and provides greater detail. It indicates that the assets
appear to be deteriorating at a greater rate.
The
conclusion is that the remaining life data from the 2016 building valuations is
not consistent with the recent condition inspections and identifies an area for
improvement in future financial asset revaluations (Refer to Improvement Plan).
This data is to be used for financial management and not to be taken out of
context from this document.
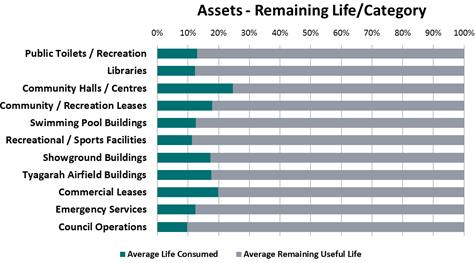
Figure 13 Useful life consumption from financial register
Asset Valuations
Table 9
details the current replacement cost of the buildings at $74,318,000 with
a depreciated replacement cost of $62,459,000. The annual depreciation
is $993,863. The Financial Summary section details the asset performance
indicators. The Figure 14 Asset condition over useful life depicts how
depreciation is accounted for over the useful life of an asset.
Table 9 Building asset valuation data (SS7 30 June 18)
|
Asset Category
|
Current Replacement Cost
(,000)
(Gross Replacement)
|
Depreciated
Replacement Cost
(,000)
(Net
Carrying Amount)
|
Annual
Depreciation
(,000)
|
Accumulated
Depreciation
(,000)
|
|
Council
Operations
|
$15,308
|
$13,307
|
$190,177
|
$2,001
|
|
Swimming Pool
Buildings
|
$931
|
$826
|
$11,681
|
$105
|
|
Showground
Buildings
|
$2,083
|
$1,643
|
$28,915
|
$440
|
|
Recreation
buildings
|
$16,135
|
$13,437
|
$235,947
|
$2,698
|
|
Libraries
|
$4,455
|
$4,092
|
$65,907
|
$363
|
|
Public
Amenities
|
$3,123
|
$2,716
|
$28,915
|
$407
|
|
Emergency
Services
|
$1,338
|
$1,191
|
$14,825
|
$147
|
|
Community
Buildings
|
$16,612
|
$13,305
|
$255,212
|
$3,307
|
|
Commercial
leases
|
$1,266
|
$1,042
|
$18,666
|
$224
|
|
Pre-schools
|
$6,006
|
$4,936
|
$100,613
|
$1,070
|
|
TOTALS
|
$74,318
|
$62,459
|
$993,863
|
$11,859
|
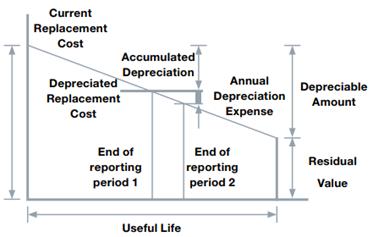
Figure 14 Asset condition over useful life
Asset Condition
Council
has a condition assessment manual that outlines the strategic inspection plan
for Building Assets. Each asset, or component, is condition scored from 1 to 5,
as defined in Levels of Service Table 3. The condition scoring scale follows
internationally accepted good practice. The results of these condition
assessments are then used in predictive modelling software, Asset Register and
Geographical Information System.
8. Maintenance
Plan
The
actual operational expenditure was $1,244,412 and the maintenance was $214,197
at 30 June 2018 (total $1,458,609). From the LTFP the annual average
maintenance and operational budget over 10 years is $1,415,600. With
recent inspections there is currently a gap of $1,900,000 identified
maintenance defects. These defects are in the Buildings Maintenance Plan 2019 (E2019/20878).
Maintenance
and Inspection Program
Table 10 Maintenance &
Inspection Program
|
Activity
|
Type
|
Freq.
|
Comments
|
Public Toilets
|
Sports -
User Agreements
|
Emergency Services
|
Pools
|
Tyagarah Airfield
|
Halls/
Showground
(*355
Committees)
|
Leases
|
Licenses
|
|
General inspections
|
I
|
12 months
|
355 Com. 5 yearly
|
Council
|
Council
|
Council
|
Council
|
Council
|
Council
|
Council
|
Council
|
|
Fire extinguishers/hose reels
|
M
|
6 months
|
AS/NZS ISO
|
NA
|
Council
|
Not defined
|
Council
|
Leasee
|
Committee
|
Council
|
Council
|
|
Fire Evacuation Plans
|
I
|
12 months
|
AS/NZS ISO
|
NA
|
Council
|
Not defined
|
Council
|
Leasee
|
Council
|
Council
|
Council
|
|
Exit & Emergency Lighting
|
I
|
12 months
|
AS/NZS ISO
|
NA
|
Council
|
Not defined
|
Council
|
Leasee
|
Council
|
Council
|
Council
|
|
Fire emergency systems
|
I
|
Mthly Byron library & Civic Hall. Others 6 mthly
|
AS/NZS ISO
|
NA
|
Council
|
Not defined
|
Council
|
Leasee
|
Council
|
Council
|
Council
|
|
Security Systems & monitoring
|
I
|
6 monthly
|
AS Standards
|
NA
|
Council
|
Not defined
|
Council
|
Leasee
|
Council
|
Council
|
Council (AFL Cavanbah)
|
|
Testing & tagging
|
M
|
12 months
|
AS/NZS ISO
|
NA
|
Sports User
|
Not defined
|
Council
|
Leasee
|
Committee
|
Tenant (Council if fixed)
|
Licensee
|
|
Floor coverings-replace
|
M
|
As required
|
|
NA
|
Council
|
Not defined
|
Council
|
Leasee
|
Council/
committee
|
Council
(if installed)
|
Council
|
|
Cleaning
|
M
|
Daily
|
|
Council contract
|
Sports User
|
Not defined
|
Leasee
|
Leasee
|
Committee
|
Tenant
|
Licensee
|
|
Cleaning -carpet
|
M
|
As required
|
Dependant on use
|
NA
|
NA
|
Not defined
|
Leasee
|
Leasee
|
Committee
|
Tenant
|
Licensee
|
|
Cleaning - Hygiene services
|
M
|
monthly
|
|
Council contract
|
Sports User
(Council - public toilets)
|
Not defined
|
Council
|
Leasee
|
Council
|
Tenant
|
Licensee
|
|
Cleaning - windows
|
M
|
6 monthly
|
|
NA
|
Not defined
|
Not defined
|
Leasee
|
Leasee
|
Committee
|
Tenant
|
Licensee
|
|
Lifts
|
M
|
1 monthly
|
|
NA
|
NA
|
NA
|
NA
|
NA
|
NA
|
NA
|
NA
|
|
OSMS& Grease traps
|
M
|
Dependent on use
|
Dependent on use
|
NA
|
Not defined
|
Not defined
|
Leasee
|
Leasee
|
Committee
|
Tenant
|
Council
|
|
Painting
|
M
|
10 yearly
|
|
Council
|
Not defined
|
Not defined
|
Council/
Leasee
|
Leasee
|
Council or committee
|
Tenant or council
|
Licensee
|
|
Pest control
|
M
|
¼, 6mth/ yearly
|
Dependent on usage & location
|
Council
|
Sports User
|
Not defined
|
Council
|
Leasee
|
Council
|
Council
|
Council & Licensee
|
|
Roller doors/gates
|
M
|
Annually
|
|
NA
|
Not defined
|
Not defined
|
Council
|
Leasee
|
Committee
|
Council
|
Council
|
|
Roof & gutter cleaning
|
M
|
6 mthly/as required
|
|
Council
|
Not defined
|
Not defined
|
Council
|
Leasee
|
Committee
|
Tenant or council
|
Council
|
|
Air cond.
|
I
|
Monthly
|
AS/NZS ISO
|
NA
|
NA
(Cavanbah Council)
|
Not defined
|
Leasee
|
Leasee
|
Council
|
Council
if installed
|
Owner – Council or Licensee
|
|
Back Flow prevention devices
|
I
|
Annually
|
|
Council
|
Not defined
|
Not defined
|
Council
|
Leasee
|
Council
|
Council
|
Council
|
|
Electrical compliance (switchboards)
|
I
|
As stds require / annually
|
AS/NZS ISO
|
Council
|
Council
|
Not defined
|
Council
|
Leasee
|
Council
|
Council
|
Council
|
|
Roof harness system
|
I
|
Annually
|
AS/NZS ISO
|
Council
|
Council
|
Not defined
|
Council
|
Leasee
|
Council
|
Council
|
Council
|
Note: 1. I
– Inspection 2. M – Maintenance 3. Onsite Sewage Management
System (OSMS) 4. * Section 355 Committee specific maintenance responsibility
splits between council and committee are identified in Section 8 of
E2016/79739. Items in red need further action to follow up with clarification
of documentation e.g leases or Committee agreements. .
Public
Toilet Future Maintenance Expenses
The
future average annual maintenance and operational expenses for public toilets
is $623,500, calculated from the LFTP. The operational costs of
providing the current level of service to the 28 public toilets averages
$22,300 per year (this includes the cleaning of the 3 Crown toilets) and is
based on the assumption that no more self-cleaning toilets are installed. Table
11 details the Public Toilet maintenance over the last 3 years. It is worth
noting that the majority of these costs are for cleaning which is an
operational cost, not maintenance expenditure.
Maintenance does not increase the service potential of the asset it
keeps it in good condition, slows down deterioration, delays necessary renewals
and ensures the asset achieves its expected useful life.
Operational activities enable the asset to be used and consume
resources such as wages, energy, chemicals, and materials. They include
overheads.
Table 11 Public Toilet
Operational and Maintenance over 3 years
|
Public Toilets Shire Wide
|
Total Cost 2016
|
Total Cost 2017
|
Total Cost 2018
|
|
Cleaning
|
$377,006
|
$407,789
|
$406,216
|
|
Chemical Supplies
|
$34,789
|
$42,216
|
$34,229
|
|
Work Health & Safety
|
$75
|
$502
|
$132
|
|
Vandal Damage
|
$19,186
|
$10,250
|
$11,490
|
|
Plumbing
|
$49,650
|
$8,242
|
$15,523
|
|
Structural
|
$4,975
|
$13,647
|
$8,223
|
|
Electrical
|
$4,732
|
$6,648
|
$21,893
|
|
Security
|
$5,318
|
$5,292
|
$7,223
|
|
Electrical Charges
|
$6,423
|
$6,256
|
$6,216
|
|
Waste & Sanitation
|
$5,220
|
$4,550
|
$0
|
|
Hygiene
|
$16,527
|
$9,960
|
$679
|
|
Rates & Charges
|
$6,588
|
$1,762
|
$2,287
|
|
Allowances
|
$21,836
|
$23,939
|
$3,042
|
|
Safety Works
|
$115
|
$251
|
$218
|
|
Roofing
|
$0
|
$0
|
$0
|
|
Emergency
Works
|
$605
|
$0
|
$0
|
|
Total
|
$553,043
|
$541,305
|
$517,371
|
It is
recommended that operational and maintenance tasks are separated, to better
manage the buildings into the future as per Table 12. This action has been
added to the Improvement Plan.
Table 12 Public toilet Operational and Maintenance tasks
|
Public Toilets
Operational
|
Public Toilets
Maintenance
|
|
Cleaning
Graffiti
Chemical
Supplies
WH&S
Security
Waste
& Sanitation
Hygiene
Electrical
charges & supply
Rates
& Charges
Allowances
Safety
Works
Consumables
(toilet paper)
|
Gutter
cleaning
Electrical
Lighting repairs
Plumbing
- Tap repairs, cisterns
Structural
Roof
Door
locks
High
pressure cleaning
Tiling
Painting/Oiling
Vandalism
(breakages not graffiti)
|
Figure
15 details the actual expenditures of building operations and maintenance.
Notably public toilets account for nearly half the expenditure due to the high
operational cleaning costs as perviously detailed in Table 11.
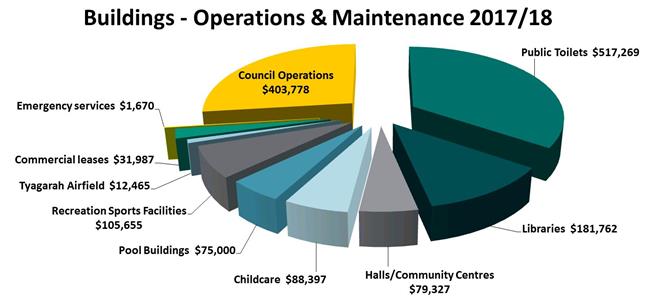
Figure 15 Buildings Operations & Maintenance
Actuals 2017/18
Maintenance Challenges
· A complete audit of the buildings has identified 1,600
identified defects which require action to bring assets to a satisfactory
standard. The cost of these works is estimated at $1.9million and is currently
unfunded.
· The inspections and maintenance program has identified a
number of required activities, specifically that gutter maintenance is not
occurring on the majority of buildings.
· Maintenance responsibility is not allocated in the current
Sports User Agreements nor with the Emergency Services (Table 10)
· The following maintenance activities are unfunded in some
categories: general inspections, fire extinguishers/hose reels, Fire Evacuation
Plans, Exit & Emergency Lighting, fire emergency systems, security systems
& monitoring, testing & tagging, replacement of floor coverings, OSMS
and grease traps, painting, pest control, roller doors/gates, roof and gutter
cleaning, air conditioning, back flow prevention devices, electrical compliance
(switchboards) and roof harness systems.
· The frequency of some maintenance activities is unspecified
and yet to be defined.
There is a maintenance gap of $1.9M to address all
identified building defects.
9.
Renewal Plan
In the financial
year of 2017/18 Council spent $1,543,790 on capital expenditure for
building assets. This was higher than normal as it included $303,000 on the
council foyer. Based on the Assetic Predictor© modelling for Capital
renewal for buildings, needs average at $1.3M over 10 years to
‘hold/maintain” the overall condition of the building portfolio.
This work is for replacement of assets only and does not account for new
building assets.
Renewal Prioritisation
Council
uses Assetic Predictor©, prediction modelling software, to prioritise
capital works. The objective of this analysis is to model the performance of
the general fund buildings (excluding caravan parks). The process includes
setting up:
· degradation profiles based on condition and remaining life,
· identifying current treatments and unit rates to deliver
these treatments, and
· setting up treatment decision matrices defined for optimal
interventions for each treatment.
Thus
it is possible to model the future costs of building renewal requirements and
predict the future condition based on budget options.
Predictive
modelling scenarios for the buildings have been run over 10 years to align with
the language used in the Special Rate Variation below:
|
What
we can do?
|
Scenario
1 “Deteriorate” Current Long
Term Financial Plan (Affordable)
|
|
What
we would like to do?
|
Scenario
2 “Hold/Maintain” Holding
Budget Renewal Only
(does
not include New or Upgrades)
|
|
What
we should do?
|
Scenario
3 “Improve” Renewal Only
(does not include New or Upgrades)
|
Scenario
1 is what we can do with the current budget in the Long Term Financial Plan.
Scenario
2 provides a tool for discussion with Council and community on trade-offs
between what we would like to do and what we can do with existing budgets. This
is a minimum requirement to hold the asset portfolio from further
deterioration. However it will still result in some buildings reaching a point
of poor to very poor condition beyond maintenance capability and they will then
require replacement.
Scenario
3 can be achieved by balancing changes in services and service levels with
affordability and acceptance of the service and risk consequences of a given
trade-off position.
None
of the three scenarios includes New or Upgrades to buildings such as extensions
to verandas, disability ramps, improvements to kitchens to comply with the Sale
of Food regulations etc. It only includes essential capital renewals to keep
like for like on the existing asset. Figure 16 below shows the financial
budgets over 10 years used in the Asset Predictor© Modelling scenarios.
To “hold/maintain” the overall building
portfolio condition
the average capital renewal needs to be $1.3M.
Table 13 Asset Predictor©
Modelling Buildings
|
Year
|
Deteriorate
Scenario 1
Long Term Financial Plan
|
Hold / Maintain
Scenario 2
Holding Budget
|
Improve
Scenario 3
Renewal Only Budget
|
|
2019/20
|
$
474,600
|
$1,150,000
|
$2,000,000
|
|
2020/21
|
$1,120,000
|
$1,173,000
|
$2,040,000
|
|
2021/22
|
$1,020,000
|
$1,196,460
|
$2,080,800
|
|
2022/23
|
$1,042,000
|
$1,220,389
|
$2,122,416
|
|
2023/24
|
$1,066,000
|
$1,224,796
|
$2,164,864
|
|
2024/25
|
$1,150,500
|
$1,269,692
|
$2,208,161
|
|
2525/26
|
$1,176,700
|
$1,295,086
|
$2,252,324
|
|
2026/27
|
$1,204,000
|
$1,320,988
|
$2,297,371
|
|
2027/28
|
$1,232,000
|
$1,347,408
|
$2,343,318
|
|
2028/29
|
$1,260,700
|
$1,374,356
|
$2,390,185
|
|
TOTALS
|
$10,746,500
|
$12,572,175
|
$21,899,439
|
There is a capital renewal gap of $185,567 annually to
‘hold / maintain’ the overall condition of
the building assets.

Figure 16 Capital Modelling Scenarios Compared
Below
are the 10 year budget comparisons of the overall condition using the modelling
scenarios above. By investing (the ‘improve’ budget), 17 % of the
Poor assets move into the Good condition over 10 years and the whole asset
portfolio looks much more healthy. The ‘improve’ budget scenario
also saves $5,260,000 in maintenance costs over 10 years. Figure 17
depicts the condition changes with budget scenarios. The output of the Current
Budget scenario has produced 10 year capital works.
Overall
Condition:
◦ 2.65 – Overall
Average Condition at 2018.
◦ 2.85 – Overall
Average Condition Deteriorates on Current Budget.
◦ 2.64 - Overall Average
Condition Maintains on Hold / Maintain Strategy Budget.
◦ 2.01 – Overall
Average Condition Improves on Improve Strategy Budget.
Using the “hold / maintain” Scenario 2 less
money is spent in total.
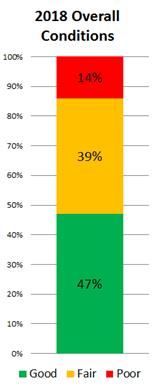
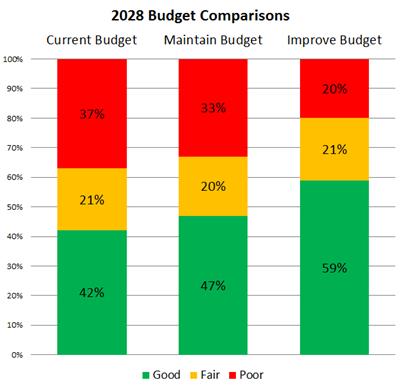
Figure 17 Modelling Scenario 10
Year Condition Comparisons
Impact of Deferring Renewal Works
Deferring
renewal works occurs when renewal requirements exceed the available budget.
Deferring renewal projects impacts on the level of service an asset is able to
provide. In the short term the impact may be acceptable, however continued
deferral can lead to an increase in backlog and therefore risk (Figure 18).
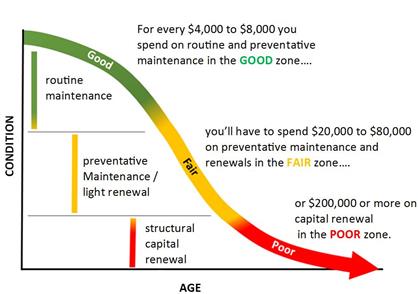
Figure 18 Building Deterioration and
Maintenance Curve
Managing the Risks and Renewal
Challenges
There
are increasing risks to infrastructure associated with providing a service and
not being able to fund and complete the necessary maintenance and renewal. The
major risks are:
· Gutter and downpipe replacement is not addressed when
needed, resulting in water damage to internal and or external walls.
· Roof replacement not completed when needed, resulting in
water damage to the ceiling, fitout and fittings, and carpets. This can cause
mould damage and require relocation of users until addressed.
· Programmed asbestos replacement to comply with Australian
Standards e.g. replacing internal wall sheeting, soffits, eaves, and flooring
in community Halls etc. (Marvel Hall)
· Closing of buildings such as public toilets that become unsafe
for use.
· Air conditioning systems requiring replacement increase
reactive maintenance and operational costs e.g. Mullumbimby Administration
Building
· Public toilets that are reaching overall poor condition are
still operational, however, the community is very dissatisfied with the level
of service.
· The costs to upgrade facilities to comply with the Federal
Disability Discrimination Act needs to be considered in the development of
future long term financial plans.
· Budgets are not allocated to building categories as defined
in this Plan. As such, deferred renewals are likely with maintenance issues
unable to be addressed.
Council
will endeavour to manage these risks within available funding by implementation
of asset management systems and inspection regimes, to provide a sound platform
for understanding the condition, maintenance and replacement schedule for all
assets.
Asbestos
In the
2011/12 Special Rates program for community buildings Council began asbestos
audits to comply with the ‘Occupational Health and Safety Regulation
2001’, chapter 4, clauses 43 and 44 - Risk assessment, control and
asbestos register.
The
program continued for five years to establish an Asbestos Register and Asbestos
Management Plans for all community buildings. During this program, funding was
also allocated to a number of projects to begin asbestos removal. Listed below
are buildings that have had asbestos removal and/or are undergoing programmed
asbestos removal as budget allocations permit. Asbestos sheeting and other
products are referred to as ACM (asbestos containing material).
1. Bangalow Sports Field Clubhouse - Removal of
all ACM sheeting on walls and ceilings.
2. Brunswick Memorial Hall – Removal of
ACM soffits- program continuing to remove ACM from kitchen and toilets over
next two years.
3. Marvell Hall/old Autumn Club - Removal of
ACM from meeting room walls & Ceilings, common area- programed for removal
in Toilets and kitchen over next two years.
4. Neighbourhood Centre Mullumbimby - Removal
of ACM roofing, internal ceilings.
5. Mullumbimby Drill Hall - Removal of ACM
soffits, internal wall cladding.
6. Mullumbimby Scout Hall - Removal of ACM wall
linings.
During
some routine maintenance on buildings, minor ACM removal occurs on a regular
basis as ACM is discovered in a damaged or deteriorated state. This can be a
broken or cracked ACM wall sheet, ceiling or soffit. ACM is also present in
many switch boxes with many being replaced in the RCD compliance program.
10. New
and Upgrade Plan
Selection Criteria
New
and upgrade works can be identified from a number of sources including
community suggestions, internal knowledge, Councillors and strategies and
plans, such as the Section 94 plan.
These
suggestions and strategies are assessed for validity, priority, benefit and
cost and can then be programmed into future capital works schedules.
At
this stage the main driver for new and upgrade work is through the Section 94
Plan. The Plan discusses population, demographic characteristics, contributions
and the identification of projects.
Developer Contributions
New
capital assets provided to Council through Developer Contributions are handed
over at agreed Levels of Service which comply with the Northern Rivers Local
Government Design and Construction Manuals. These service standards have
been developed as a resource sharing initiative involving Byron Shire Council,
Ballina Shire Council, Clarence Valley Council, Lismore City Council, Kyogle
Council and Richmond Valley Council. The initiative has provided uniform
development standards for the region via a clear and comprehensive set of
requirements for development infrastructure design and construction.
New and upgrade work is mostly funded through the
Contributions Plan.
Forecast Upgrade/New Expenditure
The
current forecast upgrade and new expenditure is presented in the Section 94
Plan in detail. In 2019/20 Council has allocated $60,000 to the Brunswick
Memorial Hall for a commercial kitchen upgrade. The Section 355 committee is
also contributing $60,000 to the project from Hall Hire funds. The works
include extensive asbestos removal, an extension to the kitchen into an old
storage area, upgrading all fixtures and fittings to commercial grade,
application for commercial kitchen licence and installation of a commercial
Grease Trap.
The
Long Term Financial Plan beyond 2019/20 does not allocate funds specifically
for new or upgrades to building assets.
Spending on building upgrades reduces the ability to
optimise required capital renewals. This results in deferring renewals and
leads to higher future capital expenditure.
11.
Disposal of Assets
While
there are no current plans to dispose of buildings infrastructure assets,
Council has previously downgraded assets in order to better reflect
requirements and manage maintenance costs.
Critical
assets
Critical
assets are those assets which have a high consequence of failure but not
necessarily a high likelihood of failure. By identifying critical assets and
critical failure modes, organisations can target and refine investigative
activities, maintenance plans, and capital expenditure plans at the appropriate
time.
Operations
and maintenances activities may be targeted to mitigate critical asset failure
and maintain service levels. These activities may include increased inspection
frequency or higher maintenance intervention levels. Critical assets’
failure modes and required operations and maintenance activities are in Table 14.
Table 14 Critical Assets and Service Level Objectives
|
Component
criticality score
|
Critical
assets
|
Critical
failure mode
|
Operations
and maintenance activities
|
|
1
|
Fire
safety equipment
|
Failure
results in building not being safe for occupation.
|
Maintenance
and repairs in accordance with Australian Standards and Essential Safety
Provisions.
|
|
2
|
Safety
- Electrical infrastructure
|
Failure
results in building not being safe for occupation.
|
Maintenance
and repairs in accordance with Australian Standards and Essential Safety
Provisions.
|
|
2
|
Safety
- Air conditioning and hydraulics
|
Failure
results in building not being safe for occupation.
|
Maintenance
and repairs in accordance with Australian Standards and Essential Safety
Provisions.
|
|
2
|
Safety
- Lifts
|
Failure
results in building not being safe for occupation.
|
Maintenance
and repairs in accordance with Australian Standards and Essential Safety
Provisions.
|
|
2
|
Safety
– Asbestos
|
Asbestos
register, labels etc
|
‘Occupational
Health and Safety Regulation 2001’.
|
|
2
|
Security
|
External
stairs, alarms, exits etc
|
Maintenance
and repairs in accordance with Australian Standards
|
|
3
|
Structural
|
Structural
retaining
|
Preventative
maintenance of vegetation build up and further structural investigations as required.
|
|
4
|
Functional
|
Bathroom,
ceiling fans
|
Preventative
maintenance and cleaning.
|
|
5
|
Aesthetic
|
Floor
coverings
|
Programmed
cleaning.
|
12.
Financial Summary
This
section contains the financial requirements for building assets over the next
10 years as determined through predictive and financial modelling. Note that
all figures incorporate 2.5% inflation.
Funding Strategy
The
projected expenditure will be funded from Council’s maintenance,
operating and capital budgets. The funding strategy is detailed in the LTFP.
This also details the Special Rate Variation that Council applied for, and
received, in 2017.
Figure
19 displays the annual required capital renewal expenditure as determined
primarily through Assetic Predictor© modelling and the required maintenance
defects ($1.9million) identified with a detailed audit. The funding level
applied has been determined by Council staff.
This
graph compares Scenario 1 the budgeted LTFP with Scenario 2 the Holding budget.
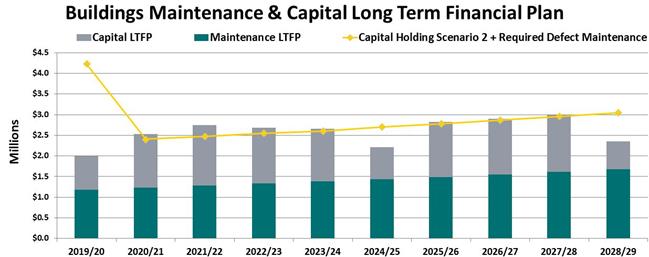
Figure 19 Maintenance &
Capital Long Term Financial Plan (LTFP)
The
proposed Council approved LTFP, capital and maintenance budgets are presented
below.
Capital
Funding
Table 15 Capital Funding Assetic
Predictor© Scenario 1 Deteriorate
|
Year/
|
Public
Toilets
|
Libraries
|
Community
Halls
|
Community
Leases
|
Swimming
Pools
|
Recreation
Sport
|
Bangalow
Showground
|
Tyagarah
Airfield
|
Commercial
leases
|
Emergency
Services
|
Council
Operations
|
TOTAL
|
|
2019/20
|
$13,238
|
$0
|
$28,690
|
$367,468
|
$6,960
|
$269
|
$6,395
|
$9,818
|
$5,891
|
$1,651
|
$34,184
|
$474,600
|
|
2020/21
|
$60,640
|
$43,408
|
$90,716
|
$166,621
|
$49,013
|
$55,494
|
$7,394
|
$39,754
|
$21,350
|
$0
|
$585,585
|
$1,120,000
|
|
2021/22
|
$104,018
|
$116,764
|
$213,736
|
$245,243
|
$13,155
|
$68,223
|
$34,158
|
$9,625
|
$20,869
|
$25,863
|
$168,337
|
$1,020,000
|
|
2022/23
|
$2,453
|
$253,626
|
$155,198
|
$175,930
|
$0
|
$397,252
|
$289
|
$1,159
|
$6,769
|
$0
|
$49,315
|
$1,042,000
|
|
2023/24
|
$13,307
|
$24,172
|
$357,646
|
$354,975
|
$6,675
|
$24,684
|
$9,367
|
$9,247
|
$4,578
|
$1,691
|
$259,591
|
$1,066,000
|
|
2024/25
|
$96,322
|
$21,237
|
$247,868
|
$353,323
|
$9,527
|
$15,473
|
$64,836
|
$90,913
|
$29,286
|
$28,703
|
$192,968
|
$1,150,500
|
|
2025/26
|
$60,622
|
$28,563
|
$375,986
|
$154,645
|
$14,138
|
$158,961
|
$3,011
|
$48,836
|
$16,692
|
$0
|
$315,171
|
$1,176,700
|
|
2026/27
|
$90,916
|
$39,596
|
$12,178
|
$91,337
|
$0
|
$27,731
|
$4,470
|
$0
|
$5,613
|
$1,782
|
$930,329
|
$1,204,000
|
|
2027/28
|
$102,213
|
$239,766
|
$106,252
|
$285,953
|
$20,361
|
$282,088
|
$1,829
|
$9,957
|
$365
|
$4,309
|
$178,871
|
$1,232,700
|
|
2028/29
|
$73,729
|
$24,797
|
$31,571
|
$148,918
|
$20,015
|
$217,401
|
$0
|
$1,084
|
$14,478
|
$25,752
|
$702,918
|
$1,260,700
|
|
Total
|
$617,458
|
$791,929
|
$1,619,841
|
$2,344,413
|
$139,844
|
$1,247,576
|
$131,749
|
$220,393
|
$125,891
|
$89,751
|
$3,417,269
|
$10,746,500
|
To “hold / maintain” the overall building
portfolio condition
the average capital renewal needs to be $1.3M annually.
Maintenance
Funding Modelled from Assetic Predictor© (Year Level Comparison)
Table 16 Maintenance Funding LTFP vs Predictor© Modelling
|
YEAR
|
LTFP
Budgets Maintenance & Operational Costs
|
Modelling
Maintenance
(excluding Operational)
|
|
2019/20
|
$1,181,600
|
$702,692
|
|
2020/21
|
$1,230,400
|
$642,802
|
|
2021/22
|
$1,277,800
|
$650,567
|
|
2022/23
|
$1,327,000
|
$797,780
|
|
2023/24
|
$1,378,200
|
$956,228
|
|
2024/25
|
$1,431,300
|
$1,036,413
|
|
2025/26
|
$1,489,400
|
$1,263,337
|
|
2026/27
|
$1,549,800
|
$1,519,834
|
|
2027/28
|
$1,612,600
|
$1,735,157
|
|
2028/29
|
$1,677,900
|
$2,110,545
|
|
TOTAL
|
$14,156,000
|
$11,415,360
|
Table 16
compares the LTFP budgets with the identified modelling maintenance over 10
years. The figures do not correlate as the LTFP budgets do not clearly separate
out operational and maintenance costs and building category. This highlights an
area for improvement which will enable better asset management and is noted in
the Improvement Plan.
The
actual operational expenditure in 2017/18 by task activity was $1,708,000
and the maintenance was $410,000 (total $2,117,786). The current
LTFP indicates an annual average maintenance and operational budget over 10
years of $1,415,600 which is insufficient. As an example maintenance
spend in the 2018 financial year was $410,000 compared to the
$1.1million required. (Modelling yearly average Table 16).
The maintenance budget averages at $410,000
(excluding operational costs)
compared to the target average of $1.1million.
Financial Challenges and Gaps
Table 17
details the required annual capital renewal budget gap of $185,567 and
maintenance budget gap of $1,900,000 that should be resolved so that the
high risk defects identified in the Maintenance Plan can be addressed.
Table 17 Financial Gaps
|
Annual Expenditure Type
|
Current Spend
2017/18
|
Gap
|
Required
Budget
|
|
Capital
Renewal
|
$1,543,790
|
$185,567
|
$1,729,357
|
|
Maintenance (excluding Operational)
|
$409,534
|
$1,900,000
|
$2,309,871
|
|
TOTAL
|
$1,953,324
|
$2,085,567
|
$4,039,891
|
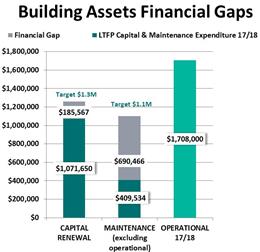
Financial Useful lives
The
next section will discuss the financial performance ratios. It is worth noting
that the useful lives figure derived from the Capital Value Register (CVR) and
the useful lives figure derived from modelling vary greatly (Figure 20). The
average useful life in modelling is 28 years compared with 59 years
in CVR.
For
completeness these performance ratios have been included but should NOT
be used to influence asset management decisions as, if taken out of context,
the assets appear to be performing well above benchmarks.
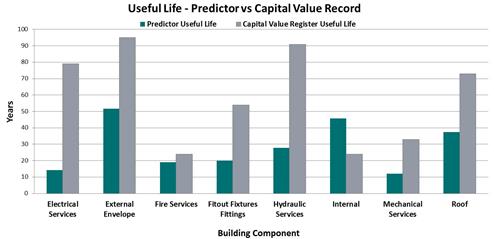
Figure 20 Useful Lives vs Capital Value Record
Average Useful life is lower than industry standard
due to deferred renewals and reduced preventative
maintenance.
Financial Ratios
Asset
Consumption Ratio
This
ratio seeks to highlight the aged condition of a local government’s stock
of physical assets.
If a
local government is responsibly maintaining and renewing/replacing its assets
in accordance with a well prepared asset management plan, then the fact that
the Asset Consumption Ratio may be relatively low and/or declining should not
be cause for concern – providing it is operating sustainably.

|
$62,459,000
$74,318,000
|
84%
|
Purpose: This
ratio measures the extent to which depreciable assets have been consumed by
comparing their written down value to their replacement cost.
Standards: Standard
is not met if less than 50%.
Standard is met if the ratio can be measured and is 50% or
greater (0.50 or >). Standard is improving if the ratio is between 60% and
75% (0.60 and 0.75).
Table 18 Asset Consumption
Ratios
|
Asset
Financial Class
|
Current
Replacement Cost
|
Depreciated
Replacement Cost
|
Ratio
|
Standard
|
|
Buildings
|
$74,318,000
|
$62,459,000
|
84%
|
Improving
|
Whilst
it appears that the asset consumption ratio is improving (Table 18) the
‘useful lives’ affect the depreciated replacement cost values
below. For completeness these performance ratios have been included but should NOT
be used to influence asset management decisions as, if taken out of context,
the assets appear to be performing well above benchmarks.
Asset
Sustainability Ratio
This
ratio is an approximation of the extent to which assets managed by a local
government are being replaced as they reach the end of their useful lives.
It is
calculated by measuring capital expenditure on renewal or replacement of
assets, relative to depreciation expense.
Expenditure
on new or additional assets is excluded.
Depreciation
expense represents an estimate of the extent to which the assets have been
consumed during that period.
Measuring
assets at fair value is critical to the calculation of a valid depreciation
expense value.

|
$1,597,201
$993,863
|
160.7%
|
Purpose: This
ratio indicates whether a local government is replacing or renewing existing
non-financial assets at the same rate that its overall asset stock is wearing
out.
Standards: Standard
is met if the ratio can be measured and is 90% (or 0.90)
Standard is improving if this ratio is between 90% and 110%
(or 0.90 and 1.10).
Table 19 Asset Sustainability
Ratio Figures
|
Asset
Financial Class
|
Annual
Planned Renewal Expenditure
|
Annual
Depreciation
|
Ratio
|
Standard
|
|
Buildings
|
$1,597,201
|
$993,863
|
160.7%
|
Improving
|
The Asset
Sustainability Ratio (Table 19) appears to indicate Council is
over-spending. However, the extensive condition assessment indicates that there
is a defect maintenance backlog of $1,900,000 and a 10 year capital gap of
$839,575. Also, $303,000 was spent in 2017/18 on internal capital renewals
which has distorted this figure to indicate a higher renewal performance which
is outside normal trends.
Asset
Renewal Funding Ratio
This
ratio indicates whether a local government has the financial capacity to fund
asset renewal as required, and can continue to provide existing levels of
services in future, without additional operating income; or reductions in
operating expenses.
The
ratio is calculated from information included in the local government’s Long
Term Financial Plan and Asset Management Plan; not the Annual Financial Report.
For
the ratio to be meaningful, a consistent discount rate should generally be
applied in Net Present Value (NPV) calculations

|
$10,746,500
$12,572,175
|
85.48%
|
Purpose: This
ratio is a measure of the ability of a local government to fund its projected
asset renewal / replacements in the future.
Standards: Standard
is met if the ratio is between 75% and 95% (or 0.75 and 0.95).
Standard is improving if the ratio is between 95% and 105%
(or 0.95 and 1.05), and
the ASR falls within the range 90% to 110% and 50% to 75%.
Standard not met if <75%.
Table 20 Asset Renewal Funding
Ratio Figures
|
Asset
Financial Class
|
Planned
Renewal Expenditure
|
Required
(Unlimited) Renewal Expenditure
|
Ratio
|
Standard
|
|
Buildings
|
$10,746,500
|
$12,572,175
|
85.48%
|
Met
|
Whilst
it appears that the asset Renewal Ratio (Table 20) is being met this can
change if future renewal funding were to be spent on assets that are not
essential instead of focussing on the renewal of assets and asset components
that are in poor condition.
Asset
Maintenance Ratio
This
ratio is reported in Council’s Annual Financial Statements as part of
Special Schedule 7 (SS7) – Condition of Infrastructure. This ratio
relates to the Council’s General Fund and it covers the assets that are
the subject of this Asset Management Plan plus Buildings. This ratio measures
the actual or estimated asset maintenance expenditure against required asset
maintenance. Council does not separate maintenance and operational costs
clearly in the general ledger. The actual costs have been calculated using work
orders and task activities. As such the figure below is for actual maintenance
only, excluding operational expenditure as otherwise this inflates the amount
spent on building maintenance. The benchmark for this ratio is 1 i.e.
maintenance expenditure equals required maintenance expenditure. Council is
currently not maintaining its assets as required. To calculate this Ratio, the
following formula is used:

Infrastructure
Backlog Ratio
This
ratio is reported in Council’s Annual Financial Statements as part of
Special Schedule 7 (SS7) – Condition of Infrastructure. It measures the
estimated cost to bring assets back to a satisfactory standard compared to the
total written down value of infrastructure assets. The benchmark for this ratio
is to have a backlog on an annual basis of 2.00% or less i.e. cost to bring
assets back to a satisfactory standard is less then 2.00% of the total written
down value of Infrastructure Assets equals required maintenance
expenditure. If the trend of this ratio is above the 2.00% benchmark it
demonstrates that Council is not addressing its Infrastructure backlog. This
is the case for Byron Shire Council.
To
calculate this Ratio, the following formula is used:

|
$6,411,145
$62,460,000
|
10%
|
(Note: Total written down value of infrastructure assets was
calculated on the 30/06/2018)
Figure
21 Asset Maintenance Ratio General Fund SS7 and Figure 22 Infrastructure
Backlog Ratio General Fund SS7 identifies the outcome relevant for Council for
the period 2016/2017 to 2025/2026.
13. Improvement
Plan
A
comprehensive list of improvement actions are detailed in Table 21 below to
address issues that have been identified in this Asset Management Plan.
Table 21 Improvement actions summary
|
Item
|
Identified
issue for improvement
|
Responsible
officer
|
|
1. Building Maintenance
& Capital Renewal responsibilities
|
Responsibility for building maintenance and capital
renewal is shared across the organisation leading to potential gaps. For
example, this is identified in Maintenance and Inspection Table 10.
|
Director of Infrastructure
Services (DIS) and Director Corporate and Community Services
(DCCS)
|
|
2. Capital Renewal Gap
|
Investigate options to review the annual financial
capital renewal gap of $185,567
|
DIS and DCCS
|
|
3. Maintenance Gap
|
Investigate options to review the annual financial
maintenance gap of $690,466.
|
DIS and DCCS
|
|
4. Operational
Expenditure
|
Review high operational expenditure to reduce and
optimise and then allocate funds into preventative maintenance ($1,708,000 in
2017/18).
|
DIS and DCCS
|
|
5. Long Term Financial
Plan structure
|
The LTFP does not provide forward funding for all
building categories. For example there is no provision for Emergency
Services, Tyagarah Airfield, Bangalow Showgrounds, and Council Operational
buildings (except the main depot and administration building. The pool
buildings are not separately accounted for and are treated as a whole
facility with the pool assets which does not allow for long term financial
planning or asset management.
|
Manager of Finance (MF) and
DIS and DCCS
|
|
6. Capital Renewal Plan
|
Predictor modelling should be used to dictate the LTFP
and future capital renewal works rather than subjective assessments.
|
DIS and DCCS
|
|
7. Maintenance Plan
|
The “Maintenance Plan” generated from the
inspections which identified the 1600 defects should be used to dictate the
levels of service and address high risk defects.
|
DIS and DCCS
|
|
8. Long Term Financial
Plan (LTFP) - Operational & Maintenance
|
The
LTFP needs to separate out the operational and maintenance costs by building
category to better manage the assets into the future and to align with the
Predictor© Modelling systems.
|
MF
|
|
9. BSC Sponsor responsible.
|
• Country Women’s Association (CWA)
• Brunswick Heads Historical Society, Mullumbimby
• Mullumbimby Golf Club Shed (Crown land Council
Administered)
|
DIS and DCCS
|
|
10. No lease or Licenses
|
Some building assets have no existing leases or license
arrangements:
• Country Women’s Association (CWA), Mullumbimby
Tincogan and Gordon St
• Brunswick Heads Historical Society, Mullumbimby
• Kohinur Hall, Main Arm
• Scouts Byron Bay
• Mullumbimby Pre-school (in progress)
• All Sporting Clubs (only user agreement that generally
deals with the sports grounds)
|
Leasing Coordinator
Leasing Coordinator / Manager of Open Spaces
|
|
11. Public Toilets
|
Unclear organisational responsibilities mean available
funds for capital renewal have not been used in recent financial years.
|
DIS
|
|
10. Gutter maintenance
|
Routine gutter maintenance was identified with the
inspections as lacking for all buildings. It is worth noting for halls this
is the responsibility of the Section 355 Committees. Attention need to be
drawn to this maintenance requirement as it is not detailed in the document E2016/79739 but assumed along with general maintenance. Long term the buildings are affected and
structural defects are occurring due to the continued lack of maintenance
with stormwater running down external walls. Leases need updating to include
gutter maintenance etc.
|
Buildings Maintenance Coordinator / Leasing Coordinator
|
|
11. Disposal
|
Two buildings that are impaired and closed (Federal
Parkland shed and Byron Grandstand/Office/Storage). These assets need to be
accounted for as impaired and plans to dispose of the asset to reduce risk
exposure.
|
Manager of Open Spaces (MOS)
|
|
12. Public Toilets
– Crown Owned
|
The 3 toilets at Brunswick Heads owned by the crown are
in poor condition and the community is dissatisfied with the performance of
the toilets. The Reflections Holiday Board intend on replacing these in
2019/20. It is recommended that signs are installed on the assets to advise
the community who is the owner.
|
MOS
|
|
13. Remaining Useful Life
|
Future
financial asset re-valuations of buildings to review remaining useful life
with overall condition data. (The conclusion is that the remaining life data
from the financial register does not align well with the building condition
audit consumption profiles.)
|
Asset Management Accountant
|
|
14. Key Access
|
Inspection process identified key access to buildings was
significantly hindered as council does not have keys to a significant number
of community buildings. Additionally, there could be improvements made to the
master key arrangement and naming convention for the building key register.
|
Buildings Maintenance Coordinator
|
|
15. Technical Levels
of Service – Inspection & Maintenance
|
There
are gaps in information from the Technical Levels of Service Table 5. The
condition and safety inspections have no measurement of performance, and
Planned and Reactive tasks to have performance targets set and current
performance is to be determined.
|
Buildings Maintenance Coordinator
|
|
16. Building Under
construction for 2 years
|
H.H.7 - Hippy Hut 7 (Safari tent) half built construction
started in 2017.
|
Manager of Open Spaces
|
|
17. Building Names
|
Names are used interchangeable across asset systems such
as the Asset Register/GIS, Key Register, Insurance valuation register and the
community. It is recommended that the Asset Register is now used as the
single point of truth since the inspection audit has been complete.
|
Buildings Maintenance Coordinator / Asset Management
Coordinator / Insurance Officer
|
|
18. Disability and Discrimination
Act
|
Consider Disability and
Discrimination Act were possible with all capital renewals and upgrades.
|
DIS and DCCS
|
There are 18 items identified in the Improvement Plan.
Glossary
|
Asset condition assessment
|
The process of continuous or periodic inspection, assessment,
measurement and interpretation of the resultant data to indicate the
condition of a specific asset so as to determine the need for some
preventative or remedial action.
|
|
Asset management
|
The combination of management, financial, economic, engineering
and other practices applied to physical assets with the objective of
providing the required level of service in the most cost effective manner.
|
|
Assets
|
Future economic benefits controlled by the entity as a result of
past transactions or other past events (AAS27.12).
Property, plant and equipment including infrastructure and other
assets (such as furniture and fittings) with benefits expected to last more
than 12 month.
|
|
Backlog
|
Estimated cost to bring infrastructure, buildings and other
structures and depreciable land improvements to a satisfactory standard,
measured at a particular point in time
|
|
Capital expenditure
|
Relatively large (material) expenditure, which has benefits,
expected to last for more than 12 months. Capital expenditure includes
renewal, expansion and upgrade. Where capital projects involve a combination
of renewal, expansion and/or upgrade expenditures, the total project cost
needs to be allocated accordingly.
|
|
Capital funding
|
Funding to pay for capital expenditure.
|
|
Capital new expenditure
|
Expenditure which creates a new asset providing a new service to
the community that did not exist beforehand. As it increases service
potential it may impact revenue and will increase future operating and
maintenance expenditure.
|
|
Capital renewal expenditure
|
Expenditure on an existing asset, which returns the service
potential or the life of the asset up to that which it had originally. It is
periodically required expenditure, relatively large (material) in value
compared with the value of the components or sub-components of the asset
being renewed. As it reinstates existing service potential, it has no impact
on revenue, but may reduce future operating and maintenance expenditure if
completed at the optimum time, e.g. resurfacing or resheeting a material part
of a building portfolio, replacing a material section of a drainage network
with pipes of the same capacity, resurfacing an oval. Where capital projects
involve a combination of renewal, expansion and/or upgrade expenditures, the
total project cost needs to be allocated accordingly.
|
|
Capital upgrade expenditure
|
Expenditure, which enhances an existing asset to provide a
higher level of service or expenditure that will increase the life of the
asset beyond that which it had originally. Upgrade expenditure is
discretional and often does not result in additional revenue unless direct
user charges apply. It will increase operating and maintenance expenditure in
the future because of the increase in the Council’s asset base, e.g.
widening the sealed area of an existing road, replacing drainage pipes with
pipes of a greater capacity, enlarging a grandstand at a sporting facility.
Where capital projects involve a combination of renewal, expansion and/or
upgrade expenditures, the total project cost needs to be allocated
accordingly.
|
|
Carrying amount
|
The amount at which an asset is recognised after deducting any
accumulated depreciation / amortisation and accumulated impairment losses
thereon.
|
|
Component
|
An individual part of an asset which contributes to the
composition of the whole and can be separated from or attached to an asset or
a system. Also referred to as an element.
|
|
Cost of an asset
|
The amount of cash or cash equivalents paid or the fair value of
the consideration given to acquire an asset at the time of its acquisition or
construction, plus any costs necessary to place the asset into service. This
includes one-off design and project management costs.
|
|
Current replacement cost (CRC)
|
The cost the entity would incur to acquire the asset on the
reporting date. The cost is measured by reference to the lowest cost at which
the gross future economic benefits could be obtained in the normal course of
business or the minimum it would cost, to replace the existing asset with a
technologically modern equivalent new asset (not a second hand one) with the
same economic benefits (gross service potential) allowing for any differences
in the quantity and quality of output and in operating costs.
|
|
Current Replacement Cost “As New” (CRC)
|
The current cost of replacing the original service potential of
an existing asset, with a similar modern equivalent asset, i.e. the total
cost of replacing an existing asset with an as NEW or similar asset expressed
in current dollar values.
|
|
Cyclic Maintenance
|
Replacement of higher value components/sub-components of assets
that is undertaken on a regular cycle including repainting, building roof
replacement, cycle, replacement of air conditioning equipment, etc. This work
generally falls below the capital/ maintenance threshold and needs to be
identified in a specific maintenance budget allocation.
|
|
Depreciable amount
|
The cost of an asset, or other amount substituted for its cost,
less its residual value (AASB 116.6)
|
|
Depreciated replacement cost (DRC)
|
The current replacement cost (CRC) of an asset less, where
applicable, accumulated depreciation calculated on the basis of such cost to
reflect the already consumed or expired future economic benefits of the asset
|
|
Depreciation / amortisation
|
The systematic allocation of the depreciable amount (service
potential) of an asset over its useful life.
|
|
Economic life
|
See useful life definition.
|
|
Expenditure
|
The spending of money on goods and services. Expenditure
includes recurrent and capital.
|
|
Fair value
|
The amount for which an asset could be exchanged, or a liability
settled, between knowledgeable, willing parties, in an arm’s length
transaction.
|
|
Greenfield asset values
|
Asset (re)valuation values based on the cost to initially
acquire the asset.
|
|
Heritage asset
|
An asset with historic, artistic, scientific, technological,
geographical or environmental qualities that is held and maintained
principally for its contribution to knowledge and culture and this purpose is
central to the objectives of the entity holding it.
|
|
Impairment Loss
|
The amount by which the carrying amount of an asset exceeds its
recoverable amount.
|
|
Infrastructure assets
|
Physical assets of the entity or of another entity that
contribute to meeting the public's need for access to major economic and
social facilities and services, e.g. roads, drainage, footpaths and Shared
Paths. These are typically large, interconnected networks or portfolios of
composite assets. The components of these assets may be separately
maintained, renewed or replaced individually so that the required level and
standard of service from the network of assets is continuously sustained.
Generally the components and hence the assets have long lives. They are fixed
in place and are often have no market value.
|
|
Level of service
|
The defined service quality for a particular service against
which service performance may be measured. Service levels usually relate to
quality, quantity, reliability, responsiveness, environmental, acceptability
and cost).
|
|
Life Cycle Cost
|
The life cycle cost (LCC) is average cost to provide the service
over the longest asset life cycle. It comprises annual maintenance and asset
consumption expense, represented by depreciation expense. The Life Cycle Cost
does not indicate the funds required to provide the service in a particular
year.
|
|
Life Cycle Expenditure
|
The Life Cycle Expenditure (LCE) is the actual or planned annual
maintenance and capital renewal expenditure incurred in providing the service
in a particular year. Life Cycle Expenditure may be compared to Life Cycle
Expenditure to give an initial indicator of life cycle sustainability.
|
|
Maintenance and renewal gap
|
Difference between estimated budgets and projected expenditures
for maintenance and renewal of assets, totalled over a defined time (e.g. 5,
10 and 15 years).
|
|
Maintenance and renewal sustainability index
|
Ratio of estimated budget to projected expenditure for
maintenance and renewal of assets over a defined time (e.g. 5, 10 and 15
years).
|
|
Maintenance expenditure
|
Recurrent expenditure, which is periodically or regularly
required as part of the anticipated schedule of works required to ensure that
the asset achieves its useful life and provides the required level of
service. It is expenditure, which was anticipated in determining the asset’s
useful life.
|
|
Materiality
|
An item is material is its omission or misstatement could
influence the economic decisions of users taken on the basis of the financial
report. Materiality depends on the size and nature of the omission or
misstatement judged in the surrounding circumstances.
|
|
Modern equivalent asset.
|
A structure similar to an existing structure and having the
equivalent productive capacity, which could be built using modern materials,
techniques and design. Replacement cost is the basis used to estimate the
cost of constructing a modern equivalent asset.
|
|
Non-revenue generating investments
|
Investments for the provision of goods and services to sustain
or improve services to the community that are not expected to generate any
savings or revenue to the Council, e.g. parks and playgrounds, footpaths,
roads and bridges, libraries, etc.
|
|
Operating expenditure
|
Recurrent expenditure, which is continuously required excluding
maintenance and depreciation, e.g. power, fuel, staff, plant equipment, on-costs
and overheads.
|
|
Planned Maintenance
|
Repair work that is identified and managed through a maintenance
management system (MMS). MMS activities include inspection, assessing the
condition against failure/breakdown criteria/experience, prioritising scheduling,
actioning the work and reporting what was done to develop a maintenance
history and improve maintenance and service delivery performance.
|
|
Rate of annual asset consumption
|
A measure of average annual consumption of assets (AAAC)
expressed as a percentage of the depreciable amount (AAAC/DA). Depreciation
may be used for AAAC.
|
|
Rate of annual asset renewal
|
A measure of the rate at which assets are being renewed per
annum expressed as a percentage of depreciable amount (capital renewal
expenditure/DA).
|
|
Rate of annual asset upgrade
|
A measure of the rate at which assets are being upgraded and
expanded per annum expressed as a percentage of depreciable amount (capital
upgrade/expansion expenditure/DA).
|
|
Reactive maintenance
|
Unplanned repair work that carried out in response to service
requests and management/supervisory directions.
|
|
Recoverable amount
|
The higher of an asset's fair value, less costs to sell and its
value in use.
|
|
Recurrent expenditure
|
Relatively small (immaterial) expenditure or that which has
benefits expected to last less than 12 months. Recurrent expenditure includes
operating and maintenance expenditure.
|
|
Recurrent funding
|
Funding to pay for recurrent expenditure.
|
|
Rehabilitation
|
See capital renewal expenditure definition above.
|
|
Remaining life
|
The time remaining until an asset ceases to provide the required
service level or economic usefulness. Age plus remaining life is economic
life.
|
|
Renewal
|
See capital renewal expenditure definition above.
|
|
Residual value
|
The net amount which an entity expects to obtain for an asset at
the end of its useful life after deducting the expected costs of disposal.
|
|
Risk management
|
The application of a formal process to the range of possible
values relating to key factors associated with a risk in order to determine
the resultant ranges of outcomes and their probability of occurrence.
|
|
Section or segment
|
A self-contained part or piece of an infrastructure asset.
|
|
Service potential
|
The capacity to provide goods and services in accordance with
the entity's objectives, whether those objectives are the generation of net
cash inflows or the provision of goods and services of a particular volume
and quantity to the beneficiaries thereof.
|
|
Service potential remaining
|
A measure of the remaining life of assets expressed as a
percentage of economic life. It is also a measure of the percentage of the
asset’s potential to provide services that are still available for use
in providing services (DRC/DA).
|
|
Strategic Management Plan
|
Documents Council objectives for a specified period (3-5 years),
the principle activities to achieve the objectives, the means by which that
will be carried out, estimated income and expenditure, measures to assess
performance and how rating policy relates to the Council’s objectives
and activities.
|
|
Sub-component
|
Smaller individual parts that make up a component part.
|
|
Useful life
|
Either:
(a) the period over which an asset is expected to be available for use by an
entity, or
(b) the number of production or similar units expected to be obtained from
the asset by the entity.
It is estimated or expected time between placing the asset into
service and removing it from service, or the estimated period of time over
which the future economic benefits embodied in a depreciable asset, are
expected to be consumed by the Council. It is the same as the economic life.
|
14. APPENDIX
A Special Schedule 7 – Buildings at 30 June 2018
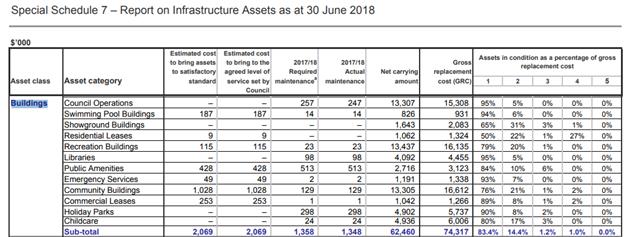
15.
APPENDIX B – Licences & Leases
Licence
List
|
License owner
|
Parcel
|
|
Reference
|
Issued
|
Start
|
End
|
Owner
|
|
Katia Nursery
|
94860
|
45 Wallum Place, Byron Bay
|
S2017/4863
|
Annual
|
01/05/2017
|
30/04/2022
|
Licensee
|
|
Mullumbimby SEED Inc.
|
138870
|
125 Shara Boulevard, Ocean
Shores
|
S2015/15760
|
Monthly
|
04/10/2015
|
03/04/2020
|
Licensee
|
|
Byron Bay Community
Association Inc. (Girl Guides Byron)
|
177670
|
35 Carlyle St, Byron Bay
|
E2016/27961
|
Annual
|
01/06/2016
|
31/05/2018
|
BSC
|
|
Mr W F Bailey
|
205770
|
25 Staceys Way, Tyagarah
|
DM752182
|
Monthly
|
01/07/2007
|
30/06/2012
|
|
|
SEED Mullumbimby
Sustainability Education & Enterprises
|
239417
|
154 Stuart St, Mullumbimby
|
S2016/3326
|
Monthly
|
01/03/2015
|
31/08/2019
|
Licensee
|
Lease
List
|
Applicant
|
Parcel
|
Trim Ref
|
Start
|
End
|
Holding over
|
|
Andrew Bates Tennis Pty Ltd
|
177670
|
S2013/449
|
07/01/2013
|
06/01/2019
|
No
|
|
Federal Community
Children’s Centre
|
105960
|
S2017/6224
|
01/01/2017
|
31/12/2022
|
No
|
|
**Byron Gliding Club Inc.
|
241414
|
DM384745
|
01/01/2002
|
31/12/2008
|
Yes
|
|
**Byron Gem & Lapidary
Club Incorporated
|
208030
|
DM568518
|
01/01/2006
|
31/12/2010
|
Yes
|
|
North Coast Community
Housing
|
66820
|
S2017/20590
|
01/05/2017
|
30/04/2027
|
No
|
|
Bangalow Community
Pre-School
|
121260
|
E2014/48235
|
01/05/2014
|
30/04/2019
|
No
|
|
Mullumbimby Tennis
Association Inc
|
238167
|
S2014/6357
|
01/05/2014
|
30/04/2019
|
No
|
|
Byron Bay Community
Association Inc (Byron Girl Guides Hall)
|
177670
|
E2016/27961
|
01/06/2016
|
31/05/2018
|
No
|
|
*Fishheads @ Byron Pty Ltd
|
238186
|
S2015/8262;
S2017/15540
|
01/07/2015
|
30/06/2020
|
No
|
|
Brunswick Valley Historical
Society (Museum) Note – Not Councils building
|
238167
|
S2014/13674
|
01/07/2014
|
30/06/2019
|
No
|
|
Durrumbul Community
Pre-school
|
200770
|
S2014/11704
|
01/07/2014
|
30/06/2024
|
No
|
|
Brunswick Surf Life Saving
Club
|
181600
|
E2017/111545
|
01/07/2017
|
30/06/2018
|
No
|
|
Byron Bay Surf Life Saving
Club Inc
|
238790
|
E2017/69026
|
01/07/2017
|
30/06/2018
|
No
|
|
Byron Bay Pre-School Inc
(Cavanbah Centre)
|
50050
|
S2013/9831
|
01/07/2013
|
30/06/2018
|
Yes
|
|
Byron Youth Service
(sub-lease War Widows Cottage)
|
30220
|
S2017/15617
|
01/07/2017
|
30/06/2022
|
No
|
|
**Mr W F Bailey
|
205770
|
DM752182
|
01/07/2007
|
30/06/2012
|
Yes
|
|
**Cape Byron Pistol Club
Inc.
|
241414
|
DM819094
|
31/07/2008
|
31/12/2010
|
Yes
|
|
**Clay Target Club
|
241414
|
DM826801
|
31/07/2008
|
31/12/2010
|
Yes
|
|
Brunswick Heads Tennis Club
Inc.
|
198340
|
E2017/72293
|
01/08/2017
|
31/07/2018
|
No
|
|
Mullumbimby & District
Neighbourhood Centre Inc. (sub-lease old Council Chambers)
|
18210
|
S2017/14477
|
01/08/2017
|
31/07/2022
|
No
|
|
Ocean Shores Pre School Inc.
|
132520
|
S2017/1702
|
01/08/2016
|
31/07/2022
|
No
|
|
Byron Bay Pre-School Inc.
(Coogera Center)
|
240275
|
DM870265
|
23/08/2010
|
22/08/2031
|
No
|
|
Byron Shire Toy Library
|
240275
|
S2015/14837
|
23/08/2015
|
22/08/2016
|
Yes
|
|
Byron Shire Early Intervention
Association
|
240275
|
DM870267
|
23/08/2010
|
22/08/2031
|
No
|
|
Mullumbimby District
Cultural Centre Inc.
|
35480
|
S2016/11873
|
01/09/2016
|
31/08/2021
|
No
|
|
Community Learning &
Innovation Centre Inc.
|
7090
|
S2012/2245
|
09/09/2012
|
08/09/2022
|
No
|
|
*Byron Visitor Centre
|
187190
|
S2017/21019
|
01/10/2017
|
30/09/2020
|
No
|
|
*Mullumbimby Golf Club
|
171450
|
S2015/11329
|
01/10/2014
|
30/09/2024
|
No
|
|
Secretary Scouts Association
of Australia (Bangalow)
|
85400
|
E2017/89895
|
01/10/2017
|
30/09/2018
|
No
|
|
Secretary Scouts Association
of Australia (Bangalow)
|
85430
|
E2017/89896
|
01/10/2016
|
30/09/2018
|
No
|
|
Secretary Scouts Association
of Australia (Mullumbimby)
|
7110
|
E2017/89893
|
01/10/2016
|
30/09/2018
|
No
|
|
**Callanan Holdings Pty Ltd
|
205780
|
DM539775
|
01/10/2005
|
30/09/2009
|
Yes
|
|
Lilly Pilly Community
Pre-School
|
203090
|
S2014/3916
|
01/12/2013
|
30/11/2018
|
No
|
|
Australian Red Cross Society
(Brunswick Memorial Hall)
|
24270
|
S2014/1588;
S2017/16796
|
01/12/2013
|
30/11/2018
|
No
|
|
Australian Red Cross Society
(Brunswick Memorial Hall)
|
24270
|
S2014/1587;
S2017/16797
|
01/12/2013
|
30/11/2018
|
No
|
|
**Tiger Moth Aerial Service
Pty Ltd
|
208040
|
DM617944
& DM568500
|
01/12/2010
|
30/11/2015
|
Yes
|
Note1:
Brunswick Valley Historical Society (Museum) is NOT council owned by
Council resolution 14-236.
*Commercial lease **Tyagarah Airfield Commercial lease
16. APPENDIX
C – Overall Building Condition
Council
calculated an overall building condition using a weighted average. A weighted
average is an average in which each observation in the data set which is
assigned or multiplied by a weight before summing to a single average value. In
this instance, each Building Element Condition Score to be averaged is assigned
a weight (Buildings Element Hierarchy) that determines the relative importance
of each Buildings Element.
To
calculate a weighted average, each condition score (Building Element Condition
Score) is multiplied in the set by its weight (Building Element Hierarchy).
This results in a Building Element Hierarchy Score (BEH Score). The products
are added and divided by sum by the sum of all conditions.
Below
is how the weighted average condition is calculated.
Weighted
Average OCI =
((Building
Element Condition Score1 x Building Element Hierarchy1)
+ (Building Element Condition Score2
x Building Element Hierarchy2) + … Building Element Condition
Scoren x Building Element Hierarchyn))
______________________________________________________________________________________
(Building Element Condition Score1 + Building Element Condition Score2
+ … Building Element Condition Scoren)
Note:
The above use of the word element is the same as component.
1.
17. APPENDIX D –
Capital Works Plan (3 years only)
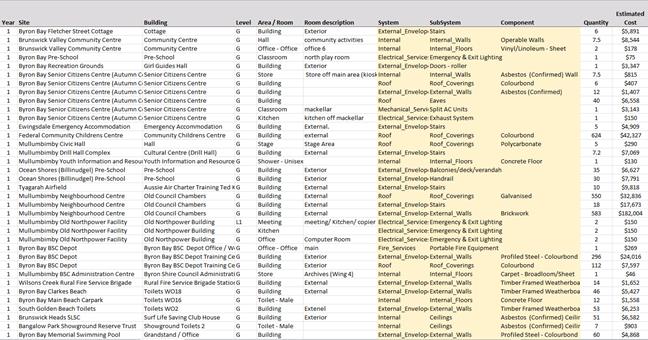
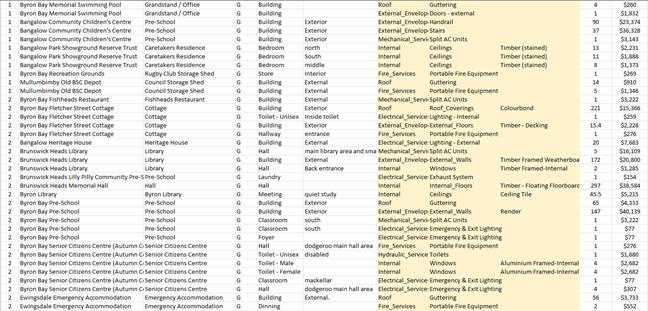
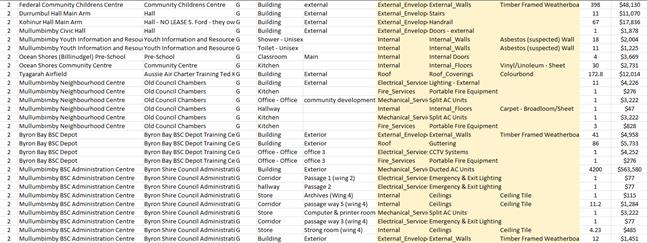

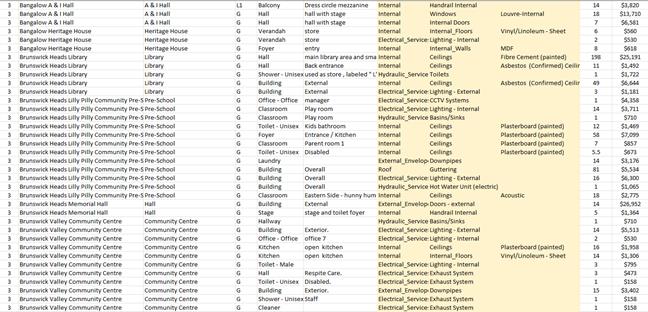
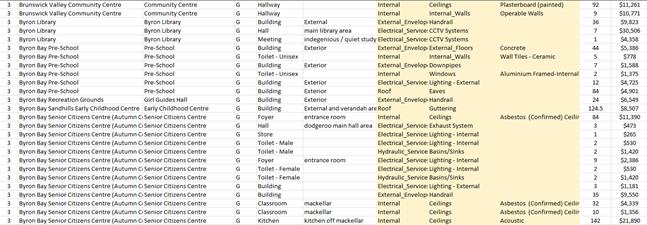
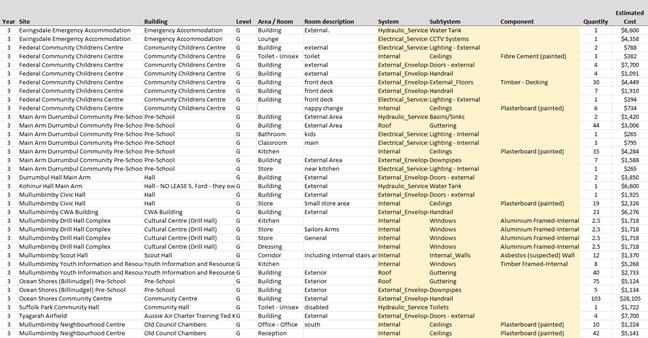
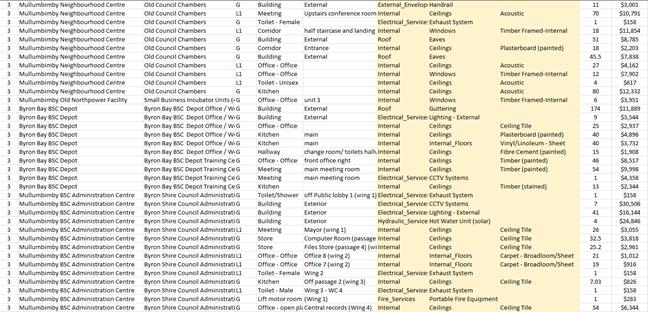
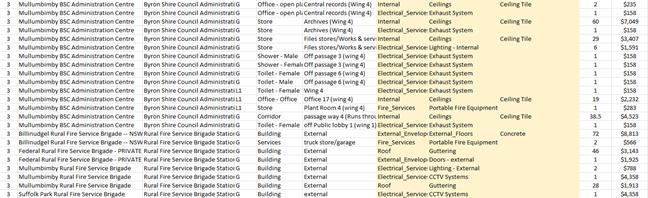
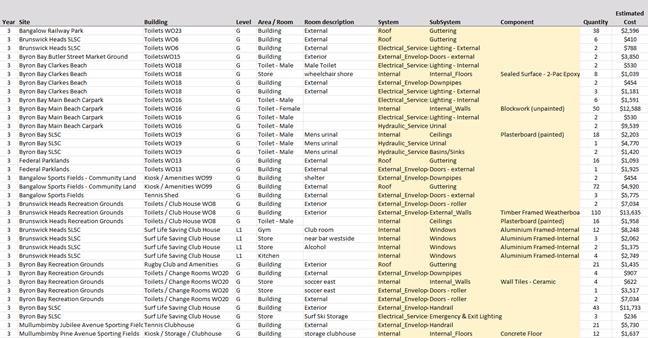
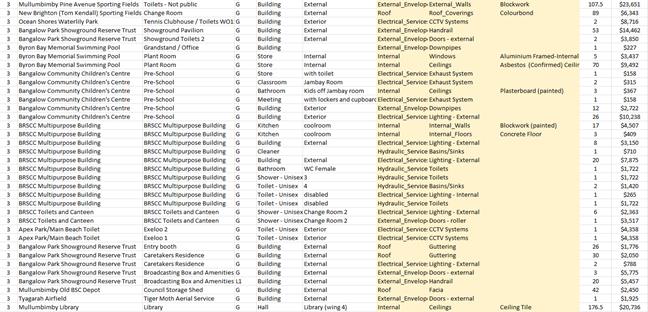
18.
APPENDIX E – Asset Levels of Service Community
Engagement
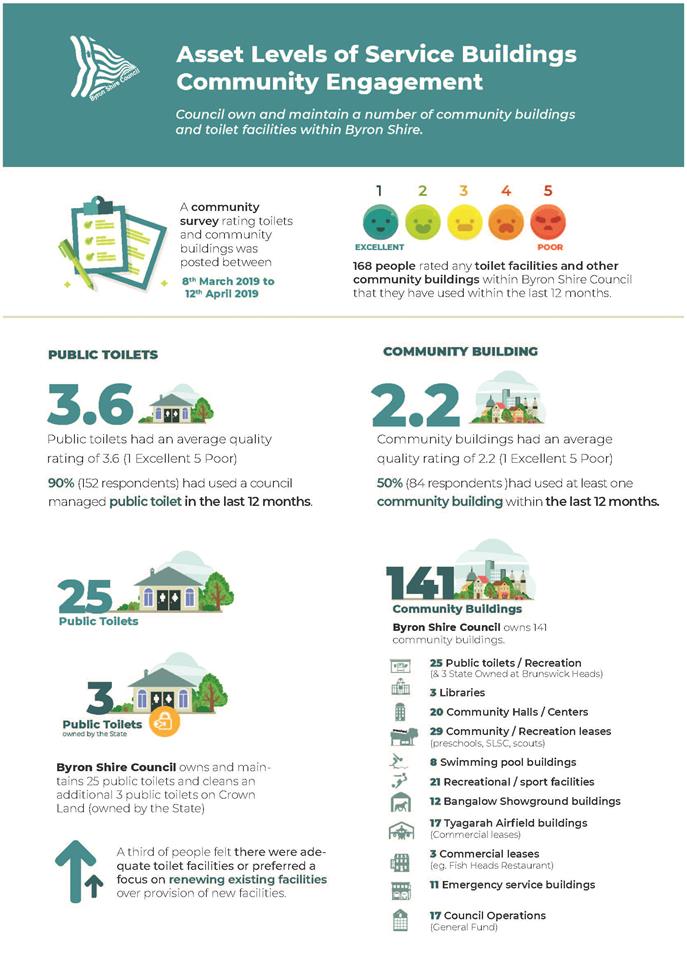
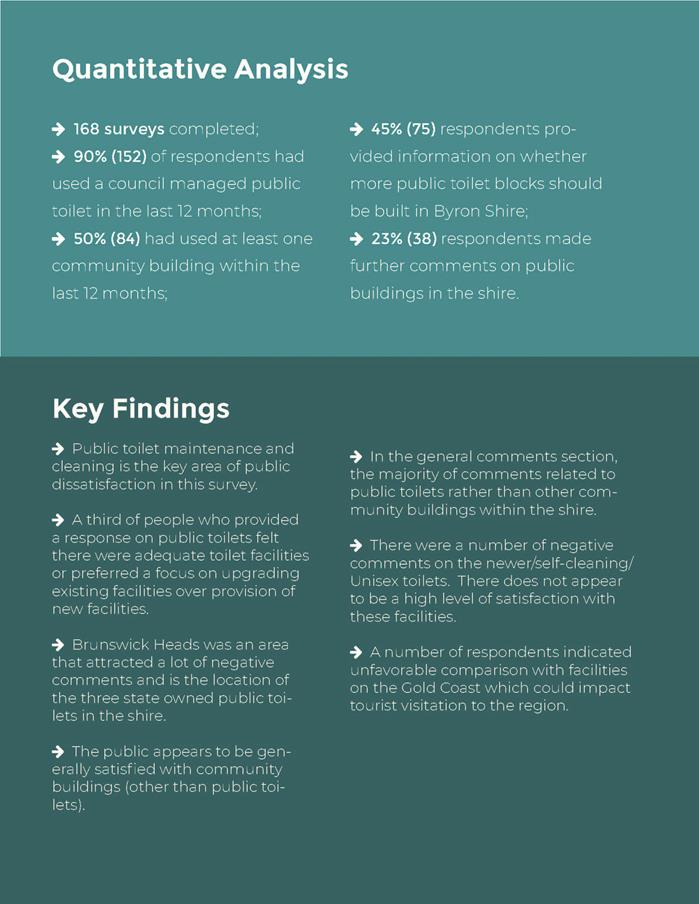
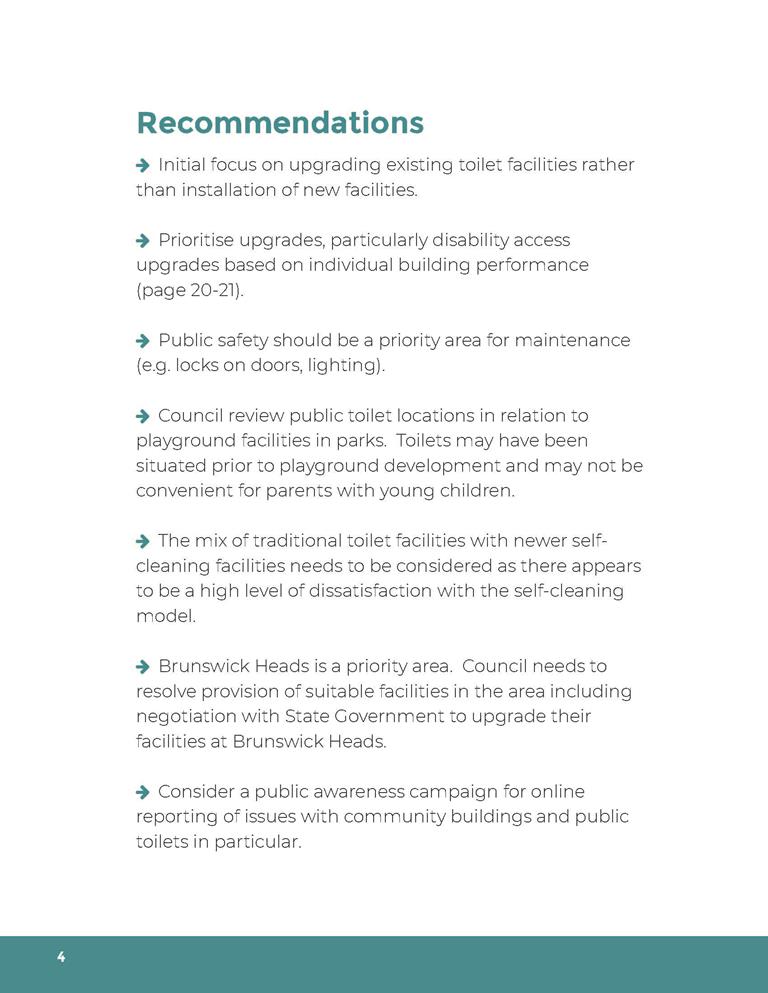
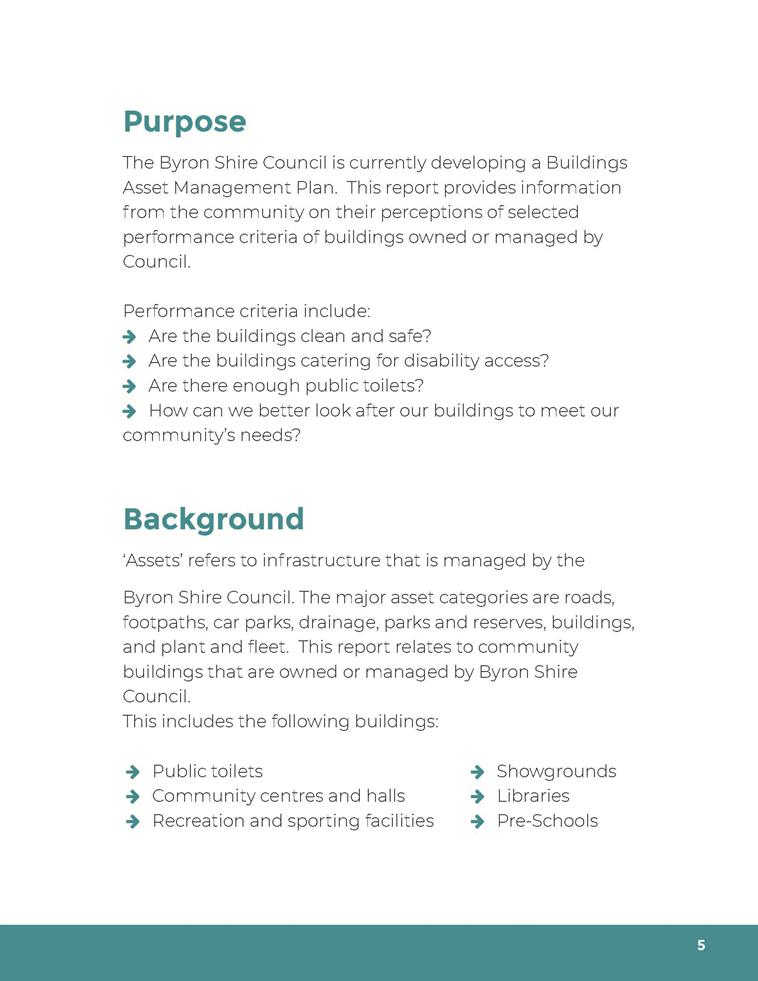
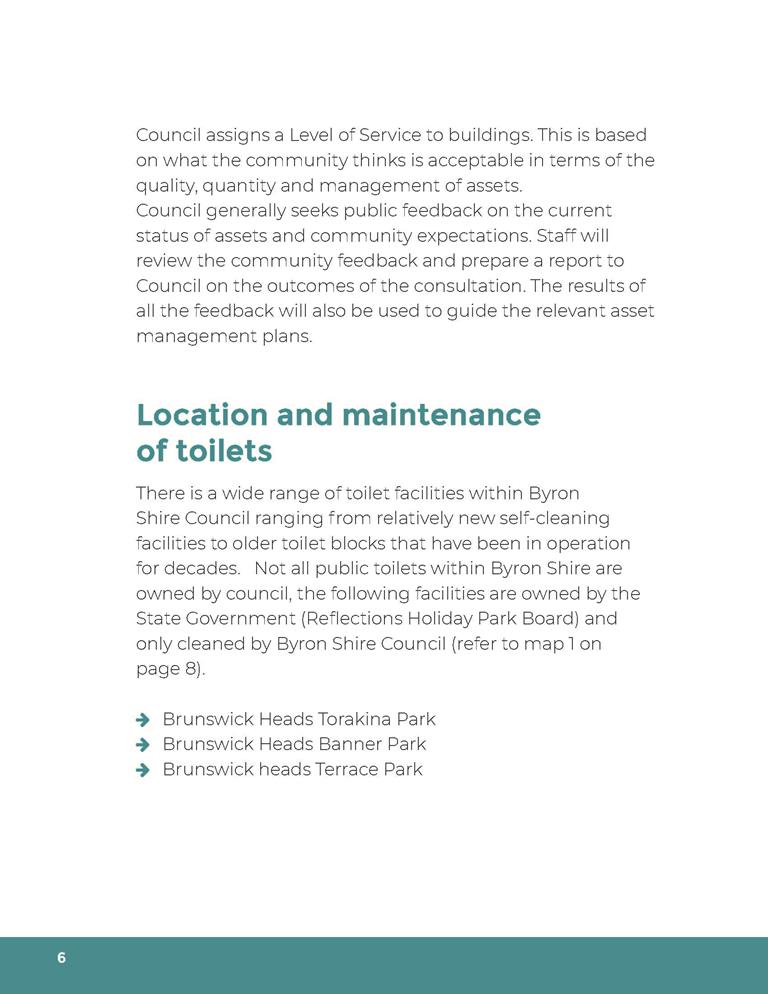

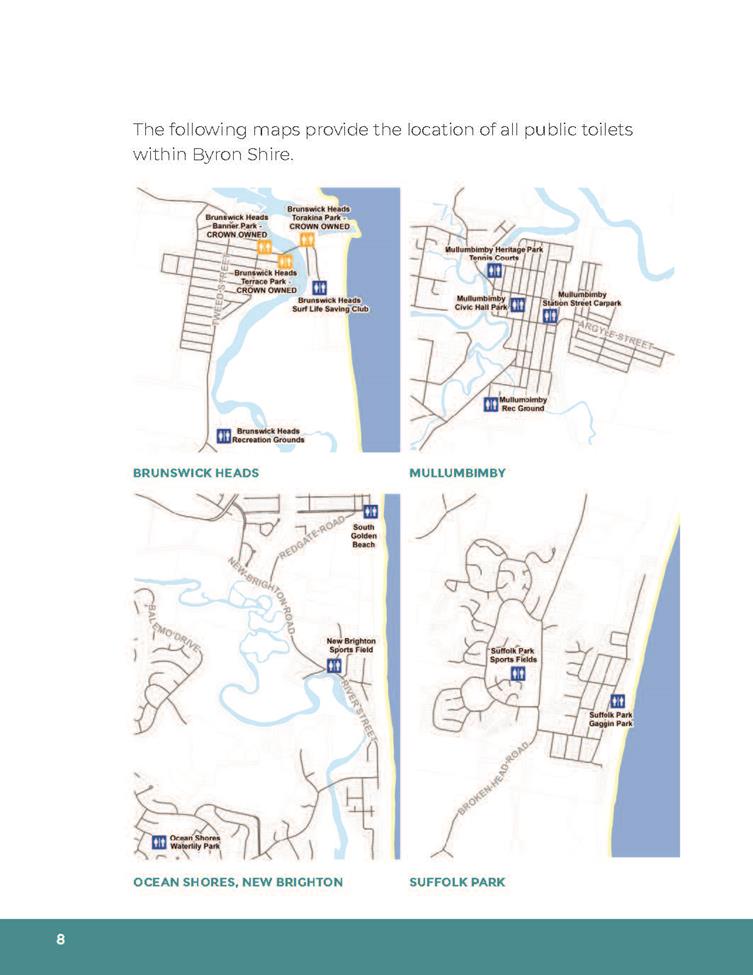
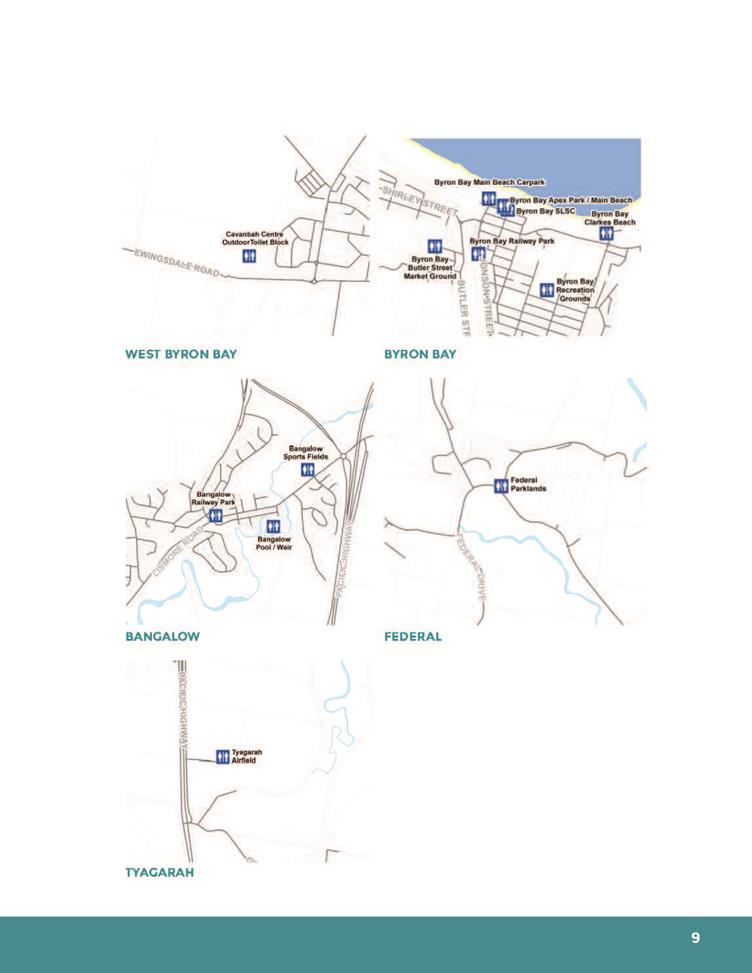
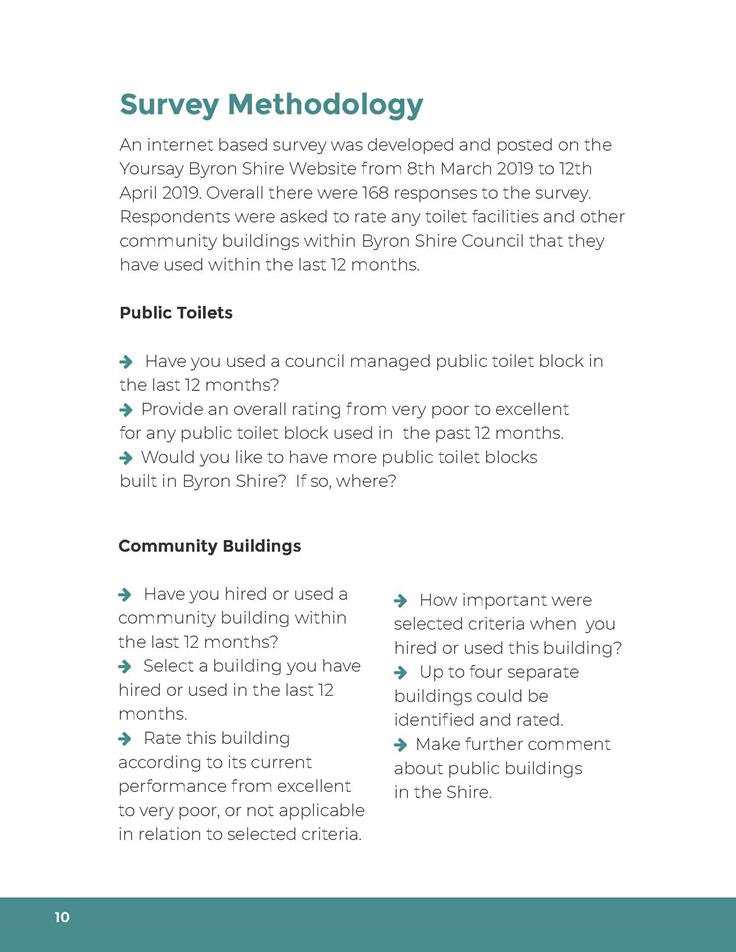
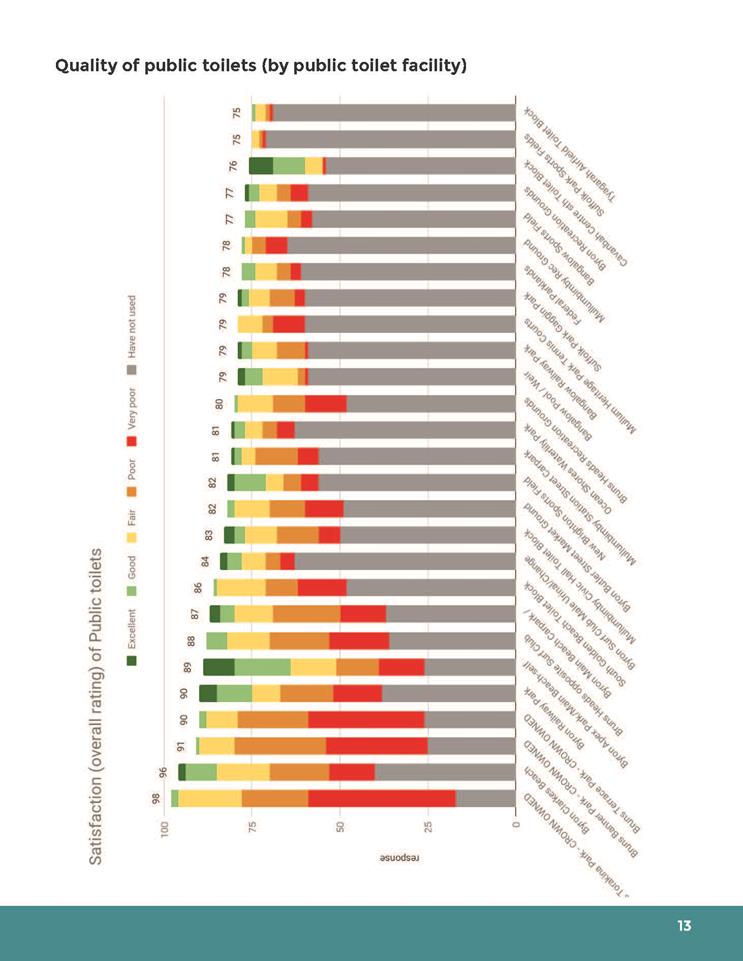
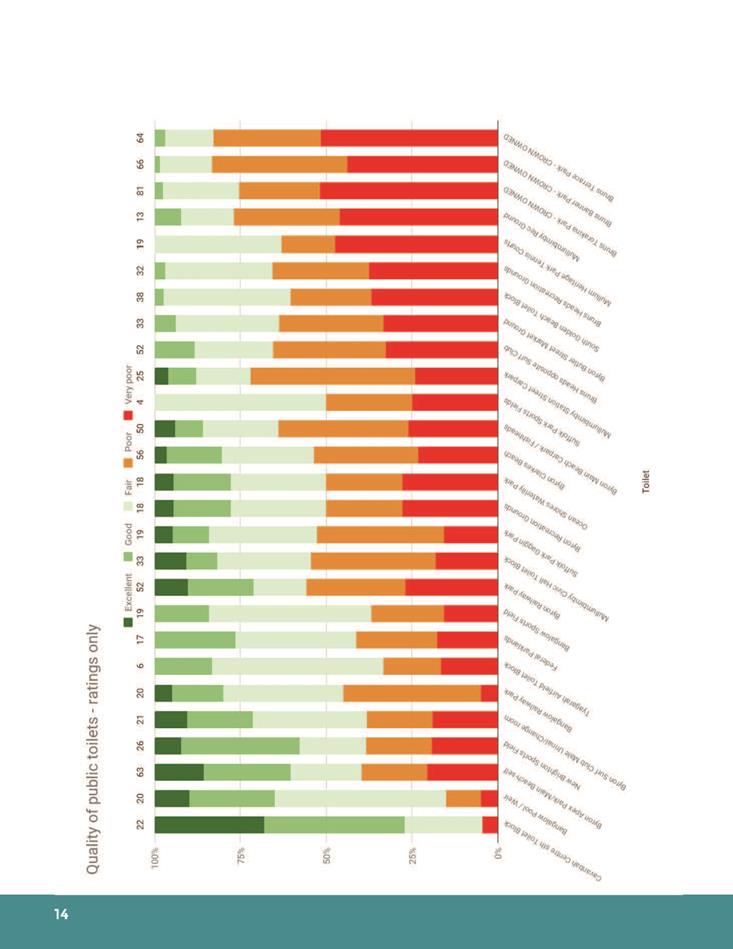
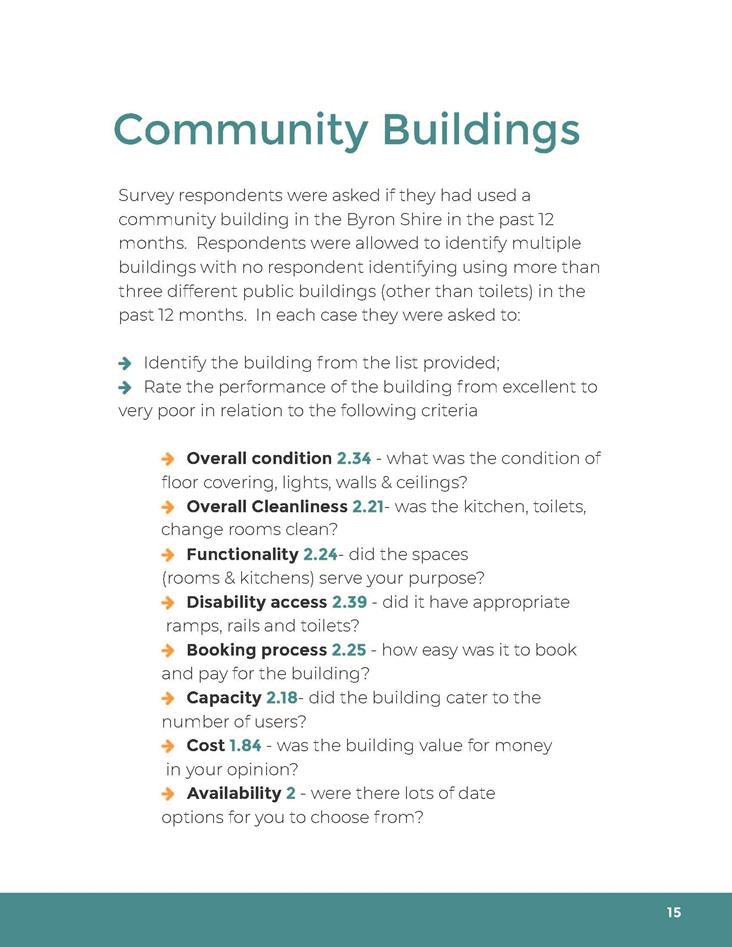
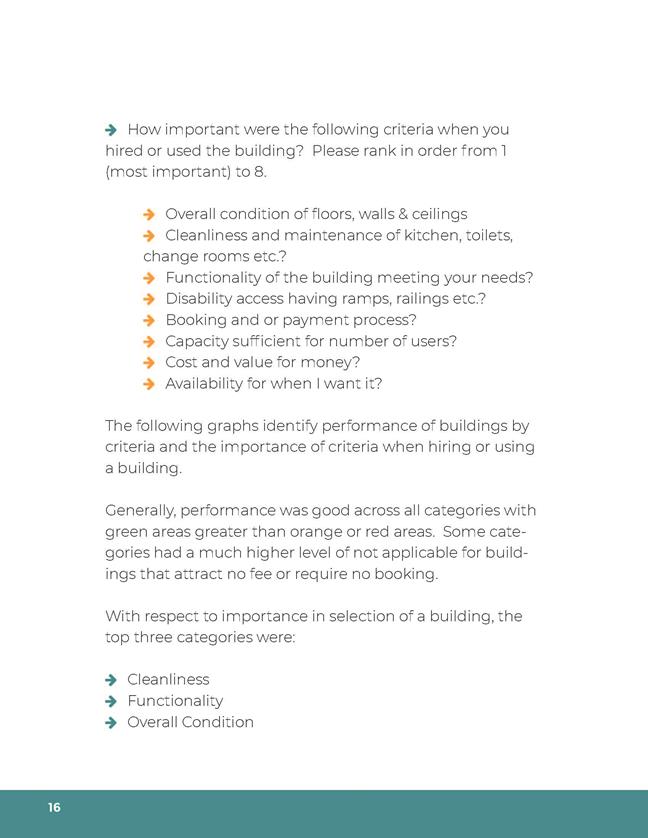
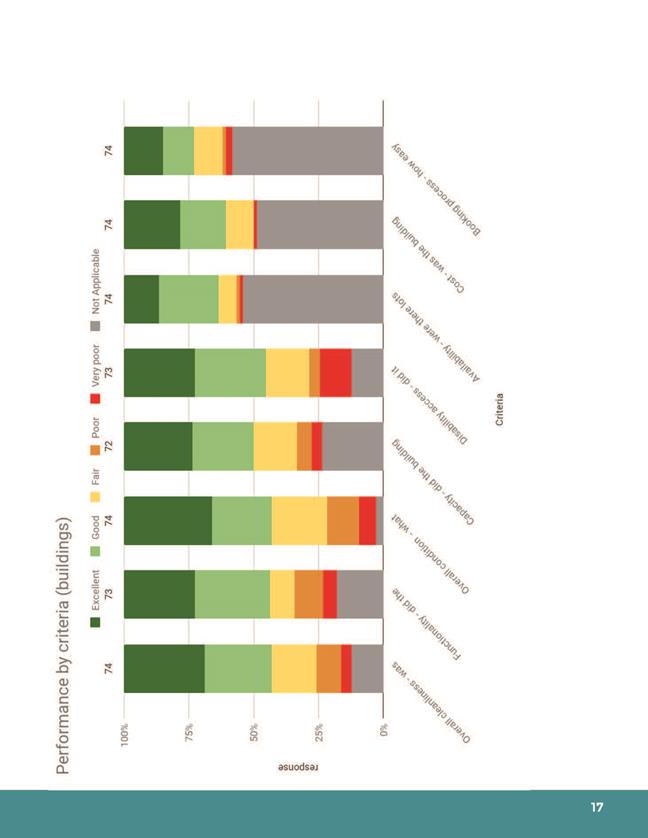
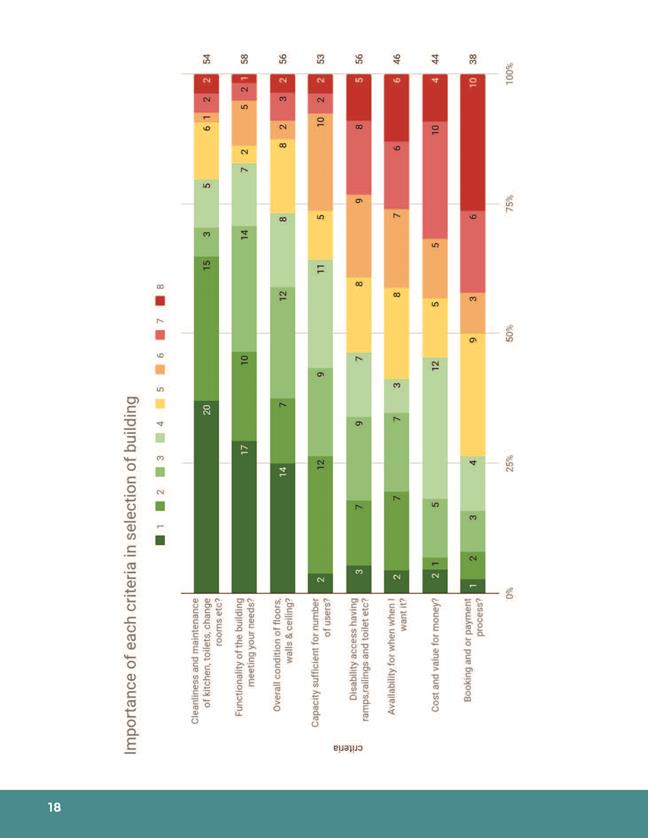
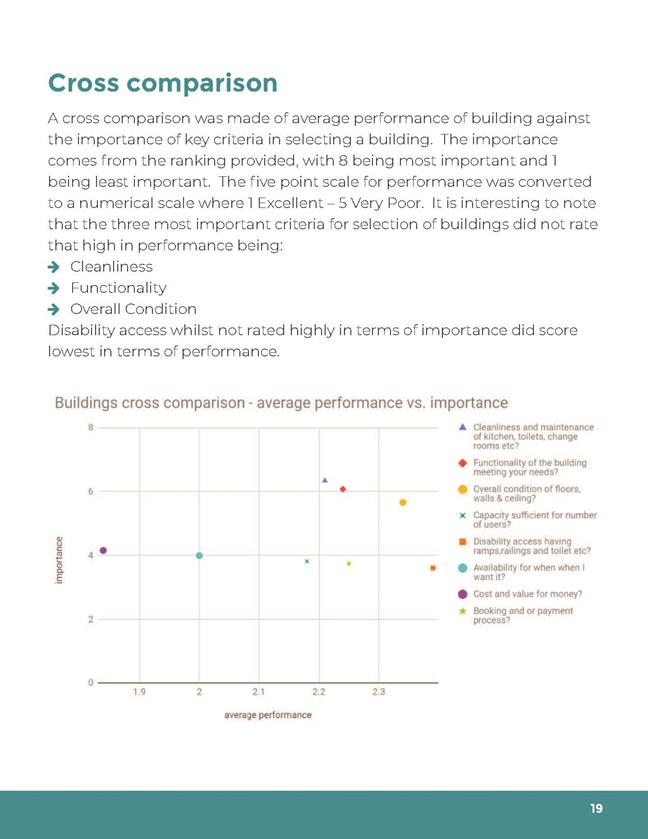
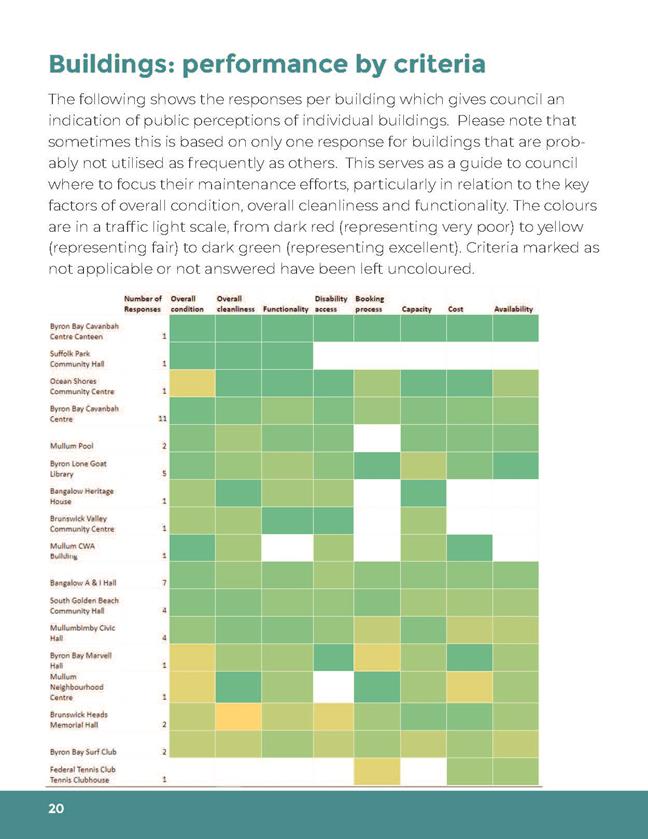
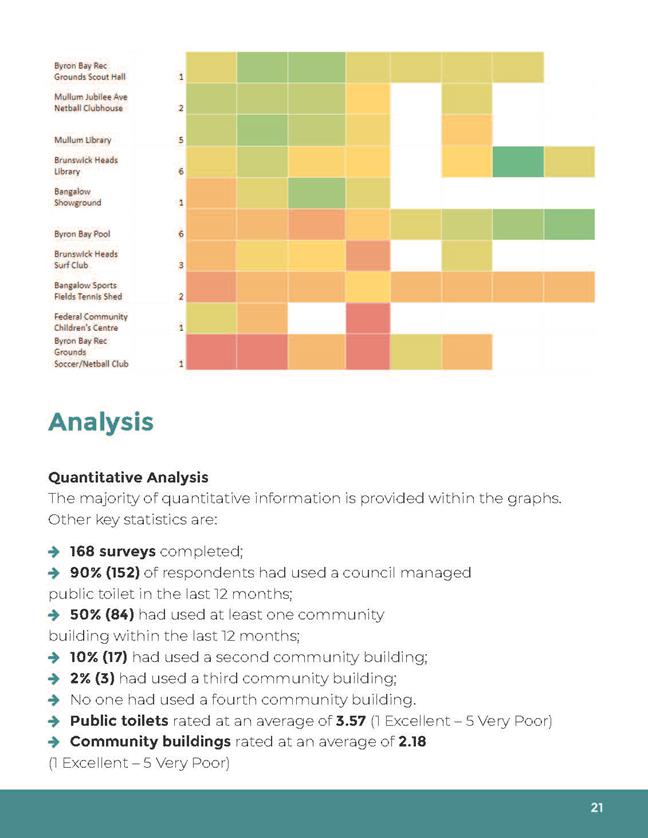

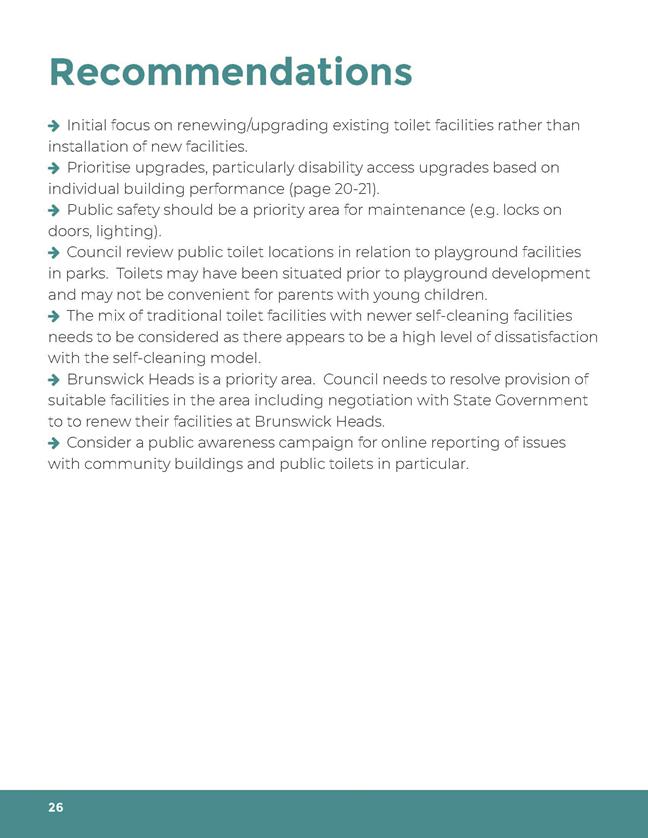
19. References
Australian Standards AS1428.1 2009, Design for
access and mobility Part 1: General requirements for access - New building
work. (2009).
Australian Standards AS1428.2 1992, Design for
access and mobility Part 2: Enhanced and additional requirements - Buildings
and facilities. (1992).
Byron Shire Council. (2008). Byron Shire
Bike Strategy and Action Plan. Mullumbimby: Byron Shire Council.
Byron Shire Council. (2012). Byron Shire
Developer Contribution Plan 2012. Mullumbimby: Byron Shire Council.
Byron Shire Council. (2016). Long Term
Financial Plan 2016-2026. Mullumbimby: Byron Shire Council.
Byron Shire Council. (2016). Strategic Asset
Management Plan. Mullumbimby: Byron Shire Council.
Byron Shire Council. (2017). Draft
Infrastructure Services Risk Management Procedures. Mullumbimby: Byron
Shire Council.
Byron Shire Council. (2017). Workforce Plan
2017-2021. Mullumbimby: Byron Shire Council.
Byron Shire Council. (n.d.). Asset
Assessment Manual Condition, Functionality and Capacity. Mullumbimby: Byron
Shire Council.
Micromex Research. (2016). Byron Shire
Council Asset Management Survey. Mullumbimby: Byron Shire Council.
PublicWorksTraining.com. (2017, August 29). Roadway
Asset Management for Counties, Cities, Towns and Villages. Retrieved from
PublicWorksTraining.com:
https://www.publicworkstraining.com/tam-bundle?lightbox=dataItem-ipqvpzk5
Short, B. (2016). Level of Service - Sealed
Road Network #I2016/108. Mullumbimby: Byron Shire Council.
SPOT Satellite Personal Tracker. (2017,
September 19). SPOT. Retrieved from SPOT: https://www.findmespot.com/en/
Staff Reports - Infrastructure Services 4.1 - Attachment 2
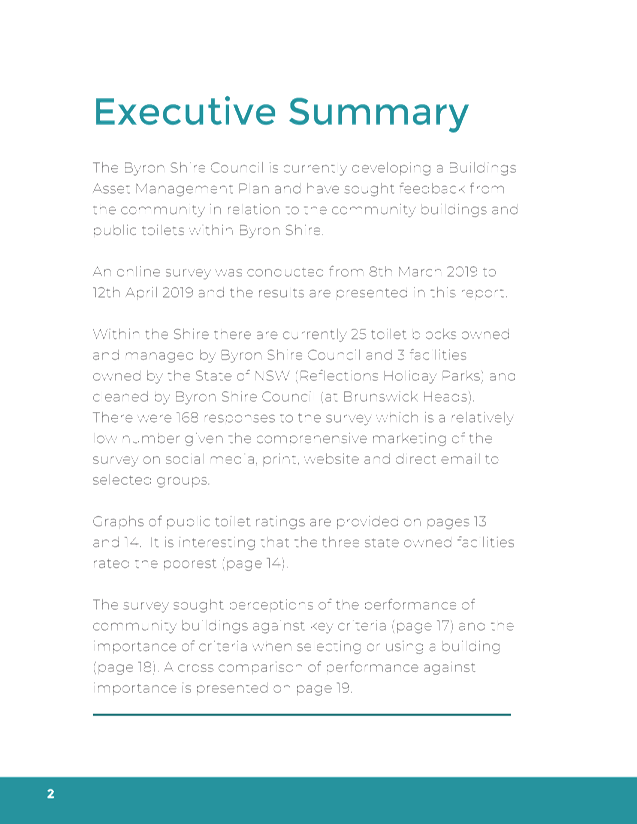
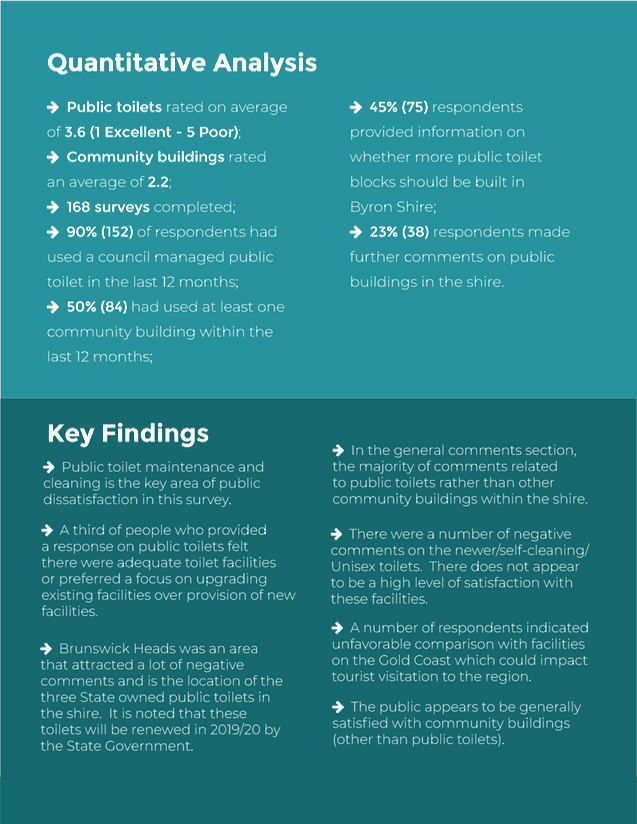
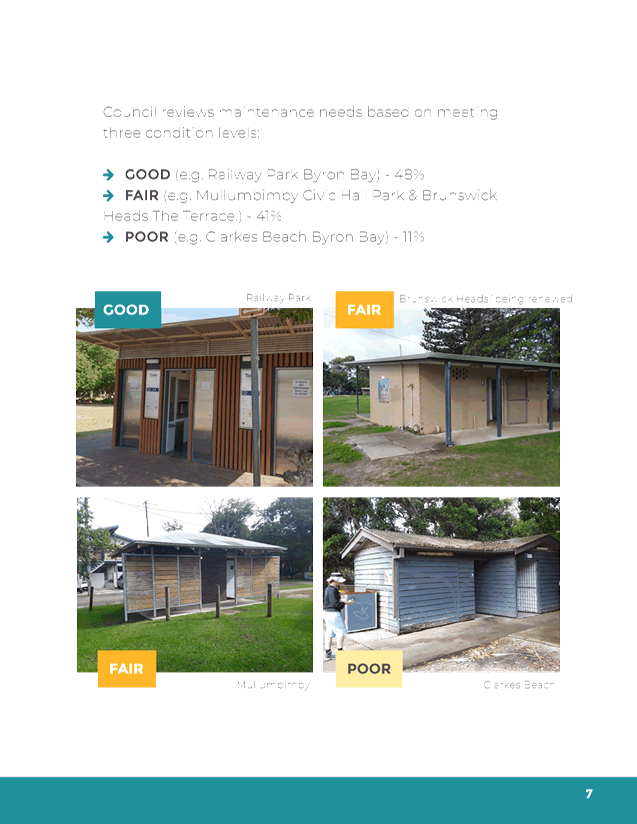
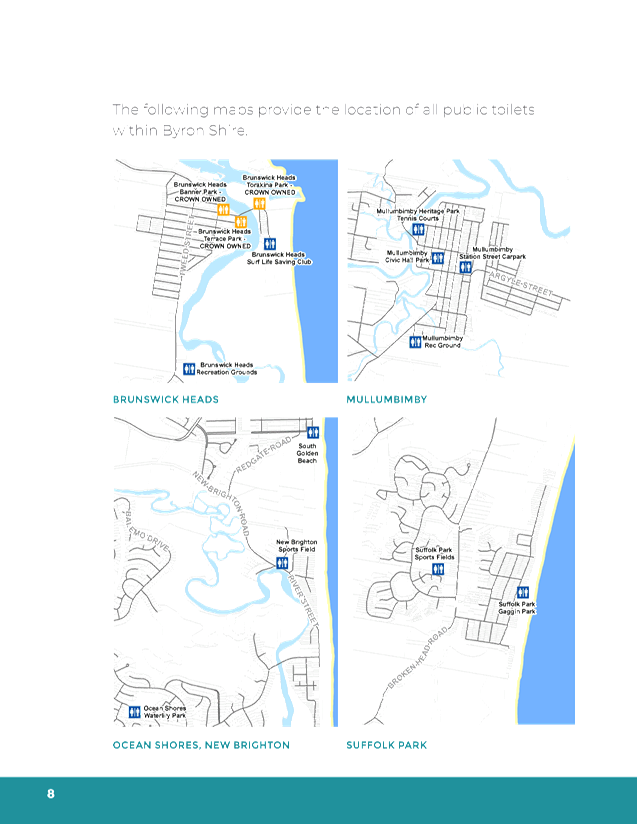
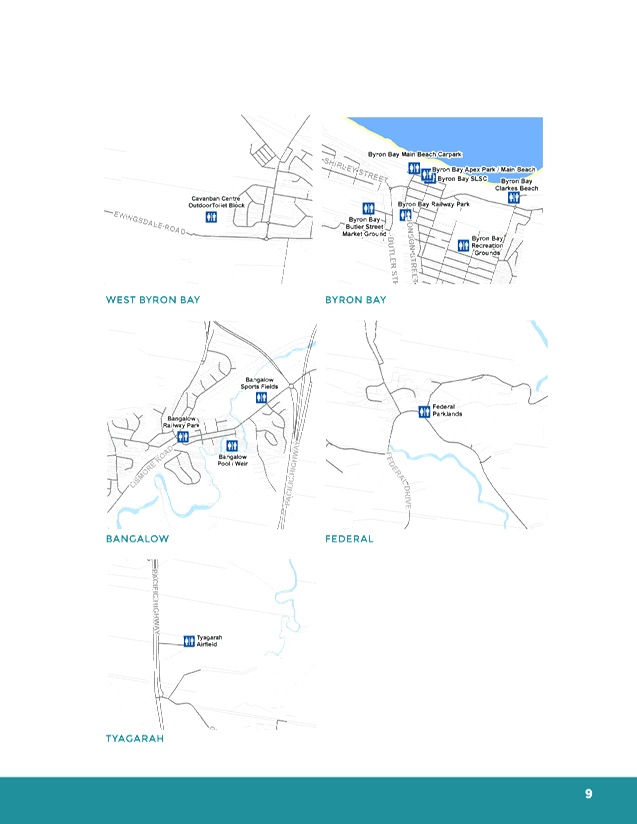
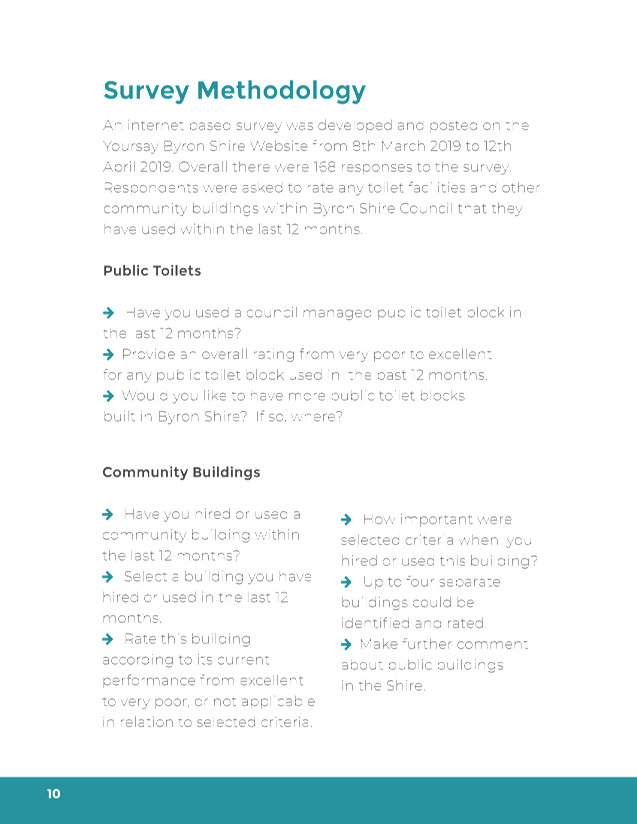
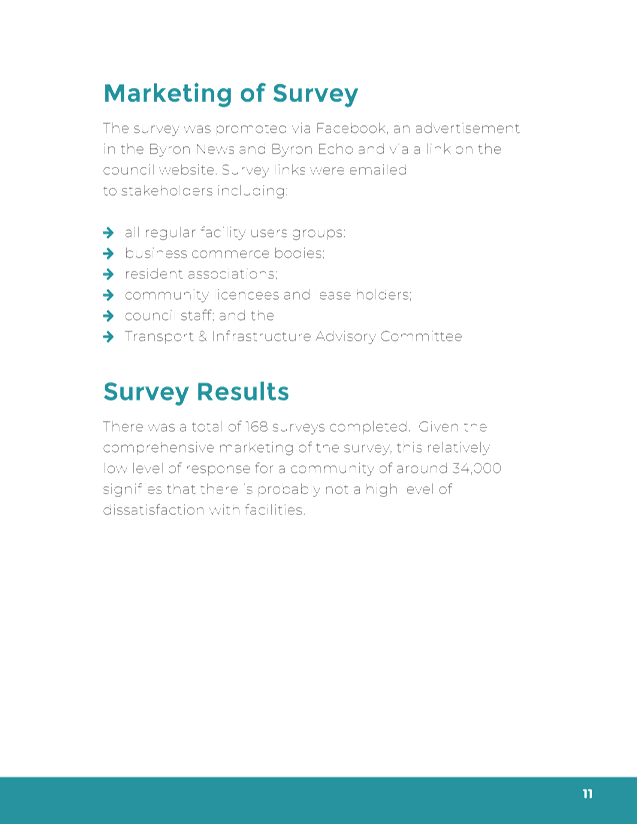
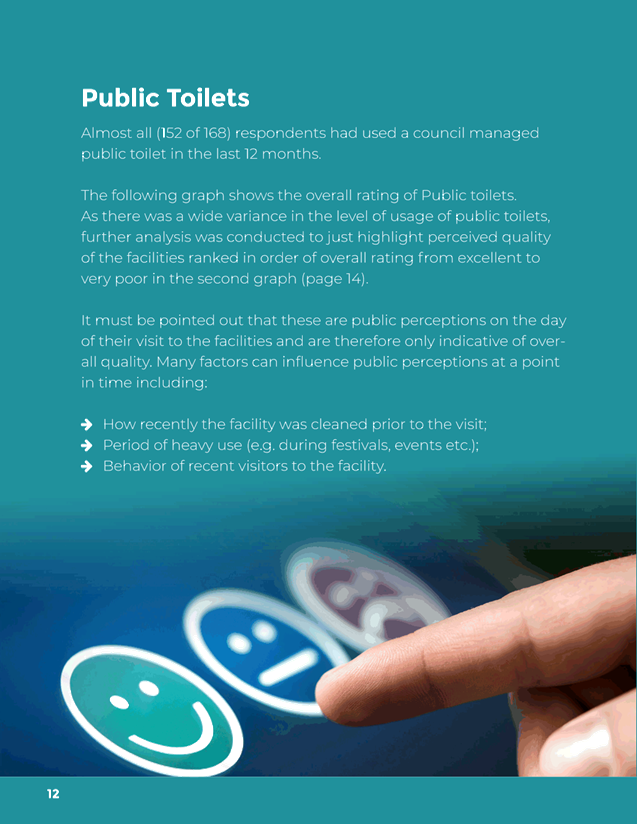
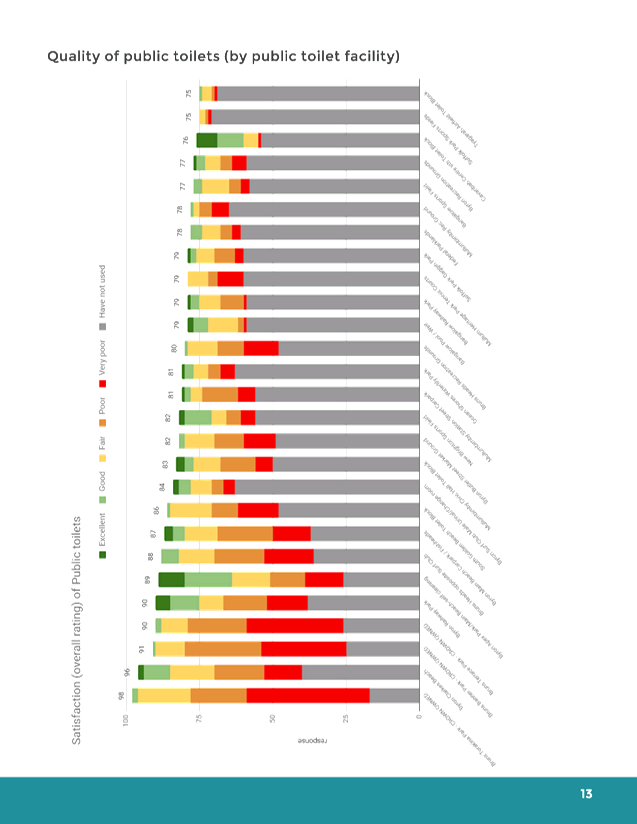
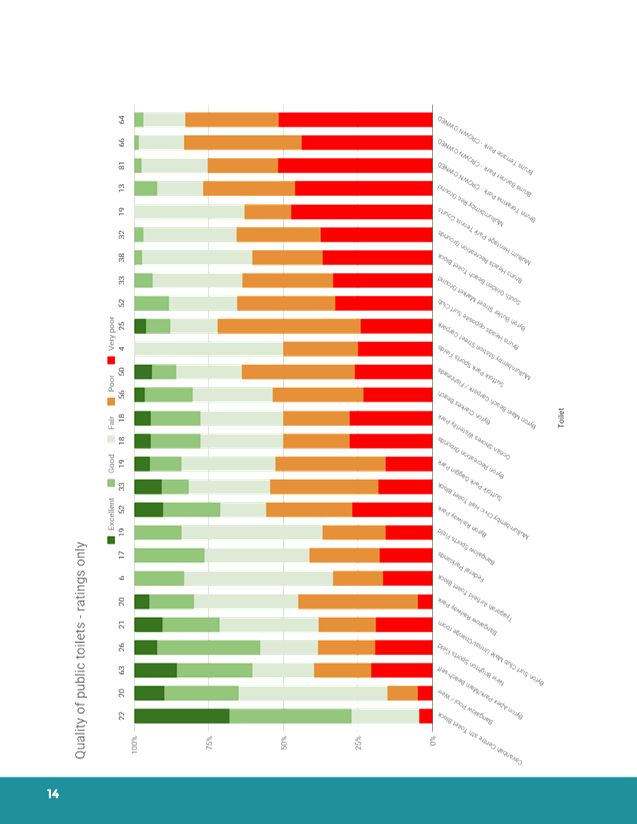
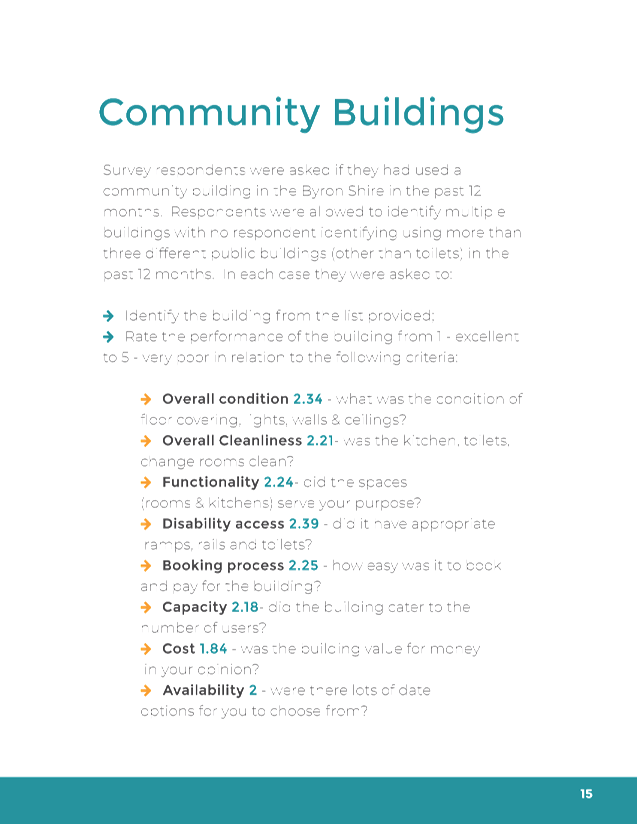
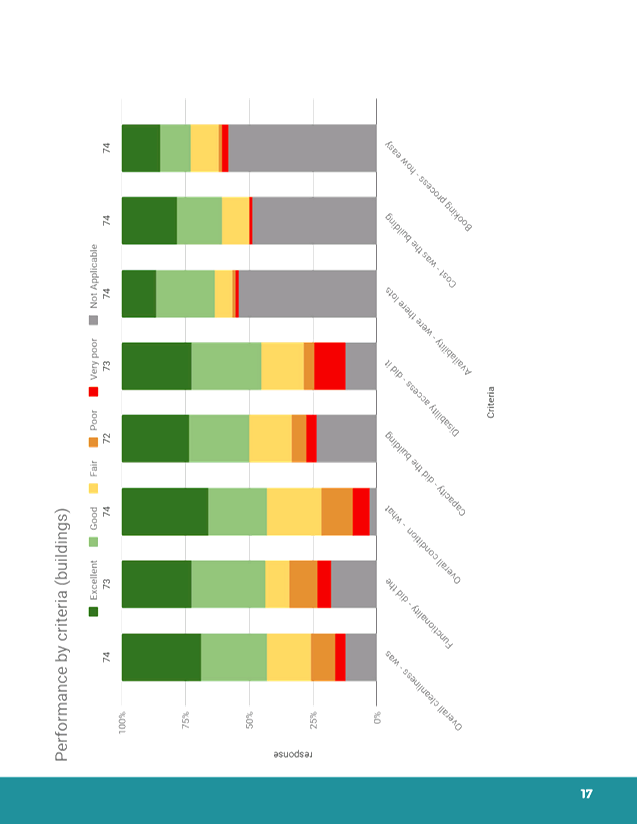
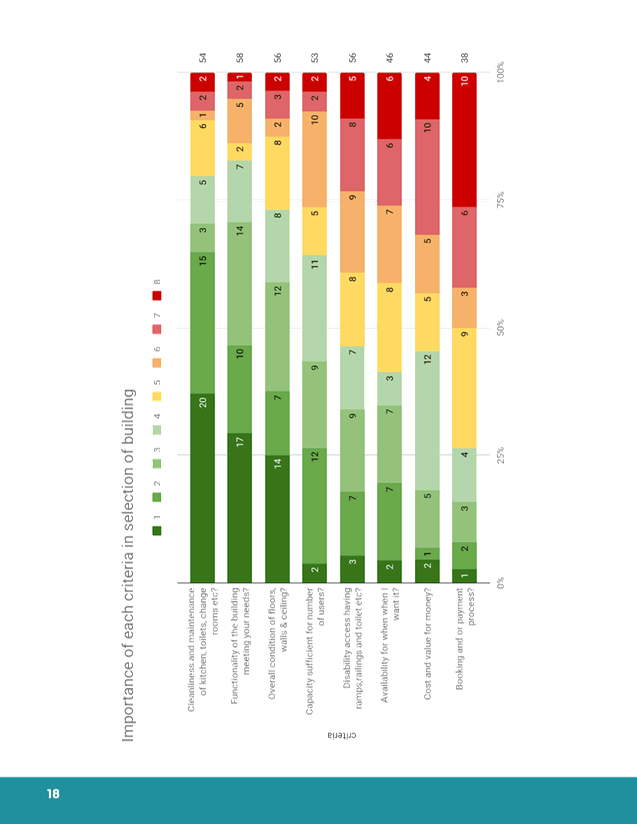
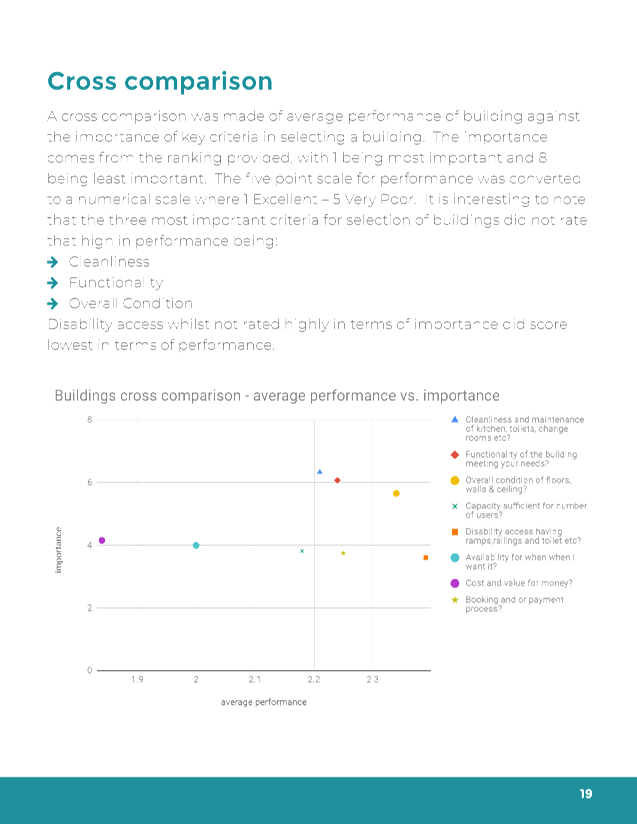
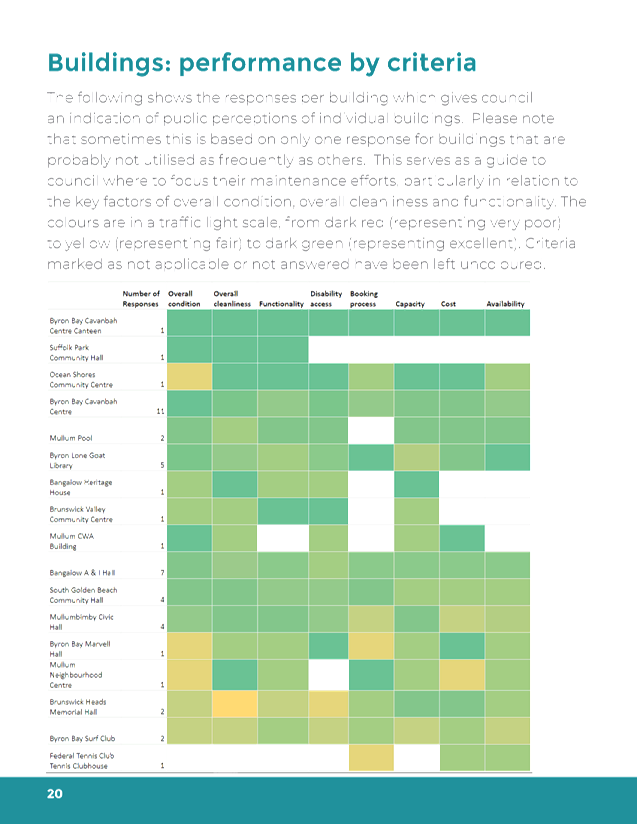

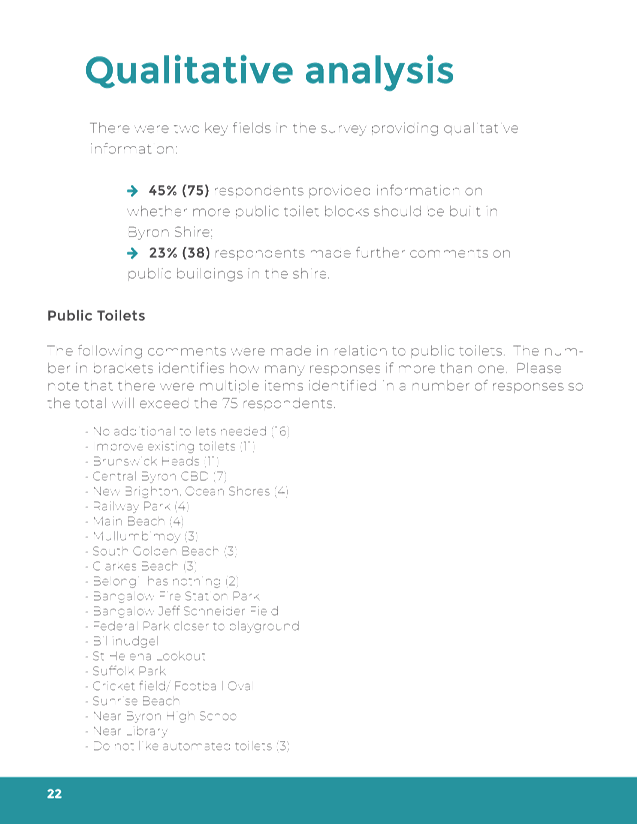
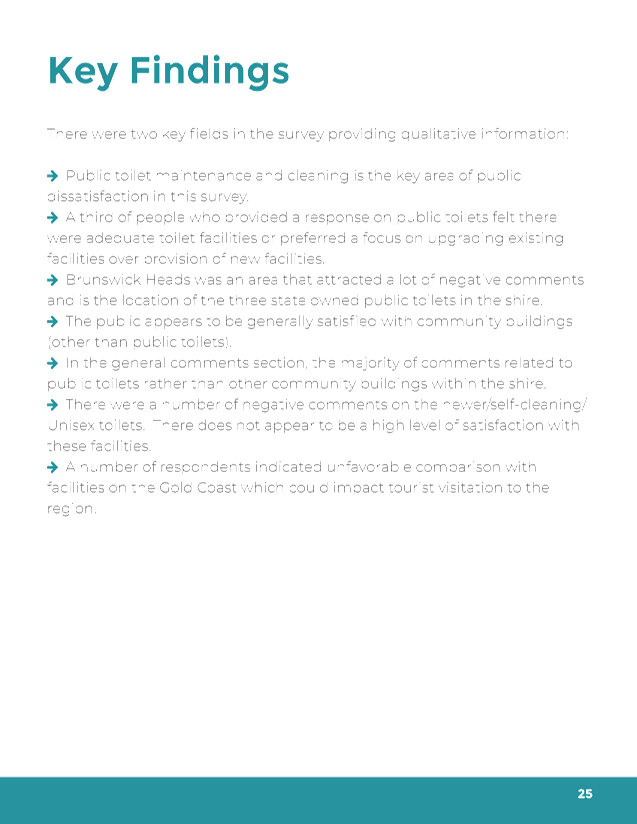
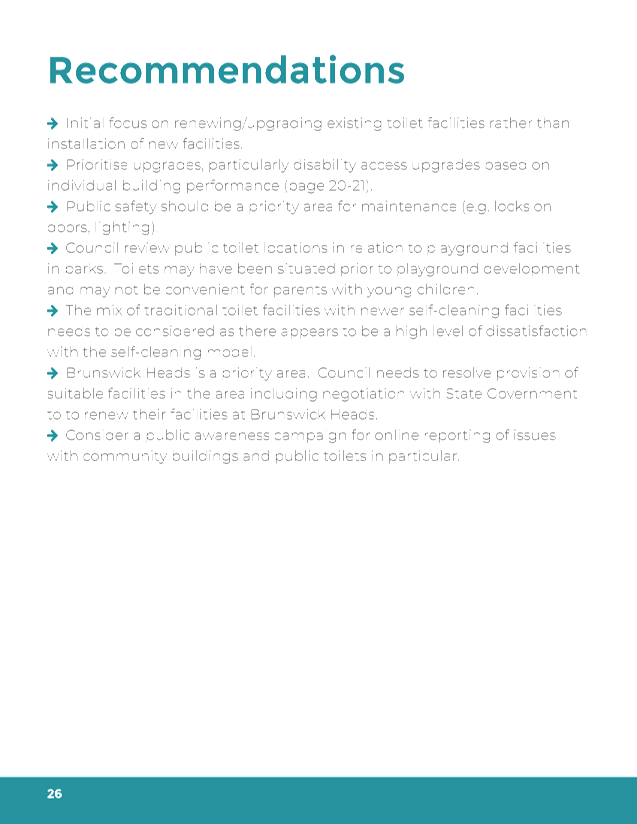
Staff Reports - Infrastructure Services 4.1 - Attachment 3
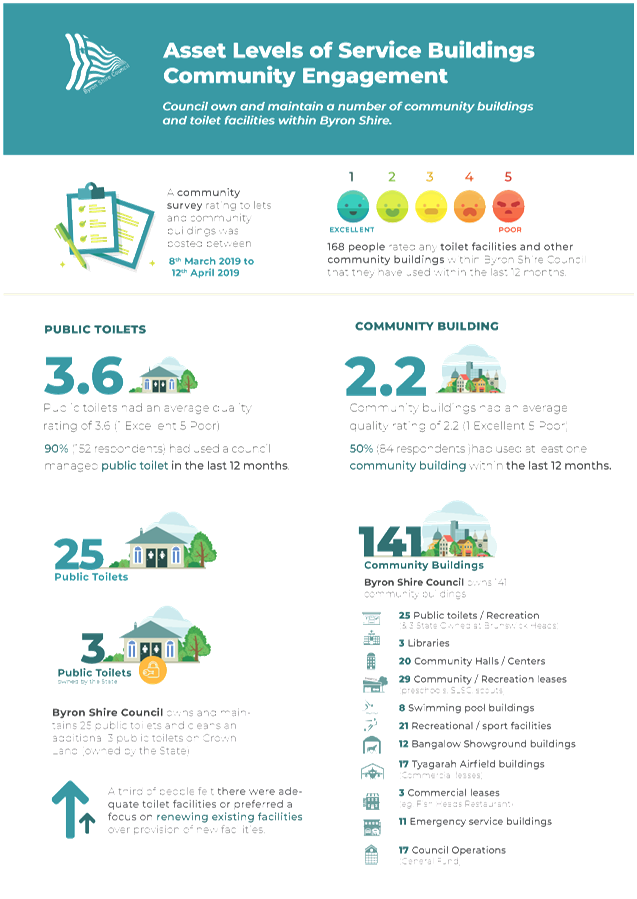
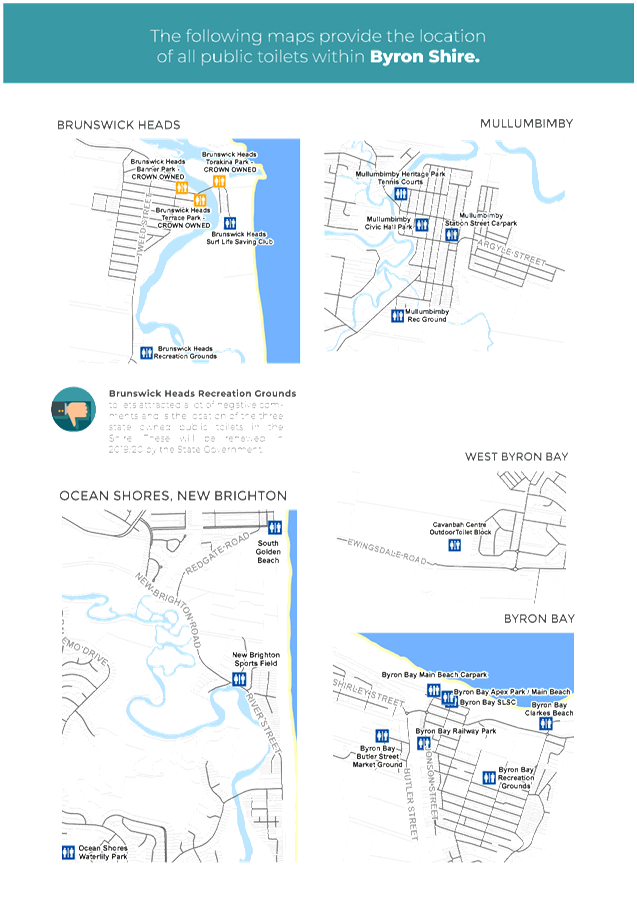
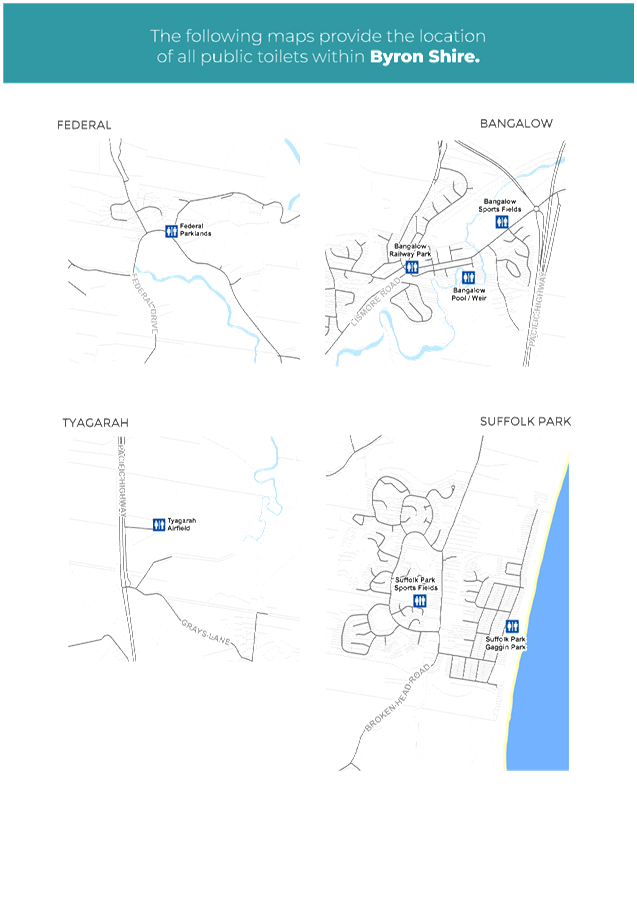
Staff Reports - Infrastructure Services 4.2
Report No. 4.2 Sealed
Road Condition Survey update and Road Revaluation progress
Directorate: Infrastructure
Services
Report Author: Craig
Purdy, Asset Engineer
File No: I2019/1496
Summary:
To update the committee members on the Sealed Road condition
survey as well as the progress made towards the Road Revaluation process.
|
RECOMMENDATION:
1. That
the Committee note the report.
|
Sealed Road Condition Survey
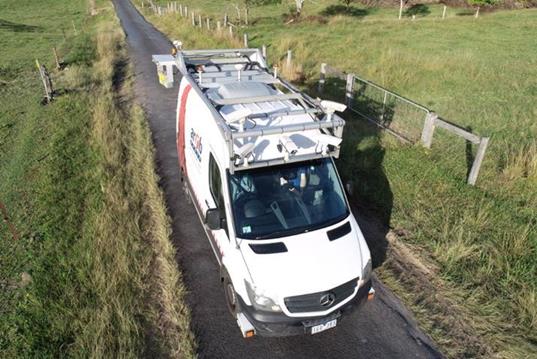
Figure 1 – Road
Survey Vehicle
The Australian Road Research Board (ARRB) was successful in
its application to undertake Councils full sealed road condition assessment.
The data is collected via a network survey vehicle (see
figure 1 above) that consists of digital laser profilers, digital imaging
systems, spread–line lasers, 3D cameras and high accuracy GPS systems.
Using this hardware the following elements of road condition
can be recorded:
· Roughness
· Rutting
· Surface Texture
· Crocodile Cracking
· Block Cracking
· Longitudinal
Cracking
· Transverse
Cracking
· Patch repairs
· Potholes
· Ravelling
· Stripping
· Flushing/Bleeding
· Other localised
failures
· Road Sign
Condition
· Kerb and Gutter
Condition
· Linemarking
Condition
· Road Surface Type
· Average Road
Widths
· Cross fall,
Gradient and Radius of Curvature
This data gets fed into our Asset Register, Geographic
Information Systems (GIS) as well as our predictive modelling software.
The reasons Council undertake full sealed road network
condition assessments are as follows:-
· Mandatory yearly
condition reporting to the State Government via the Special Schedule 7
framework.
· Full road asset
revaluation every 5 years (this is discussed in detail later in the report).
· Road condition
data feeds into our Predictor modelling software to enable us to:
o Produce a prioritised
year-by-year capital works program
o Allocate available funding in
the optimal way to extend asset lives and improve service levels
o Determine long-term funding
requitements to achieve desired service levels
o Compare different scenarios to
demonstrate the impact of increased or decreased funding to inform capital
investment decisions.
o Enable Council to make fully
open and transparent, scientific decisions for the community in regards to road
renewals
The survey part of the project has been fully
completed. The data analysis component has just begun. It is
expected to have some outputs from Predictor™ and visual maps in the next
couple of weeks. This will include a 10 year Capital Works schedule that
includes all budgetary restraints.
An example of what can be produced from the data is shown
below in Figure 2 – Cracking percentage at 10m. This is a powerful
visualisation of cracking occurring at each 10m point along all sealed road
segments. This helps us understand road condition at a network level, but
also helps design reconstructions of roads at the project level as well.
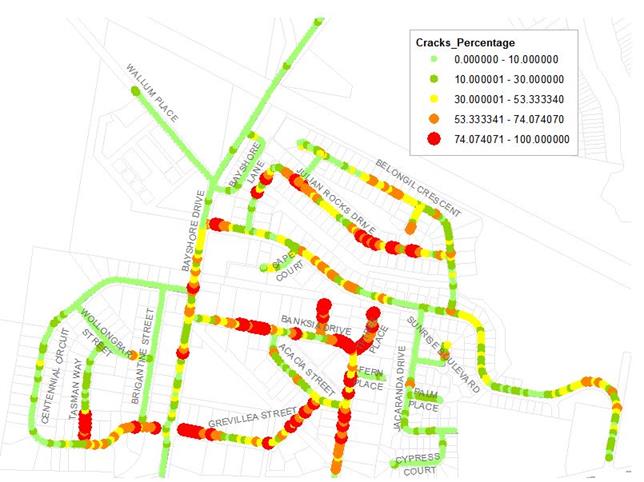
Figure 2
– Cracking percentage at 10m
Another example can be seen
below in Figure 3 – Road line marking condition. This clearly
identifies the condition and location of all line marking in the shire. This
will enable line marking maintenance and capital work schedules to be created.
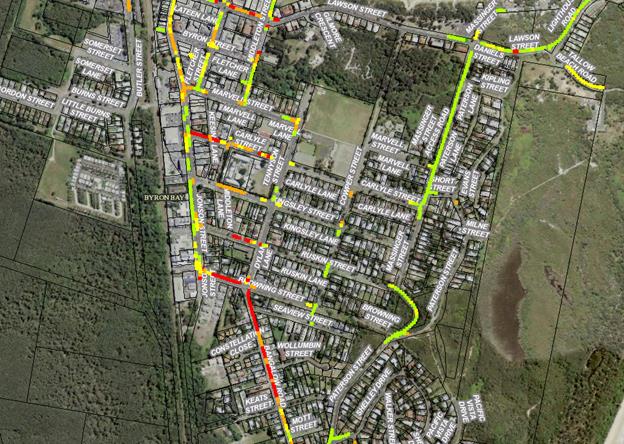
Figure 3 – Road
Linemarking Condition
Road Revaluation
It is a financial local government
requirement that Councils assets are revalued systematically. This financial
year, Council is required to complete a revaluation on all Road related
assets. These assets are as follows:
· Sealed Roads
(515km)
· Unsealed Roads
(93km)
· Footpaths/Shared
paths (91km)
Kerb and gutter (267km)
· Traffic control
devices (751)
· Car parks (31)
· Roadside barriers
(615)
· Roadside furniture
(223)
· Bridges (35)
· Footbridges (17)
· Sign Posts (6012)
· Major Signs (17)
· Retaining Walls
(114)
· Urban Stormwater
Pipes (4670)
· Urban Stormwater
Pits (5323)
· Urban Stormwater
Open drains (765)
· Urban Flood Levee
walls (3)
· Urban Flood pumps
(1)
· Urban Flood gates
(18)
· Urban Retention
basins (41)
· Rural Causeways
(83)
· Rural Major
Culverts (106)
· Rural Minor Pipe
Culverts (1332)
· Rural table drains
(46)
To have a valid revaluation, a
minimum of 15% of each of the above asset classes need to be condition assessed
within the past 12 months of valuation date. This is a huge undertaking
as this relates to thousands of condition inspections that are required to take
place. Some of these inspections, like urban stormwater pipes, require
the use of remote controlled cameras which requires large amounts of set up and
pack up time. A revaluation specialist will apply appropriate useful
remaining lives and apply a value to each asset.
The Sealed Road condition survey
will feed directly into this revaluation and we will receive condition
assessments on all 515km of sealed road as well as sign posts and kerb and
gutter conditions.
This huge asset condition
assessment task has already started to enable completion by May 2020.
The results of these asset condition assessments will be
reported back to this committee once all completed.